Grundläggande statistik
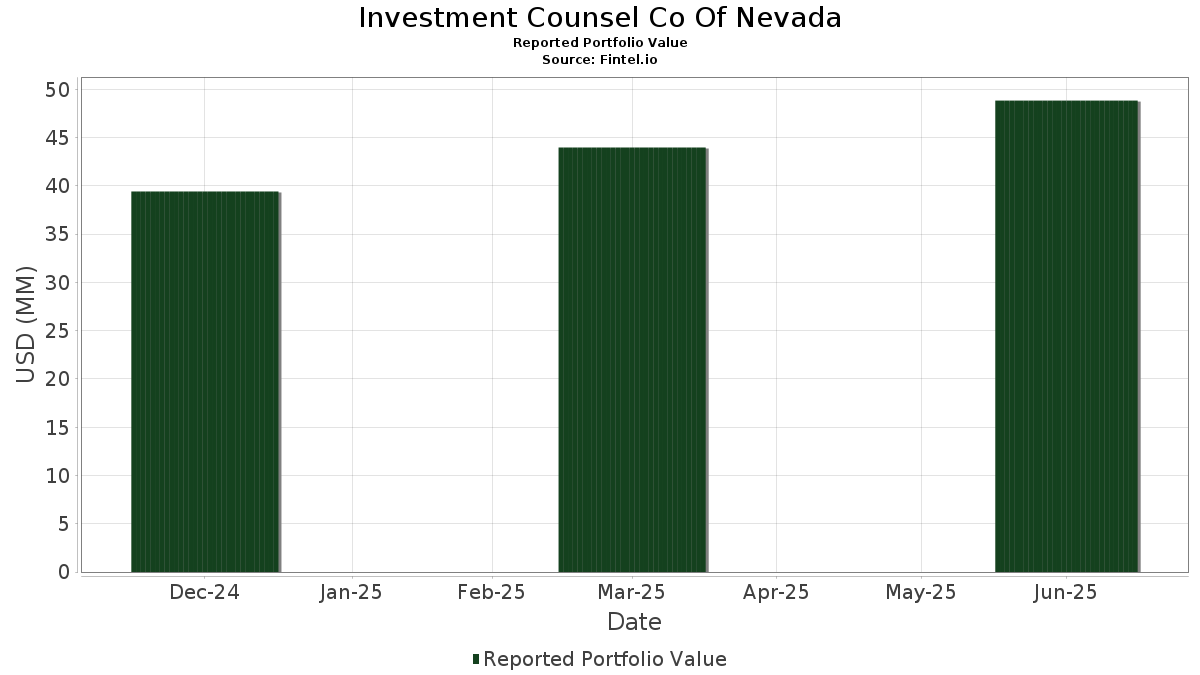
| Portföljvärde | $ 48 842 610 |
| Aktuella positioner | 79 |
Senaste innehav, resultat, förvaltat kapital (från 13F, 13D)
Investment Counsel Co Of Nevada har redovisat 79 totala innehav i sina senaste SEC-arkiveringar. Det senaste portföljvärdet beräknas vara $ 48 842 610 USD. Faktiskt förvaltade tillgångar (AUM) är detta värde plus likvida medel (som inte redovisas). Investment Counsel Co Of Nevadas största innehav är Vanguard Index Funds - Vanguard S&P 500 ETF (US:VOO) , J.P. Morgan Exchange-Traded Fund Trust - JPMorgan Core Plus Bond ETF (US:JCPB) , Johnson & Johnson (US:JNJ) , iShares Trust - iShares ESG Aware U.S. Aggregate Bond ETF (US:EAGG) , and Apple Inc. (US:AAPL) . Investment Counsel Co Of Nevadas nya positioner inkluderar GBank Financial Holdings Inc. (US:GBFH) , iShares Trust - iShares Core S&P Total U.S. Stock Market ETF (US:ITOT) , Reading International, Inc. (US:RDIB) , Goldman Sachs ETF Trust - Goldman Sachs ActiveBeta U.S. Large Cap Equity ETF (US:GSLC) , and Schlumberger Limited (US:SLB) .
Största ökningarna detta kvartal
Vi använder förändringen i portföljallokeringen eftersom det är det mest meningsfulla måttet. Förändringar kan bero på transaktioner eller förändringar i aktiekurser.
| Värdepapper | Aktier (MM) |
Värde (MM$) |
Portfölj % av | ΔPortfölj % av |
|---|---|---|---|---|
| 0,10 | 4,76 | 9,7363 | 8,7362 | |
| 0,00 | 1,32 | 2,7026 | 2,6311 | |
| 0,00 | 0,67 | 1,3683 | 0,4916 | |
| 0,01 | 0,23 | 0,4712 | 0,4712 | |
| 0,01 | 1,30 | 2,6639 | 0,3634 | |
| 0,00 | 0,93 | 1,9096 | 0,3102 | |
| 0,00 | 0,13 | 0,2566 | 0,2566 | |
| 0,01 | 0,66 | 1,3436 | 0,2292 | |
| 0,01 | 0,11 | 0,2239 | 0,2239 | |
| 0,00 | 0,08 | 0,1707 | 0,1707 |
Största minskningarna detta kvartal
Vi använder förändringen i portföljallokeringen eftersom det är det mest meningsfulla måttet. Förändringar kan bero på transaktioner eller förändringar i aktiepriser.
| Värdepapper | Aktier (MM) |
Värde (MM$) |
Portfölj % av | ΔPortfölj % av |
|---|---|---|---|---|
| 0,03 | 4,05 | 8,2886 | −1,7050 | |
| 0,01 | 2,26 | 4,6216 | −0,9351 | |
| 0,05 | 2,34 | 4,7964 | −0,4711 | |
| 0,00 | 0,34 | 0,7060 | −0,2982 | |
| 0,00 | 0,32 | 0,6649 | −0,2413 | |
| 0,00 | 0,02 | 0,0431 | −0,1522 | |
| 0,00 | 0,67 | 1,3654 | −0,1503 | |
| 0,02 | 0,43 | 0,8715 | −0,1497 | |
| 0,03 | 15,22 | 31,1607 | −0,1474 | |
| 0,09 | 0,81 | 1,6658 | −0,1319 |
13F- och fond arkiveringar
Denna blankett lämnades in den 2025-08-13 för rapporteringsperioden 2025-06-30. Klicka på länksymbolen för att se hela transaktionshistoriken.
Uppgradera för att låsa upp premiumdata och exportera till Excel![]() .
.
| Värdepapper | Typ | Genomsnittligt aktiepris | Aktier (MM) |
ΔAktier (%) |
ΔAktier (%) |
Värde ($MM) |
Portfölj (%) |
ΔPortfölj (%) |
|
|---|---|---|---|---|---|---|---|---|---|
| VOO / Vanguard Index Funds - Vanguard S&P 500 ETF | 0,03 | 0,00 | 15,22 | 10,53 | 31,1607 | −0,1474 | |||
| JCPB / J.P. Morgan Exchange-Traded Fund Trust - JPMorgan Core Plus Bond ETF | 0,10 | 980,64 | 4,76 | 983,14 | 9,7363 | 8,7362 | |||
| JNJ / Johnson & Johnson | 0,03 | 0,00 | 4,05 | −7,90 | 8,2886 | −1,7050 | |||
| EAGG / iShares Trust - iShares ESG Aware U.S. Aggregate Bond ETF | 0,05 | 0,99 | 2,34 | 1,12 | 4,7964 | −0,4711 | |||
| AAPL / Apple Inc. | 0,01 | 0,00 | 2,26 | −7,61 | 4,6216 | −0,9351 | |||
| SNPE / DBX ETF Trust - Xtrackers S&P 500 Scored & Screened ETF | 0,03 | 0,29 | 1,91 | 10,01 | 3,9176 | −0,0384 | |||
| VV / Vanguard Index Funds - Vanguard Large-Cap ETF | 0,01 | 0,00 | 1,47 | 11,04 | 3,0081 | −0,0015 | |||
| IVV / iShares Trust - iShares Core S&P 500 ETF | 0,00 | 3 696,43 | 1,32 | 4 158,06 | 2,7026 | 2,6311 | |||
| GE / General Electric Company | 0,01 | 0,00 | 1,30 | 28,68 | 2,6639 | 0,3634 | |||
| VB / Vanguard Index Funds - Vanguard Small-Cap ETF | 0,00 | 0,00 | 0,94 | 6,86 | 1,9154 | −0,0750 | |||
| MSFT / Microsoft Corporation | 0,00 | 0,05 | 0,93 | 32,57 | 1,9096 | 0,3102 | |||
| ISRG / Intuitive Surgical, Inc. | 0,00 | 0,00 | 0,88 | 9,70 | 1,8068 | −0,0220 | |||
| TYRA / Tyra Biosciences, Inc. | 0,09 | 0,00 | 0,81 | 2,91 | 1,6658 | −0,1319 | |||
| GEV / GE Vernova Inc. | 0,00 | 0,00 | 0,67 | 73,51 | 1,3683 | 0,4916 | |||
| HD / The Home Depot, Inc. | 0,00 | 0,00 | 0,67 | 0,00 | 1,3654 | −0,1503 | |||
| LRCX / Lam Research Corporation | 0,01 | 0,00 | 0,66 | 33,88 | 1,3436 | 0,2292 | |||
| V / Visa Inc. | 0,00 | 0,00 | 0,61 | 1,32 | 1,2540 | −0,1206 | |||
| VTI / Vanguard Index Funds - Vanguard Total Stock Market ETF | 0,00 | 0,35 | 0,52 | 10,87 | 1,0663 | −0,0008 | |||
| VYMI / Vanguard Whitehall Funds - Vanguard International High Dividend Yield ETF | 0,01 | 0,00 | 0,48 | 8,58 | 0,9861 | −0,0212 | |||
| ADBE / Adobe Inc. | 0,00 | 0,00 | 0,47 | 0,87 | 0,9529 | −0,0962 | |||
| BLK / BlackRock, Inc. | 0,00 | 0,00 | 0,46 | 10,98 | 0,9323 | −0,0016 | |||
| CTAS / Cintas Corporation | 0,00 | 0,00 | 0,45 | 8,27 | 0,9126 | −0,0220 | |||
| SCHD / Schwab Strategic Trust - Schwab U.S. Dividend Equity ETF | 0,02 | 0,00 | 0,43 | −5,35 | 0,8715 | −0,1497 | |||
| FI / Fiserv, Inc. | 0,00 | 0,00 | 0,34 | −22,00 | 0,7060 | −0,2982 | |||
| AMZN / Amazon.com, Inc. | 0,00 | 2,52 | 0,34 | 18,53 | 0,6944 | 0,0421 | |||
| TSLA / Tesla, Inc. | 0,00 | 4,04 | 0,34 | 27,38 | 0,6874 | 0,0888 | |||
| TMO / Thermo Fisher Scientific Inc. | 0,00 | 0,00 | 0,32 | −18,59 | 0,6649 | −0,2413 | |||
| NVDA / NVIDIA Corporation | 0,00 | 0,00 | 0,32 | 45,45 | 0,6566 | 0,1564 | |||
| SBUX / Starbucks Corporation | 0,00 | 0,00 | 0,32 | −6,51 | 0,6472 | −0,1222 | |||
| ACN / Accenture plc | 0,00 | 0,00 | 0,30 | −4,10 | 0,6236 | −0,0994 | |||
| SPY / SPDR S&P 500 ETF | 0,00 | 2,95 | 0,28 | 13,41 | 0,5732 | 0,0134 | |||
| GBFH / GBank Financial Holdings Inc. | 0,01 | 0,23 | 0,4712 | 0,4712 | |||||
| PLTR / Palantir Technologies Inc. | 0,00 | 0,00 | 0,22 | 61,31 | 0,4533 | 0,1416 | |||
| RMD / ResMed Inc. | 0,00 | 0,00 | 0,21 | 15,08 | 0,4226 | 0,0154 | |||
| SYK / Stryker Corporation | 0,00 | 0,00 | 0,20 | 5,91 | 0,4050 | −0,0182 | |||
| GOOGL / Alphabet Inc. | 0,00 | 0,10 | 0,18 | 14,29 | 0,3612 | 0,0096 | |||
| ADP / Automatic Data Processing, Inc. | 0,00 | 0,00 | 0,15 | 1,32 | 0,3157 | −0,0316 | |||
| ITOT / iShares Trust - iShares Core S&P Total U.S. Stock Market ETF | 0,00 | 0,13 | 0,2566 | 0,2566 | |||||
| GEHC / GE HealthCare Technologies Inc. | 0,00 | 0,00 | 0,12 | −8,15 | 0,2549 | −0,0536 | |||
| RDIB / Reading International, Inc. | 0,01 | 0,11 | 0,2239 | 0,2239 | |||||
| FBTC / Fidelity Wise Origin Bitcoin Fund | 0,00 | 0,00 | 0,10 | 31,08 | 0,1996 | 0,0299 | |||
| GSLC / Goldman Sachs ETF Trust - Goldman Sachs ActiveBeta U.S. Large Cap Equity ETF | 0,00 | 0,08 | 0,1707 | 0,1707 | |||||
| BYD / Boyd Gaming Corporation | 0,00 | 0,00 | 0,08 | 20,00 | 0,1602 | 0,0105 | |||
| SGOV / iShares Trust - iShares 0-3 Month Treasury Bond ETF | 0,00 | 1,09 | 0,08 | 1,35 | 0,1536 | −0,0152 | |||
| SLB / Schlumberger Limited | 0,00 | 0,07 | 0,1491 | 0,1491 | |||||
| XOM / Exxon Mobil Corporation | 0,00 | 0,00 | 0,07 | −9,59 | 0,1357 | −0,0306 | |||
| OEF / iShares Trust - iShares S&P 100 ETF | 0,00 | 0,06 | 0,1209 | 0,1209 | |||||
| GMED / Globus Medical, Inc. | 0,00 | 0,00 | 0,06 | −19,18 | 0,1208 | −0,0456 | |||
| VONG / Vanguard Scottsdale Funds - Vanguard Russell 1000 Growth ETF | 0,00 | 0,20 | 0,05 | 17,39 | 0,1116 | 0,0064 | |||
| MGM / MGM Resorts International | 0,00 | 0,00 | 0,05 | 17,78 | 0,1089 | 0,0047 | |||
| WAB / Westinghouse Air Brake Technologies Corporation | 0,00 | 0,00 | 0,05 | 16,28 | 0,1024 | 0,0039 | |||
| CSCO / Cisco Systems, Inc. | 0,00 | 0,00 | 0,05 | 11,63 | 0,0994 | 0,0012 | |||
| RDI / Reading International, Inc. | 0,04 | 0,05 | 0,0993 | 0,0993 | |||||
| EMX / EMX Royalty Corporation | 0,02 | 0,00 | 0,05 | 23,68 | 0,0972 | 0,0098 | |||
| JPM / JPMorgan Chase & Co. | 0,00 | 0,64 | 0,05 | 18,42 | 0,0933 | 0,0061 | |||
| GPRK / GeoPark Limited | 0,01 | 0,00 | 0,03 | −19,51 | 0,0687 | −0,0259 | |||
| RSP / Invesco Exchange-Traded Fund Trust - Invesco S&P 500 Equal Weight ETF | 0,00 | 0,03 | 0,0588 | 0,0588 | |||||
| LLY / Eli Lilly and Company | 0,00 | −74,04 | 0,02 | −75,29 | 0,0431 | −0,1522 | |||
| ARKG / ARK ETF Trust - ARK Genomic Revolution ETF | 0,00 | 0,00 | 0,02 | 13,33 | 0,0363 | 0,0019 | |||
| IWB / iShares Trust - iShares Russell 1000 ETF | 0,00 | 0,00 | 0,02 | 6,67 | 0,0348 | −0,0001 | |||
| WFC / Wells Fargo & Company | 0,00 | 0,00 | 0,02 | 14,29 | 0,0328 | 0,0002 | |||
| IWF / iShares Trust - iShares Russell 1000 Growth ETF | 0,00 | 0,01 | 0,0287 | 0,0287 | |||||
| SCHF / Schwab Strategic Trust - Schwab International Equity ETF | 0,00 | 0,00 | 0,01 | 10,00 | 0,0241 | 0,0001 | |||
| CVX / Chevron Corporation | 0,00 | 0,00 | 0,01 | −12,50 | 0,0147 | −0,0044 | |||
| RIVN / Rivian Automotive, Inc. | 0,00 | 0,00 | 0,01 | 0,00 | 0,0141 | −0,0001 | |||
| META / Meta Platforms, Inc. | 0,00 | 0,00 | 0,01 | 25,00 | 0,0106 | 0,0014 | |||
| VNT / Vontier Corporation | 0,00 | 0,00 | 0,00 | 33,33 | 0,0091 | 0,0001 | |||
| WMT / Walmart Inc. | 0,00 | 0,00 | 0,00 | 0,00 | 0,0072 | 0,0000 | |||
| UBER / Uber Technologies, Inc. | 0,00 | 0,00 | 0,00 | 50,00 | 0,0067 | 0,0009 | |||
| NFLX / Netflix, Inc. | 0,00 | 0,00 | 0,00 | 100,00 | 0,0055 | 0,0012 | |||
| IBKR / Interactive Brokers Group, Inc. | 0,00 | 300,00 | 0,00 | 0,00 | 0,0041 | 0,0007 | |||
| COST / Costco Wholesale Corporation | 0,00 | 0,00 | 0,00 | 0,00 | 0,0041 | −0,0002 | |||
| CRM / Salesforce, Inc. | 0,00 | 0,00 | 0,00 | 0,00 | 0,0034 | −0,0003 | |||
| OC / Owens Corning | 0,00 | 0,00 | 0,00 | 0,00 | 0,0023 | −0,0003 | |||
| BKR / Baker Hughes Company | 0,00 | 0,00 | 0,00 | −100,00 | 0,0020 | −0,0005 | |||
| MNKD / MannKind Corporation | 0,00 | 0,00 | 0,00 | 0,0008 | −0,0004 | ||||
| POOL / Pool Corporation | 0,00 | 0,00 | 0,00 | 0,0006 | −0,0001 | ||||
| VTRS / Viatris Inc. | 0,00 | 0,00 | 0,00 | 0,0004 | −0,0000 | ||||
| HST / Host Hotels & Resorts, Inc. | 0,00 | 0,00 | 0,00 | 0,0003 | −0,0000 | ||||
| SCHZ / Schwab Strategic Trust - Schwab U.S. Aggregate Bond ETF | 0,00 | −100,00 | 0,00 | 0,0000 |