Grundläggande statistik
| Institutionella ägare | 290 total, 290 long only, 0 short only, 0 long/short - change of 8,99% MRQ |
| Genomsnittlig portföljallokering | 0.3097 % - change of 0,27% MRQ |
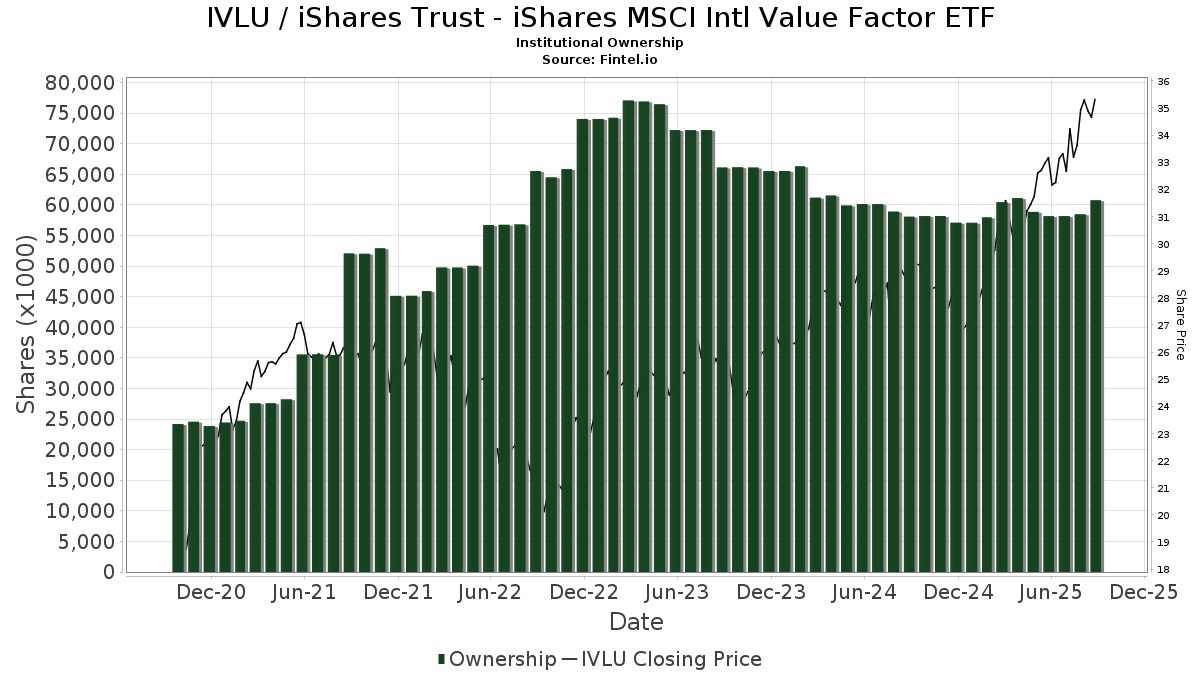
| Institutionella aktier (lång) | 60 741 541 (ex 13D/G) - change of 2,62MM shares 4,51% MRQ |
| Institutionellt värde (lång) | $ 1 968 395 USD ($1000) |
Institutionellt ägande och aktieägare
iShares Trust - iShares MSCI Intl Value Factor ETF (US:IVLU) har 290 Institutionella ägare och aktieägare som har lämnat in 13D/G- eller 13F-formulär till Securities Exchange Commission (SEC). Dessa institut innehar totalt 60,741,541 aktier. Största aktieägare inkluderar Northwestern Mutual Wealth Management Co, Fmr Llc, Jpmorgan Chase & Co, Envestnet Asset Management Inc, Mercer Global Advisors Inc /adv, Colony Group, LLC, Bank Of America Corp /de/, Kathmere Capital Management, LLC, Morgan Stanley, and Armbruster Capital Management, Inc. .
iShares Trust - iShares MSCI Intl Value Factor ETF (ARCA:IVLU) Institutionell ägarstruktur visar institutioners och fonders nuvarande positioner i företaget, samt de senaste förändringarna i positionernas storlek. Större aktieägare kan vara enskilda investerare, fonder, hedgefonder eller institutioner. Bilaga 13D visar att investeraren äger (eller ägde) mer än 5% av företaget och avser (eller avsåg) att aktivt eftersträva en förändring av affärsstrategin. Schedule 13G indikerar en passiv investering på över 5%.
The share price as of September 8, 2025 is 35,42 / share. Previously, on September 9, 2024, the share price was 28,61 / share. This represents an increase of 23,79% over that period.
Fondsentimentets poäng
Fondsentimentet poängen(fka Ägarackumulation-poäng) visar vilka aktier som är mest köpta av fonder. Det är resultatet av en sofistikerad kvantitativ flerfaktormodell som identifierar företag med de högsta nivåerna av institutionell ackumulering. Poängsättningsmodellen använder en kombination av den totala ökningen av redovisade ägare, förändringarna i portföljallokeringarna för dessa ägare och andra mått. Siffran sträcker sig från 0 till 100, där högre siffror indikerar en högre nivå av ackumulering i förhållande till sina konkurrenter, och 50 är genomsnittet.
Uppdateringsfrekvens: Dagligen
Se Ownership Explorer, som innehåller en lista över de högst rankade företagen.
Institutionell sälj/köp-kvot
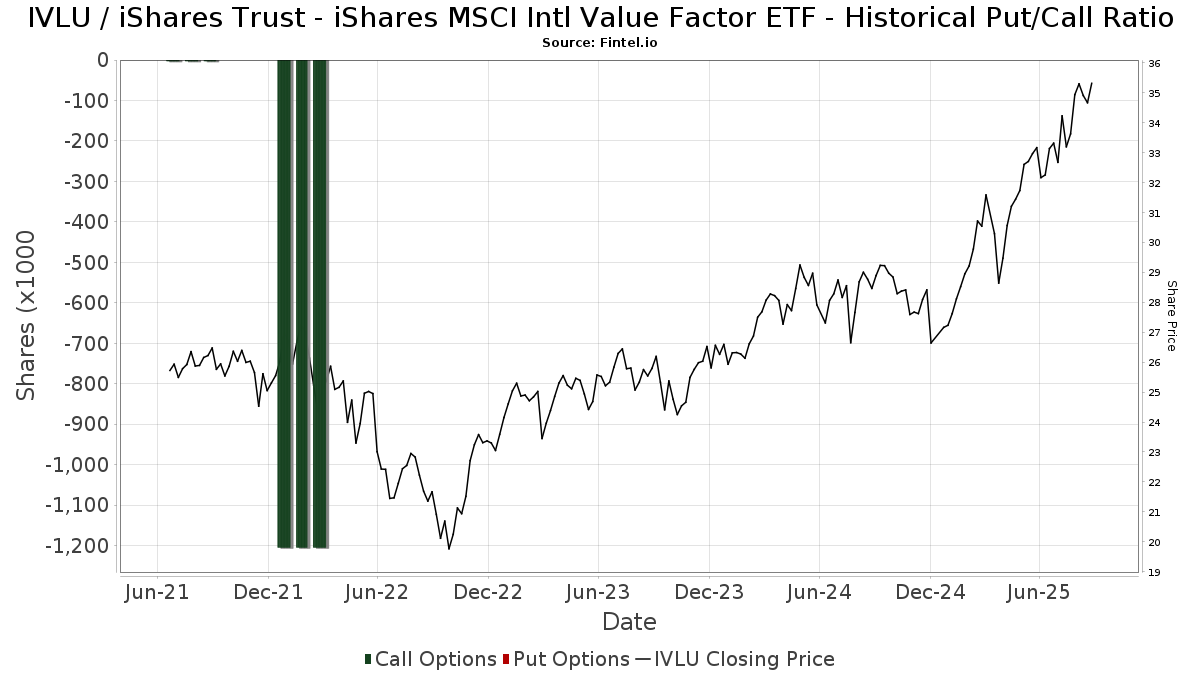
Förutom att rapportera vanliga eget kapital- och skuldemissioner måste institutioner med mer än 100MM tillgångar under förvaltning också avslöja sina innehav av sälj- och köpoptioner. Eftersom säljoptioner i allmänhet indikerar ett negativt sentiment och köpoptioner indikerar ett positivt sentiment, kan vi få en uppfattning om det övergripande institutionella sentimentet genom att plotta förhållandet mellan säljoptioner och köpoptioner. Diagrammet till höger visar det historiska förhållandet mellan sälj- och köpoptioner för detta instrument.
Genom att använda sälj/köp-kvoten som en indikator på aktieägarnas sentiment undviker man en av de största bristerna med att använda det totala institutionella ägandet, nämligen att en betydande del av de förvaltade tillgångarna investeras passivt för att följa index. Passivt förvaltade fonder köper vanligtvis inte optioner, så indikatorn för sälj/köp-kvoten ger en bättre bild av stämningen i aktivt förvaltade fonder.
13D/G-Arkiveringar
Vi presenterar 13D/G-arkiveringar separat från 13F-arkiveringar på grund av att de behandlas olika av SEC. 13D/G-arkiveringar kan lämnas in av grupper av investerare (med en ledare), medan 13F-arkiveringar inte kan det. Detta leder till situationer där en investerare kan lämna in en 13D/G-ansökan med ett värde för de totala aktierna (vilket motsvarar alla aktier som ägs av investerargruppen), men sedan lämna in en 13F-ansökan med ett annat värde för de totala aktierna (vilket motsvarar enbart deras eget ägande). Detta innebär att aktieägandet i 13D/G-arkiveringar och 13F-arkiveringar ofta inte är direkt jämförbara, så vi presenterar dem separat.
Notera: Från och med den 16 maj 2021 visar vi inte längre ägare som inte har lämnat in en 13D/G under det senaste året. Tidigare visade vi hela historiken för 13D/G-arkiveringar. I allmänhet måste enheter som är skyldiga att lämna in 13D/G-arkiveringar lämna in minst en gång per år innan de lämnar in en stängningsarkivering. Fonder avslutar dock ibland positioner utan att lämna in en avslutande arkivering (dvs. de avvecklar), så att visa hela historiken resulterade ibland i förvirring om det nuvarande ägandet. För att förhindra förvirring visar vi nu endast "nuvarande" ägare - det vill säga ägare som har lämnat in en ansökan under det senaste året.
Upgrade to unlock premium data.
13F- och NPORT-arkiveringar
Detaljer om 13F-arkiveringar är gratis. Detaljer om NP-arkiveringar kräver ett premiummedlemskap. Gröna rader indikerar nya positioner. Röda rader indikerar stängda positioner. Klicka på länk symbolen för att se hela transaktionshistoriken.
Uppgradera
för att låsa upp premiumdata och exportera till Excel ![]() .
.
| Fil Datum | Källa | Investerare | Typ | Genomsnittligt pris (beräknat) |
Aktier | Δ Aktier (%) |
Rapporterat värde (1000 USD) |
Δ Värde (%) |
Portföljallokering (%) |
|
|---|---|---|---|---|---|---|---|---|---|---|
| 2025-08-13 | 13F | Custom Index Systems, Llc | 49 452 | 63,65 | 1 626 | 77,70 | ||||
| 2025-08-14 | 13F | Beaird Harris Wealth Management, LLC | 0 | −100,00 | 0 | |||||
| 2025-08-15 | 13F | High Falls Advisors, Inc | 29 045 | 4,78 | 955 | 13,69 | ||||
| 2025-07-09 | 13F | Breakwater Capital Group | 35 877 | 15,39 | 1 180 | 25,16 | ||||
| 2025-07-17 | 13F | PMG Wealth Management, Inc. | 85 601 | 2 815 | ||||||
| 2025-07-25 | 13F | Envestnet Portfolio Solutions, Inc. | 10 253 | 13,34 | 337 | 22,99 | ||||
| 2025-07-16 | 13F | Plancorp, LLC | 324 507 | −4,36 | 10 673 | 3,78 | ||||
| 2025-08-13 | 13F | Transce3nd, LLC | 62 | 0,00 | 2 | 100,00 | ||||
| 2025-07-14 | 13F | U.S. Capital Wealth Advisors, LLC | 95 225 | 11,31 | 3 132 | 20,75 | ||||
| 2025-08-14 | 13F | Mml Investors Services, Llc | 205 122 | 974,95 | 7 | |||||
| 2025-08-14 | 13F | Goldman Sachs Group Inc | 142 439 | −41,22 | 4 685 | −36,22 | ||||
| 2025-07-14 | 13F | Painted Porch Advisors LLC | 264 | 0,00 | 9 | 0,00 | ||||
| 2025-08-14 | 13F | GWM Advisors LLC | 153 148 | 43,68 | 5 037 | 55,94 | ||||
| 2025-08-12 | 13F | BlackRock, Inc. | 167 887 | −35,47 | 5 522 | −29,98 | ||||
| 2025-07-30 | 13F | Eqis Capital Management, Inc. | 364 176 | −55,90 | 11 978 | −52,14 | ||||
| 2025-08-14 | 13F | Ancora Advisors, LLC | 556 | 0,00 | 18 | 12,50 | ||||
| 2025-07-08 | 13F | Parallel Advisors, LLC | 160 957 | 12,35 | 5 294 | 21,90 | ||||
| 2025-08-13 | 13F | Per Stirling Capital Management, LLC. | 302 477 | 1,45 | 9 948 | 10,09 | ||||
| 2025-08-14 | 13F | Fmr Llc | 7 528 185 | −7,81 | 247 602 | 0,04 | ||||
| 2025-07-18 | 13F | Magnolia Private Wealth, LLC | 7 827 | 0,00 | 257 | 8,44 | ||||
| 2025-08-14 | 13F | Css Llc/il | 70 300 | 0,00 | 2 312 | 8,54 | ||||
| 2025-07-25 | 13F | Ackerman Capital Advisors, LLC | 413 433 | 0,60 | 13 598 | 9,16 | ||||
| 2025-08-14 | 13F | UBS Group AG | 117 546 | 8,02 | 3 866 | 17,22 | ||||
| 2025-07-16 | 13F | Ironwood Wealth Management, Inc. | 277 158 | −0,67 | 9 141 | 17,16 | ||||
| 2025-07-21 | 13F | Ascent Group, LLC | 30 424 | 50,94 | 1 001 | 63,93 | ||||
| 2025-08-14 | 13F | Mariner, LLC | 52 099 | 57,88 | 1 714 | 71,30 | ||||
| 2025-06-17 | 13F | Howe & Rusling Inc | 0 | −100,00 | 0 | |||||
| 2025-08-01 | 13F | Ashton Thomas Private Wealth, LLC | 289 990 | −1,12 | 9 538 | 7,30 | ||||
| 2025-07-17 | 13F | Halbert Hargrove Global Advisors, Llc | 0 | −100,00 | 0 | |||||
| 2025-08-13 | 13F | Cerity Partners LLC | 76 309 | −0,87 | 2 510 | 7,54 | ||||
| 2025-08-14 | 13F/A | Bank Julius Baer & Co. Ltd, Zurich | 49 428 | 13,02 | 1 626 | 8,48 | ||||
| 2025-07-23 | 13F | Elevate Wealth Advisory, Inc | 4 151 | 2,29 | 137 | 11,48 | ||||
| 2025-08-13 | 13F | SCS Capital Management LLC | 116 839 | 0,70 | 3 843 | 9,27 | ||||
| 2025-08-26 | NP | EVTTX - The E-Valuator Conservative/Moderate (30%-50%) RMS Fund Service Class Shares | 5 478 | 180 | ||||||
| 2025-08-07 | 13F | Addison Advisors LLC | 925 | 0,00 | 30 | 7,14 | ||||
| 2025-07-25 | 13F | Sequoia Financial Advisors, LLC | 51 975 | 0,38 | 1 709 | 8,92 | ||||
| 2025-04-14 | 13F | Pallas Capital Advisors LLC | 0 | −100,00 | 0 | |||||
| 2025-08-06 | 13F | Commonwealth Equity Services, Llc | 50 534 | 52,01 | 2 | 0,00 | ||||
| 2025-08-13 | 13F | Russell Investments Group, Ltd. | 599 | 31,36 | 20 | 46,15 | ||||
| 2025-08-15 | 13F | Kestra Advisory Services, LLC | 142 308 | −29,37 | 4 681 | −23,37 | ||||
| 2025-08-12 | 13F | Atlas Capital Advisors Llc | 290 051 | −2,54 | 9 540 | 5,75 | ||||
| 2025-07-31 | 13F | Glass Jacobson Investment Advisors llc | 5 152 | 2,20 | 169 | 24,26 | ||||
| 2025-08-07 | 13F | Allworth Financial LP | 52 064 | 0,28 | 1 712 | 6,93 | ||||
| 2025-08-26 | NP | EVMLX - The E-Valuator Moderate (50%-70%) RMS Fund Service Class Shares | 28 955 | 952 | ||||||
| 2025-08-15 | 13F | Semmax Financial Advisors Inc. | 78 | 0,00 | 3 | 0,00 | ||||
| 2025-08-07 | 13F | Vise Technologies, Inc. | 54 008 | 1 776 | ||||||
| 2025-08-07 | 13F | Shared Vision Wealth Group LLC | 26 536 | −0,81 | 874 | 7,90 | ||||
| 2025-08-14 | 13F | Two Sigma Securities, Llc | 0 | −100,00 | 0 | |||||
| 2025-04-30 | 13F | Stratos Wealth Advisors, LLC | 0 | −100,00 | 0 | −100,00 | ||||
| 2025-05-13 | 13F | Thrivent Financial For Lutherans | 0 | −100,00 | 0 | |||||
| 2025-08-01 | 13F | Envestnet Asset Management Inc | 4 292 836 | −0,49 | 141 191 | 7,98 | ||||
| 2025-08-14 | 13F | Aqr Capital Management Llc | 17 355 | 11,25 | 571 | 20,76 | ||||
| 2025-08-11 | 13F | Morling Financial Advisors, LLC | 397 | 0,00 | 13 | 8,33 | ||||
| 2025-08-13 | 13F | Elgethun Capital Management | 6 129 | −2,34 | 202 | 5,79 | ||||
| 2025-07-09 | 13F | Fiduciary Alliance LLC | 7 128 | 0,35 | 234 | 8,84 | ||||
| 2025-05-13 | 13F | United Capital Financial Advisers, Llc | 0 | −100,00 | 0 | |||||
| 2025-08-14 | 13F | Wells Fargo & Company/mn | 1 419 | −62,37 | 47 | −59,65 | ||||
| 2025-07-28 | 13F | RCS Financial Planning, LLC | 9 708 | 19,45 | 319 | 29,67 | ||||
| 2025-07-24 | 13F | MA Private Wealth | 30 890 | 0,00 | 1 016 | 8,44 | ||||
| 2025-08-12 | 13F | Steward Partners Investment Advisory, Llc | 894 | 0,00 | 29 | 7,41 | ||||
| 2025-08-14 | 13F | Jane Street Group, Llc | 73 317 | 20,97 | 2 411 | 31,32 | ||||
| 2025-08-06 | 13F | Valued Wealth Advisors LLC | 69 182 | 17,14 | 2 275 | 27,09 | ||||
| 2025-08-26 | NP | EVAGX - The E-Valuator Aggressive Growth (85%-99%) RMS Fund Service Class Shares | 86 872 | 2 857 | ||||||
| 2025-08-13 | 13F | EverSource Wealth Advisors, LLC | 10 321 | 7,02 | 339 | 16,10 | ||||
| 2025-07-17 | 13F | One Wealth Advisors, LLC | 310 429 | 3,26 | 10 210 | 12,05 | ||||
| 2025-07-31 | 13F | CNB Bank | 590 | 0,00 | 19 | 11,76 | ||||
| 2025-07-22 | 13F | Merit Financial Group, LLC | 8 936 | −18,82 | 294 | −12,01 | ||||
| 2025-07-31 | 13F | Buckingham Strategic Partners | 284 373 | −6,13 | 9 353 | 1,86 | ||||
| 2025-07-15 | 13F | Mather Group, Llc. | 0 | −100,00 | 0 | |||||
| 2025-07-16 | 13F | West Branch Capital LLC | 350 | 0,00 | 12 | 10,00 | ||||
| 2025-07-07 | 13F | Versant Capital Management, Inc | 1 946 | −10,53 | 64 | −1,54 | ||||
| 2025-07-23 | 13F | Valmark Advisers, Inc. | 7 118 | −19,36 | 234 | −12,36 | ||||
| 2025-07-09 | 13F | Affinity Capital Advisors, LLC | 30 906 | −1,07 | 1 016 | 13,01 | ||||
| 2025-04-30 | 13F | Pineridge Advisors LLC | 0 | −100,00 | 0 | |||||
| 2025-07-02 | 13F | Dentgroup LLC | 14 065 | 7,43 | 463 | 16,67 | ||||
| 2025-08-08 | 13F | Compass Wealth Management LLC | 0 | −100,00 | 0 | |||||
| 2025-08-06 | 13F | Hoxton Planning & Management, LLC | 24 201 | 46,39 | 796 | 58,68 | ||||
| 2025-07-22 | 13F | Firethorn Wealth Partners, Llc | 27 291 | 4,76 | 898 | 13,69 | ||||
| 2025-08-11 | 13F | Wealthgarden F.s. Llc | 21 830 | −0,35 | 719 | 8,45 | ||||
| 2025-07-30 | 13F | Cullen/frost Bankers, Inc. | 237 | 2,16 | 8 | 0,00 | ||||
| 2025-08-04 | 13F | Mayflower Financial Advisors, LLC | 62 342 | 33,37 | 2 050 | 44,77 | ||||
| 2025-08-06 | 13F | Prospera Financial Services Inc | 7 679 | 253 | ||||||
| 2025-04-29 | 13F | Lee Danner & Bass Inc | 0 | −100,00 | 0 | |||||
| 2025-07-31 | 13F | Red Wave Investments LLC | 60 155 | −0,38 | 1 978 | 8,09 | ||||
| 2025-08-13 | 13F | Flow Traders U.s. Llc | 82 883 | 3 | ||||||
| 2025-07-17 | 13F | KWB Wealth | 462 200 | −22,02 | 14 009 | −12,81 | ||||
| 2025-08-07 | 13F | Nwam Llc | 17 050 | 14,54 | 566 | 25,28 | ||||
| 2025-08-08 | 13F | Cornerstone Advisors Asset Management, Inc | 35 433 | 0,00 | 1 165 | 8,57 | ||||
| 2025-08-14 | 13F | Royal Bank Of Canada | 49 252 | −67,26 | 1 620 | −64,47 | ||||
| 2025-07-14 | 13F | Capstone Wealth Management, LLC | 12 811 | 1,53 | 421 | 10,21 | ||||
| 2025-07-31 | 13F | Cambridge Investment Research Advisors, Inc. | 28 323 | 105,11 | 1 | |||||
| 2025-07-21 | 13F | Empirical Financial Services, LLC d.b.a. Empirical Wealth Management | 24 425 | −1,60 | 803 | 6,78 | ||||
| 2025-07-22 | 13F | Kickstand Ventures, Llc. | 96 305 | 5,66 | 3 167 | 14,66 | ||||
| 2025-08-14 | 13F | Becker Capital Management Inc | 8 255 | 272 | ||||||
| 2025-07-22 | 13F | Duncan Williams Asset Management, LLC | 96 305 | 3 167 | ||||||
| 2025-08-07 | 13F | Weil Company, Inc. | 0 | −100,00 | 0 | |||||
| 2025-07-25 | 13F | Cwm, Llc | 14 649 | 4,98 | 0 | |||||
| 2025-07-30 | 13F | Cookson Peirce & Co Inc | 7 793 | 256 | ||||||
| 2025-08-11 | 13F | Theory Financial Llc | 8 377 | 2,48 | 276 | 11,34 | ||||
| 2025-08-13 | 13F | Vance Wealth, Inc. | 88 682 | 9,14 | 2 917 | 18,44 | ||||
| 2025-07-14 | 13F | Abound Wealth Management | 35 | 0,00 | 1 | 0,00 | ||||
| 2025-07-15 | 13F | Well Done, LLC | 10 341 | 0,00 | 340 | 21,43 | ||||
| 2025-07-07 | 13F | Accelerate Investment Advisors LLC | 8 567 | 282 | ||||||
| 2025-07-09 | 13F | Baron Wealth Management LLC | 8 052 | 265 | ||||||
| 2025-07-15 | 13F | Financial Management Professionals, Inc. | 262 | 0,00 | 9 | 14,29 | ||||
| 2025-08-14 | 13F | Gerber Kawasaki Wealth & Investment Management | 0 | −100,00 | 0 | |||||
| 2025-07-31 | 13F | Wealthfront Advisers Llc | 15 545 | 110,04 | 511 | 128,13 | ||||
| 2025-08-01 | 13F | First Command Advisory Services, Inc. | 259 | 0,00 | 9 | 14,29 | ||||
| 2025-08-05 | 13F | Bank Of Montreal /can/ | 549 | 0,00 | 18 | 12,50 | ||||
| 2025-08-05 | 13F | Simplex Trading, Llc | 99 | 0 | ||||||
| 2025-08-12 | 13F | Choate Investment Advisors | 8 552 | 281 | ||||||
| 2025-07-28 | 13F | Cypress Wealth Services, LLC | 103 317 | 5,34 | 3 398 | 14,33 | ||||
| 2025-08-04 | 13F | Spire Wealth Management | 7 060 | 0,73 | 232 | 9,43 | ||||
| 2025-08-14 | 13F | Keebeck Wealth Management, LLC | 162 903 | 0,17 | 5 358 | 8,68 | ||||
| 2025-07-22 | 13F | Valeo Financial Advisors, LLC | 10 322 | −10,41 | 339 | −2,87 | ||||
| 2025-08-14 | 13F | Clayton Partners LLC | 81 474 | −9,70 | 2 680 | −2,01 | ||||
| 2025-07-21 | 13F | Ameritas Advisory Services, LLC | 1 788 | 59 | ||||||
| 2025-08-11 | 13F | Bell Investment Advisors, Inc | 63 634 | 25,07 | 2 093 | 35,67 | ||||
| 2025-08-14 | 13F/A | Rockefeller Capital Management L.P. | 165 699 | 31,16 | 5 450 | 42,31 | ||||
| 2025-05-02 | 13F | MB Generational Wealth, LLC | 14 338 | 71,18 | 435 | 91,19 | ||||
| 2025-08-08 | 13F | Smithfield Trust Co | 3 546 | 0,00 | 0 | |||||
| 2025-08-05 | 13F | Fullcircle Wealth Llc | 12 050 | 401 | ||||||
| 2025-08-13 | 13F | Kilter Group LLC | 1 | 0 | ||||||
| 2025-04-22 | 13F | Duncker Streett & Co Inc | 0 | −100,00 | 0 | |||||
| 2025-07-03 | 13F | Collective Family Office Llc | 12 078 | 0,00 | 397 | 8,47 | ||||
| 2025-08-11 | 13F | Angeles Investment Advisors, LLC | 77 680 | 0,00 | 2 555 | 8,50 | ||||
| 2025-08-14 | 13F | Ameriprise Financial Inc | 245 405 | 33,08 | 8 068 | 44,34 | ||||
| 2025-07-25 | 13F | Stonehage Fleming Financial Services Holdings Ltd | 86 144 | 0,00 | 2 833 | 8,50 | ||||
| 2025-08-12 | 13F | Change Path, LLC | 13 619 | 4,75 | 448 | 13,45 | ||||
| 2025-07-07 | 13F | Kings Path Partners LLC | 23 | 1 | ||||||
| 2025-08-11 | 13F | TRUE Private Wealth Advisors | 0 | −100,00 | 0 | |||||
| 2025-05-09 | 13F | Emerald Investment Partners, Llc | 0 | −100,00 | 0 | |||||
| 2025-07-17 | 13F | Beacon Capital Management, LLC | 239 | 0,00 | 8 | 0,00 | ||||
| 2025-08-14 | 13F | Bnp Paribas Arbitrage, Sa | 0 | −100,00 | 0 | |||||
| 2025-07-18 | 13F | SOA Wealth Advisors, LLC. | 4 883 | 161 | ||||||
| 2025-08-14 | 13F | McIlrath & Eck, LLC | 637 | 2,25 | 21 | 11,11 | ||||
| 2025-07-08 | 13F | Braun-Bostich & Associates Inc. | 23 852 | 0,56 | 784 | 9,19 | ||||
| 2025-08-06 | 13F | Nicholas Hoffman & Company, LLC. | 20 913 | 0,00 | 688 | 8,53 | ||||
| 2025-08-14 | 13F | Wiley Bros.-aintree Capital, Llc | 98 503 | 22,30 | 3 240 | 31,61 | ||||
| 2025-08-26 | NP | EVGLX - The E-Valuator Growth (70%-85%) RMS Fund Service Class Shares | 79 741 | 2 623 | ||||||
| 2025-07-21 | 13F | Ameriflex Group, Inc. | 26 385 | −7,14 | 860 | −0,23 | ||||
| 2025-05-15 | 13F | Lgl Partners, Llc | 0 | −100,00 | 0 | |||||
| 2025-07-25 | 13F | Hemington Wealth Management | 46 045 | 0,12 | 2 | 0,00 | ||||
| 2025-08-05 | 13F | Dunhill Financial, LLC | 25 | 0,00 | 1 | |||||
| 2025-07-31 | 13F | TSA Wealth Managment LLC | 84 464 | 23,00 | 2 778 | 33,49 | ||||
| 2025-08-05 | 13F | 5T Wealth, LLC | 8 948 | 6,28 | 294 | 15,29 | ||||
| 2025-08-12 | 13F | Pathstone Holdings, LLC | 33 565 | 63,18 | 1 104 | 73,16 | ||||
| 2025-08-19 | 13F | Advisory Services Network, LLC | 30 143 | −0,23 | 993 | 8,42 | ||||
| 2025-09-04 | 13F/A | Advisor Group Holdings, Inc. | 349 012 | 191,62 | 11 476 | 216,40 | ||||
| 2025-07-24 | 13F | Trust Co Of Toledo Na /oh/ | 223 | 7 | ||||||
| 2025-07-24 | 13F | Us Bancorp \de\ | 18 744 | 27,29 | 616 | 38,12 | ||||
| 2025-05-08 | 13F | Glassman Wealth Services | 0 | −100,00 | 0 | |||||
| 2025-07-28 | 13F | Rosenberg Matthew Hamilton | 9 160 | −0,69 | 301 | 7,89 | ||||
| 2025-05-12 | 13F | Kohmann Bosshard Financial Services, LLC | 0 | −100,00 | 0 | |||||
| 2025-08-13 | 13F | GeoWealth Management, LLC | 0 | −100,00 | 0 | |||||
| 2025-08-15 | 13F | Captrust Financial Advisors | 36 850 | −0,56 | 1 212 | 7,84 | ||||
| 2025-07-08 | 13F | Peirce Capital Management, LLC | 18 124 | 16,21 | 596 | 26,27 | ||||
| 2025-07-29 | 13F | ShoreHaven Wealth Partners, LLC | 134 637 | 0,30 | 4 428 | 8,85 | ||||
| 2025-08-06 | 13F | Stokes Family Office, LLC | 40 628 | −3,68 | 1 336 | 4,54 | ||||
| 2025-08-14 | 13F | Sunbelt Securities, Inc. | 1 315 | 36 | ||||||
| 2025-07-17 | 13F | Lauterbach Financial Advisors, LLC | 15 823 | 2,24 | 520 | 10,87 | ||||
| 2025-08-12 | 13F | J.w. Cole Advisors, Inc. | 18 751 | 617 | ||||||
| 2025-08-13 | 13F | VestGen Advisors, LLC | 20 441 | 2,16 | 672 | 10,89 | ||||
| 2025-07-11 | 13F | My Legacy Advisors, LLC | 24 065 | −1,86 | 801 | 7,67 | ||||
| 2025-07-22 | 13F | Unique Wealth, Llc | 21 638 | 73,63 | 712 | 88,59 | ||||
| 2025-05-05 | 13F | Hazlett, Burt & Watson, Inc. | 0 | −100,00 | 0 | |||||
| 2025-08-12 | 13F | O'shaughnessy Asset Management, Llc | 14 746 | −1,03 | 485 | 7,32 | ||||
| 2025-06-27 | NP | SUNAMERICA SERIES TRUST - SA BlackRock Multi-Factor 70/30 Portfolio Class 1 | 47 067 | 2,00 | 1 468 | 13,01 | ||||
| 2025-07-29 | 13F | Systelligence, LLC | 207 542 | 6 826 | ||||||
| 2025-05-15 | 13F | Chilton Investment Co Llc | 0 | −100,00 | 0 | −100,00 | ||||
| 2025-08-13 | 13F | Northern Trust Corp | 19 687 | 1,00 | 648 | 9,66 | ||||
| 2025-07-28 | 13F | WealthPlan Investment Management, LLC | 64 335 | 2 116 | ||||||
| 2025-07-14 | 13F | Foster Group, Inc. | 402 642 | −0,50 | 13 243 | 7,97 | ||||
| 2025-07-16 | 13F | Squire Investment Management Company, LLC | 36 526 | −32,50 | 1 201 | −26,77 | ||||
| 2025-08-14 | 13F | CoreFirst Bank & Trust | 184 435 | 1,23 | 6 066 | 9,85 | ||||
| 2025-04-10 | 13F | Watershed Private Wealth Llc | 0 | −100,00 | 0 | |||||
| 2025-08-13 | 13F | Balance Wealth, LLC | 72 393 | 1,09 | 2 381 | 9,72 | ||||
| 2025-08-11 | 13F | Invenio Wealth Partners Llc | 16 801 | 553 | ||||||
| 2025-08-14 | 13F | Stifel Financial Corp | 263 649 | 148,23 | 8 671 | 169,37 | ||||
| 2025-05-14 | 13F | Huntington National Bank | 6 | −68,75 | ||||||
| 2025-07-29 | 13F | Horst & Graben Wealth Management LLC | 42 557 | −13,39 | 1 400 | −6,04 | ||||
| 2025-08-06 | 13F | SOUTH STATE Corp | 924 | 0,00 | 30 | 7,14 | ||||
| 2025-07-11 | 13F | Prosperity Planning, Inc. | 146 455 | −3,36 | 4 817 | 4,86 | ||||
| 2025-07-14 | 13F | Park Avenue Securities Llc | 304 441 | 10 | ||||||
| 2025-08-06 | 13F | AE Wealth Management LLC | 1 728 | −21,35 | 57 | −15,15 | ||||
| 2025-08-07 | 13F | Tacita Capital Inc | 84 810 | 1,22 | 2 789 | 9,85 | ||||
| 2025-08-12 | 13F | MAI Capital Management | 109 | 34,57 | 4 | 50,00 | ||||
| 2025-08-14 | 13F | Comerica Bank | 15 498 | 0,00 | 510 | 8,53 | ||||
| 2025-07-25 | 13F | ONE Advisory Partners, LLC | 72 192 | 0,00 | 2 470 | 12,89 | ||||
| 2025-07-10 | 13F | Trust Point Inc. | 338 038 | 26,99 | 11 118 | 37,80 | ||||
| 2025-07-24 | 13F | Cyndeo Wealth Partners, LLC | 7 999 | 3,28 | 263 | 12,39 | ||||
| 2025-07-28 | 13F | Sagespring Wealth Partners, Llc | 125 195 | 23,98 | 4 118 | 34,54 | ||||
| 2025-08-06 | 13F | Quadrant Private Wealth Management, LLC | 7 174 | 236 | ||||||
| 2025-07-16 | 13F | Kathmere Capital Management, LLC | 808 775 | 0,34 | 26 601 | 8,88 | ||||
| 2025-07-22 | 13F | Sutton Place Investors Llc | 7 423 | 5,02 | 244 | 14,02 | ||||
| 2025-08-12 | 13F | Proequities, Inc. | 0 | 0 | ||||||
| 2025-08-14 | 13F | TCG Advisory Services, LLC | 692 273 | 64,53 | 22 769 | 78,54 | ||||
| 2025-07-17 | 13F | City Holding Co | 179 | 0,00 | 6 | 0,00 | ||||
| 2025-07-25 | 13F | Concurrent Investment Advisors, LLC | 283 153 | −7,08 | 9 313 | 0,82 | ||||
| 2025-08-11 | 13F | Stonebrook Private Inc. | 24 966 | 0,40 | 821 | 9,03 | ||||
| 2025-08-07 | 13F | Kestra Private Wealth Services, Llc | 18 538 | 141,32 | 610 | 162,50 | ||||
| 2025-08-14 | 13F | Smartleaf Asset Management LLC | 23 269 | 55,89 | 766 | 67,76 | ||||
| 2025-08-11 | 13F | HighTower Advisors, LLC | 113 674 | 31,19 | 3 739 | 42,35 | ||||
| 2025-08-13 | 13F | Townsquare Capital Llc | 0 | −100,00 | 0 | |||||
| 2025-07-24 | 13F | Robertson Stephens Wealth Management, LLC | 54 100 | 9,52 | 1 779 | 18,84 | ||||
| 2025-07-09 | 13F | High Probability Advisors, LLC | 364 723 | −10,20 | 11 996 | −2,57 | ||||
| 2025-08-12 | 13F | New Republic Capital, LLC | 3 667 | 0,00 | 121 | 8,11 | ||||
| 2025-05-12 | 13F | National Bank Of Canada /fi/ | 0 | −100,00 | 0 | −100,00 | ||||
| 2025-07-14 | 13F | Kfg Wealth Management, Llc | 0 | −100,00 | 0 | |||||
| 2025-07-18 | 13F | Warren Street Wealth Advisors, LLC | 21 174 | −0,34 | 696 | 8,24 | ||||
| 2025-08-12 | 13F | Lionshead Wealth Management, LLC | 0 | −100,00 | 0 | |||||
| 2025-07-24 | 13F | JNBA Financial Advisors | 244 293 | −10,18 | 8 035 | −2,54 | ||||
| 2025-07-30 | 13F | Drive Wealth Management, Llc | 17 350 | −3,02 | 571 | 5,17 | ||||
| 2025-08-06 | 13F | Csenge Advisory Group | 25 763 | −0,15 | 848 | 10,43 | ||||
| 2025-07-24 | 13F | Ronald Blue Trust, Inc. | 0 | −100,00 | 0 | |||||
| 2025-07-31 | 13F | Brighton Jones Llc | 24 322 | 19,71 | 800 | 29,92 | ||||
| 2025-05-06 | 13F | Venturi Wealth Management, LLC | 0 | −100,00 | 0 | |||||
| 2025-07-25 | 13F | PrairieView Partners, LLC | 2 471 | 0,00 | 0 | |||||
| 2025-08-15 | 13F | Morgan Stanley | 778 423 | 37,22 | 25 602 | 48,91 | ||||
| 2025-07-11 | 13F | Ridgeline Wealth, LLC | 10 160 | −43,56 | 334 | −38,72 | ||||
| 2025-07-17 | 13F | Saxon Interests, Inc. | 93 246 | 0,00 | 2 826 | 0,00 | ||||
| 2025-03-12 | 13F/A | Private Capital Management Llc | 924 | 0,00 | 25 | −3,85 | ||||
| 2025-07-28 | 13F | Harbour Investments, Inc. | 103 | 3 | ||||||
| 2025-08-07 | 13F | Meridian Financial Partners LLC | 61 207 | 2 | ||||||
| 2025-08-01 | 13F | Transcend Wealth Collective, Llc | 24 656 | 10,54 | 811 | 19,82 | ||||
| 2025-05-02 | 13F | Leo Wealth, LLC | 0 | −100,00 | 0 | |||||
| 2025-08-11 | 13F | Aptus Capital Advisors, LLC | 193 994 | 1,44 | 6 380 | 10,08 | ||||
| 2025-08-14 | 13F | Qube Research & Technologies Ltd | 0 | −100,00 | 0 | |||||
| 2025-08-26 | NP | EVVLX - The E-Valuator Very Conservative (0%-15%) RMS Fund Service Class Shares | 1 131 | 37 | ||||||
| 2025-04-28 | 13F | First Horizon Advisors, Inc. | 0 | −100,00 | 0 | −100,00 | ||||
| 2025-08-14 | 13F | Citadel Advisors Llc | 185 789 | 2 452,05 | 6 111 | 2 677,27 | ||||
| 2025-08-13 | 13F | Northwestern Mutual Wealth Management Co | 15 319 386 | −0,72 | 503 855 | 7,73 | ||||
| 2025-08-08 | 13F | Wealth Alliance | 98 409 | 59,69 | 3 237 | 73,33 | ||||
| 2025-08-11 | 13F | Farrow Financial Inc. | 282 640 | −0,18 | 9 296 | 8,33 | ||||
| 2025-07-30 | 13F | Jackson Thornton Asset Management, Llc | 20 632 | 0,00 | 680 | 10,75 | ||||
| 2025-08-12 | 13F | CIBC Private Wealth Group, LLC | 2 092 | 209 100,00 | 69 | |||||
| 2025-08-13 | 13F | Jackson Creek Investment Advisors LLC | 38 130 | −6,89 | 1 | 0,00 | ||||
| 2025-07-17 | 13F | Kelly Financial Services LLC | 23 825 | 7,11 | 784 | 16,17 | ||||
| 2025-07-25 | 13F | Keener Financial Planning LLC | 491 | 0 | ||||||
| 2025-08-04 | 13F | Pensionmark Financial Group, Llc | 67 459 | 106,90 | 2 219 | 124,49 | ||||
| 2025-08-01 | 13F | JDH Wealth Management, LLC | 48 834 | 3,14 | 1 606 | 11,92 | ||||
| 2025-07-21 | 13F | Patriot Financial Group Insurance Agency, LLC | 13 868 | 19,25 | 456 | 29,55 | ||||
| 2025-08-14 | 13F | Raymond James Financial Inc | 229 515 | 6,15 | 7 549 | 15,18 | ||||
| 2025-08-11 | 13F | Rothschild Investment Llc | 780 | 0,00 | 26 | 8,70 | ||||
| 2025-08-14 | 13F | Colony Group, LLC | 1 016 508 | −6,88 | 33 433 | 1,05 | ||||
| 2025-07-11 | 13F | Farther Finance Advisors, LLC | 23 376 | −25,96 | 769 | −19,67 | ||||
| 2025-07-23 | 13F | Lansing Street Advisors | 7 247 | −0,89 | 238 | 7,69 | ||||
| 2025-04-21 | 13F | Compass Capital Corp /ma/ /adv | 0 | −100,00 | 0 | |||||
| 2025-08-08 | 13F | JBF Capital, Inc. | 60 000 | 1 973 | ||||||
| 2025-07-30 | 13F | Strategic Blueprint, LLC | 63 565 | 2,15 | 2 091 | 10,82 | ||||
| 2025-08-06 | 13F | Savant Capital, LLC | 14 536 | 2,50 | 478 | 11,42 | ||||
| 2025-07-10 | 13F | Ryan Investment Management, Inc. | 128 | 4 | ||||||
| 2025-07-29 | 13F | Commons Capital, Llc | 74 786 | 2 460 | ||||||
| 2025-08-04 | 13F | Savvy Advisors, Inc. | 672 133 | 29,15 | 22 106 | 40,14 | ||||
| 2025-08-14 | 13F | IHT Wealth Management, LLC | 154 961 | 5 097 | ||||||
| 2025-07-10 | 13F | Kozak & Associates, Inc. | 45 | 2,27 | 1 | 0,00 | ||||
| 2025-07-25 | 13F | Index Fund Advisors, Inc. | 23 653 | 2,17 | 778 | 10,84 | ||||
| 2025-08-15 | 13F | CI Private Wealth, LLC | 23 497 | 1,08 | 773 | 9,66 | ||||
| 2025-08-14 | 13F | Integrated Wealth Concepts LLC | 414 010 | −2,88 | 13 617 | 5,39 | ||||
| 2025-07-24 | 13F | Financial Connections Group, Inc. | 84 | 0 | ||||||
| 2025-08-08 | 13F | Cetera Investment Advisers | 138 344 | 0,84 | 4 550 | 9,43 | ||||
| 2025-08-12 | 13F | LPL Financial LLC | 591 834 | 9,61 | 19 465 | 18,94 | ||||
| 2025-08-14 | 13F | Warren Averett Asset Management, LLC | 21 467 | −12,04 | 706 | −4,47 | ||||
| 2025-05-02 | 13F | Concord Wealth Partners | 0 | −100,00 | 0 | |||||
| 2025-07-24 | 13F | IFP Advisors, Inc | 171 388 | −10,03 | 5 637 | −2,37 | ||||
| 2025-08-14 | 13F | Quantinno Capital Management LP | 21 245 | 699 | ||||||
| 2025-08-04 | 13F | Capital Performance Advisors Llp | 14 228 | −0,41 | 468 | 7,85 | ||||
| 2025-07-21 | 13F | Crews Bank & Trust | 750 | 0,00 | 25 | 9,09 | ||||
| 2025-08-11 | 13F | Principal Securities, Inc. | 3 140 | 57,00 | 103 | 90,74 | ||||
| 2025-07-23 | 13F | Wise Wealth Partners | 21 233 | 0,04 | 698 | 8,55 | ||||
| 2025-08-07 | 13F | BOK Financial Private Wealth, Inc. | 26 | 1 | ||||||
| 2025-08-14 | 13F | EP Wealth Advisors, Inc. | 606 588 | 9 998,02 | 19 951 | 10 861,54 | ||||
| 2025-07-10 | 13F | Wealth Enhancement Advisory Services, Llc | 663 855 | −3,43 | 22 027 | 5,71 | ||||
| 2025-07-25 | 13F | We Are One Seven, LLC | 10 061 | 44,24 | 331 | 56,40 | ||||
| 2025-07-30 | 13F | LGT Financial Advisors LLC | 798 | 5,70 | 26 | 18,18 | ||||
| 2025-08-15 | 13F | TLT Family Holdco ULC | 408 500 | 13 436 | ||||||
| 2025-08-15 | 13F | Fft Wealth Management Llc | 0 | −100,00 | 0 | |||||
| 2025-04-15 | 13F | Noble Wealth Management PBC | 832 | −5,78 | 25 | 8,70 | ||||
| 2025-07-23 | 13F | Heck Capital Advisors, LLC | 352 895 | 2 961,73 | 11 607 | 3 225,50 | ||||
| 2025-07-22 | 13F | Simplicity Wealth,LLC | 19 498 | 1,68 | 641 | 10,33 | ||||
| 2025-08-13 | 13F | Cresset Asset Management, LLC | 23 017 | 0,00 | 757 | 8,61 | ||||
| 2025-07-17 | 13F | Johnson Bixby & Associates, LLC | 26 940 | 0,17 | 886 | 8,71 | ||||
| 2025-04-17 | 13F | Janney Montgomery Scott LLC | 0 | −100,00 | 0 | |||||
| 2025-05-15 | 13F | Hrt Financial Lp | 0 | −100,00 | 0 | |||||
| 2025-08-08 | 13F | Gts Securities Llc | 6 513 | 214 | ||||||
| 2025-04-14 | 13F | Bruce G. Allen Investments, LLC | 0 | −100,00 | 0 | |||||
| 2025-08-11 | 13F | Citigroup Inc | 3 978 | 0,00 | 131 | 8,33 | ||||
| 2025-07-25 | 13F | RHS Financial, LLC | 177 249 | 1,90 | 5 830 | 10,57 | ||||
| 2025-08-08 | 13F | Pnc Financial Services Group, Inc. | 1 453 | −10,36 | 48 | −4,08 | ||||
| 2025-08-19 | 13F | National Asset Management, Inc. | 0 | −100,00 | 0 | |||||
| 2025-08-08 | 13F | TD Capital Management LLC | 1 057 | 35 | ||||||
| 2025-05-16 | 13F | Coppell Advisory Solutions LLC | 0 | −100,00 | 0 | |||||
| 2025-07-25 | 13F | Ruedi Wealth Management, Inc. | 0 | −100,00 | 0 | |||||
| 2025-08-11 | 13F | Greykasell Wealth Strategies, Inc. | 70 | −57,58 | 2 | −60,00 | ||||
| 2025-08-08 | 13F | Avantax Advisory Services, Inc. | 27 669 | −0,28 | 910 | 8,20 | ||||
| 2025-08-11 | 13F | CFS Investment Advisory Services, LLC | 15 151 | 8,01 | 0 | |||||
| 2025-08-18 | 13F | Hollencrest Capital Management | 1 391 | 46 | ||||||
| 2025-07-25 | 13F | Commonwealth Financial Services, LLC | 0 | −100,00 | 0 | |||||
| 2025-07-16 | 13F | Vision Capital Management, Inc. | 24 364 | 5,14 | 801 | 14,10 | ||||
| 2025-08-07 | 13F | Resources Investment Advisors, LLC. | 357 544 | −20,37 | 11 760 | −13,59 | ||||
| 2025-08-14 | 13F | Aprio Wealth Management, LLC | 17 046 | −1,04 | 561 | 7,28 | ||||
| 2025-08-26 | NP | EVCLX - The E-Valuator Conservative (15%-30%) RMS Fund Service Class Shares | 5 365 | 176 | ||||||
| 2025-07-11 | 13F | Kaufman Rossin Wealth, LLC | 12 813 | 0,00 | 421 | 8,51 | ||||
| 2025-08-07 | 13F | 1620 Investment Advisors, Inc. | 649 | 0,00 | 21 | 10,53 | ||||
| 2025-07-16 | 13F | Signaturefd, Llc | 734 | −10,92 | 24 | 0,00 | ||||
| 2025-08-12 | 13F | AlphaCore Capital LLC | 5 115 | 0,00 | 168 | 8,39 | ||||
| 2025-04-29 | 13F | Chilton Capital Management Llc | 0 | −100,00 | 0 | |||||
| 2025-08-06 | 13F | Stone House Investment Management, LLC | 550 | 18 | ||||||
| 2025-08-14 | 13F | Moneta Group Investment Advisors Llc | 15 346 | 0,00 | 505 | 8,39 | ||||
| 2025-07-24 | 13F | Stonebridge Financial Group, LLC | 0 | −100,00 | 0 | |||||
| 2025-08-05 | 13F | Claro Advisors LLC | 8 206 | 270 | ||||||
| 2025-08-04 | 13F | Assetmark, Inc | 1 601 | 11,49 | 53 | 20,93 | ||||
| 2025-08-12 | 13F | Global Retirement Partners, LLC | 35 617 | 112,50 | 1 171 | 157,93 | ||||
| 2025-07-23 | 13F | Armbruster Capital Management, Inc. | 700 825 | 1,83 | 23 050 | 10,50 | ||||
| 2025-08-11 | 13F | Dorsey & Whitney Trust CO LLC | 8 500 | 0,00 | 280 | 8,56 | ||||
| 2025-07-22 | 13F | Capital Advisors Inc/ok | 23 975 | 0,00 | 789 | 8,54 | ||||
| 2025-08-07 | 13F | W Advisors, Llc | 39 480 | −0,45 | 1 298 | 7,99 | ||||
| 2025-08-12 | 13F | Wood Tarver Financial Group, LLC | 125 | 0,00 | 0 | −100,00 | ||||
| 2025-08-11 | 13F | Private Advisor Group, LLC | 98 410 | 416,45 | 3 237 | 460,83 | ||||
| 2025-07-18 | 13F | Clarity Financial LLC | 0 | −100,00 | 0 | |||||
| 2025-07-23 | 13F | Foresight Capital Management Advisors, Inc. | 0 | −100,00 | 0 | |||||
| 2025-08-05 | 13F | Verity Asset Management, Inc. | 19 388 | 638 | ||||||
| 2025-04-17 | 13F | Qrg Capital Management, Inc. | 0 | −100,00 | 0 | |||||
| 2025-07-15 | 13F | Garrett Investment Advisors LLC | 9 805 | −4,87 | 322 | 3,21 | ||||
| 2025-08-13 | 13F | Twin Peaks Wealth Advisors, LLC | 2 461 | 85 | ||||||
| 2025-05-02 | 13F | Transcendent Capital Group LLC | 0 | −100,00 | 0 | |||||
| 2025-08-08 | 13F | Creative Planning | 33 470 | −0,07 | 1 101 | 8,37 | ||||
| 2025-08-14 | 13F | Ariadne Wealth Management, LP | 10 910 | −0,91 | 381 | 9,48 | ||||
| 2025-08-14 | 13F | Mercer Global Advisors Inc /adv | 4 136 681 | −5,44 | 136 055 | 2,61 | ||||
| 2025-08-15 | 13F | Equitable Holdings, Inc. | 62 086 | 151,31 | 2 042 | 172,99 | ||||
| 2025-08-13 | 13F | Millstone Evans Group, LLC | 287 | 0,00 | 9 | 12,50 | ||||
| 2025-07-14 | 13F | AdvisorNet Financial, Inc | 2 571 | 1,78 | 85 | 10,53 | ||||
| 2025-07-30 | 13F | Avidian Wealth Solutions, LLC | 19 348 | 0,00 | 636 | 8,53 | ||||
| 2025-08-12 | 13F | Jpmorgan Chase & Co | 4 678 576 | 18,67 | 153 878 | 28,77 | ||||
| 2025-07-31 | 13F | LJI Wealth Management, LLC | 13 014 | 0,00 | 428 | 8,63 | ||||
| 2025-08-13 | 13F | Jones Financial Companies Lllp | 59 | 2 | ||||||
| 2025-07-18 | 13F | Truist Financial Corp | 100 112 | −1,09 | 3 293 | 7,34 | ||||
| 2025-08-08 | 13F | Capital Investment Advisory Services, LLC | 254 | −80,40 | 8 | −79,49 | ||||
| 2025-08-14 | 13F | Bank Of America Corp /de/ | 915 728 | 12,46 | 30 118 | 22,03 | ||||
| 2025-08-15 | 13F | Keel Point, LLC | 101 900 | 0,00 | 3 351 | 8,52 | ||||
| 2025-07-09 | 13F | Beacon Financial Group | 42 197 | 2,76 | 1 388 | 11,50 | ||||
| 2025-08-11 | 13F | Strategic Wealth Partners, Ltd. | 1 845 | 61 |