Grundläggande statistik
| Institutionella ägare | 195 total, 195 long only, 0 short only, 0 long/short - change of 3,70% MRQ |
| Genomsnittlig portföljallokering | 0.5261 % - change of 2,00% MRQ |
| Institutionella aktier (lång) | 39 520 830 (ex 13D/G) - change of 2,33MM shares 6,27% MRQ |
| Institutionellt värde (lång) | $ 849 439 USD ($1000) |
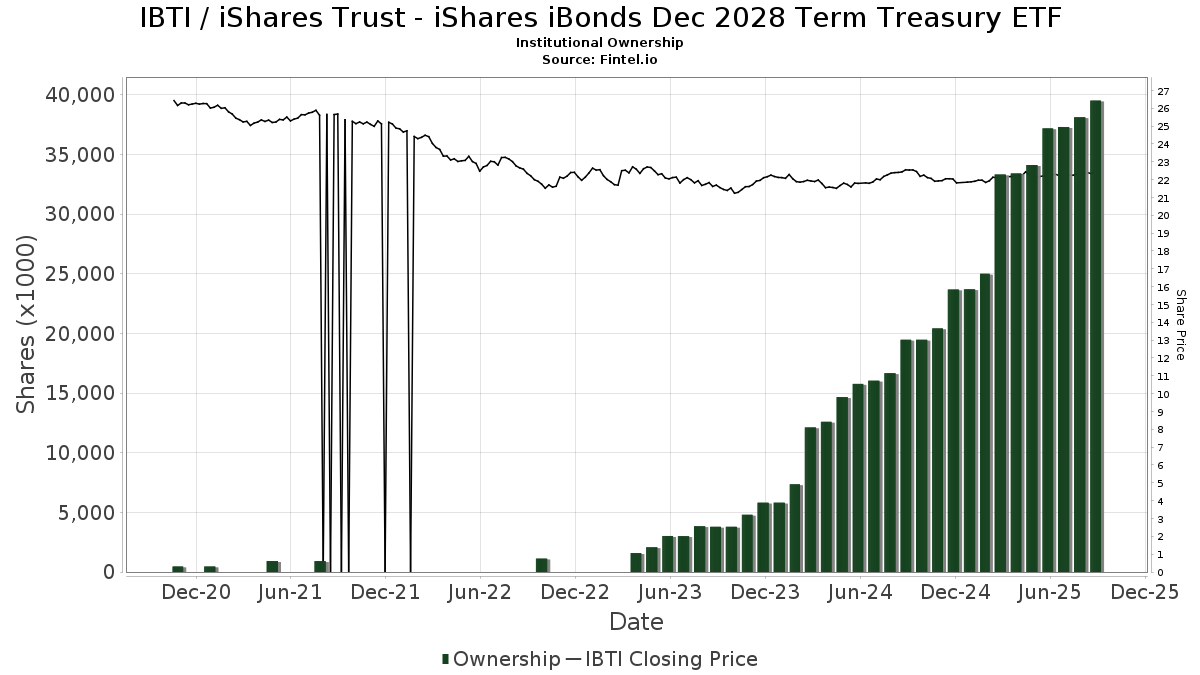
Institutionellt ägande och aktieägare
iShares Trust - iShares iBonds Dec 2028 Term Treasury ETF (US:IBTI) har 195 Institutionella ägare och aktieägare som har lämnat in 13D/G- eller 13F-formulär till Securities Exchange Commission (SEC). Dessa institut innehar totalt 39,520,830 aktier. Största aktieägare inkluderar Morgan Stanley, Colony Group, LLC, Wells Fargo & Company/mn, Bank Of America Corp /de/, Raymond James Financial Inc, GWM Advisors LLC, Envestnet Asset Management Inc, Stratos Wealth Partners, LTD., Atwood & Palmer Inc, and Horizon Advisory Services, Inc. .
iShares Trust - iShares iBonds Dec 2028 Term Treasury ETF (NasdaqGM:IBTI) Institutionell ägarstruktur visar institutioners och fonders nuvarande positioner i företaget, samt de senaste förändringarna i positionernas storlek. Större aktieägare kan vara enskilda investerare, fonder, hedgefonder eller institutioner. Bilaga 13D visar att investeraren äger (eller ägde) mer än 5% av företaget och avser (eller avsåg) att aktivt eftersträva en förändring av affärsstrategin. Schedule 13G indikerar en passiv investering på över 5%.
The share price as of September 12, 2025 is 22,40 / share. Previously, on September 16, 2024, the share price was 22,60 / share. This represents a decline of 0,91% over that period.
Fondsentimentets poäng
Fondsentimentet poängen(fka Ägarackumulation-poäng) visar vilka aktier som är mest köpta av fonder. Det är resultatet av en sofistikerad kvantitativ flerfaktormodell som identifierar företag med de högsta nivåerna av institutionell ackumulering. Poängsättningsmodellen använder en kombination av den totala ökningen av redovisade ägare, förändringarna i portföljallokeringarna för dessa ägare och andra mått. Siffran sträcker sig från 0 till 100, där högre siffror indikerar en högre nivå av ackumulering i förhållande till sina konkurrenter, och 50 är genomsnittet.
Uppdateringsfrekvens: Dagligen
Se Ownership Explorer, som innehåller en lista över de högst rankade företagen.
Institutionell sälj/köp-kvot
Förutom att rapportera vanliga eget kapital- och skuldemissioner måste institutioner med mer än 100MM tillgångar under förvaltning också avslöja sina innehav av sälj- och köpoptioner. Eftersom säljoptioner i allmänhet indikerar ett negativt sentiment och köpoptioner indikerar ett positivt sentiment, kan vi få en uppfattning om det övergripande institutionella sentimentet genom att plotta förhållandet mellan säljoptioner och köpoptioner. Diagrammet till höger visar det historiska förhållandet mellan sälj- och köpoptioner för detta instrument.
Genom att använda sälj/köp-kvoten som en indikator på aktieägarnas sentiment undviker man en av de största bristerna med att använda det totala institutionella ägandet, nämligen att en betydande del av de förvaltade tillgångarna investeras passivt för att följa index. Passivt förvaltade fonder köper vanligtvis inte optioner, så indikatorn för sälj/köp-kvoten ger en bättre bild av stämningen i aktivt förvaltade fonder.
13F- och NPORT-arkiveringar
Detaljer om 13F-arkiveringar är gratis. Detaljer om NP-arkiveringar kräver ett premiummedlemskap. Gröna rader indikerar nya positioner. Röda rader indikerar stängda positioner. Klicka på länk symbolen för att se hela transaktionshistoriken.
Uppgradera
för att låsa upp premiumdata och exportera till Excel ![]() .
.
| Fil Datum | Källa | Investerare | Typ | Genomsnittligt pris (beräknat) |
Aktier | Δ Aktier (%) |
Rapporterat värde (1000 USD) |
Δ Värde (%) |
Portföljallokering (%) |
|
|---|---|---|---|---|---|---|---|---|---|---|
| 2025-08-14 | 13F | Mml Investors Services, Llc | 54 525 | 290,83 | 1 | |||||
| 2025-07-11 | 13F | Compass Ion Advisors, LLC | 37 064 | 30,18 | 829 | 30,81 | ||||
| 2025-07-17 | 13F | Robbins Farley Llc | 1 746 | −4,28 | 39 | −2,50 | ||||
| 2025-08-12 | 13F | Reliant Wealth Planning | 90 992 | 13,40 | 2 035 | 13,95 | ||||
| 2025-08-06 | 13F | Commonwealth Equity Services, Llc | 597 469 | 1,30 | 13 | 0,00 | ||||
| 2025-07-29 | 13F | Stratos Wealth Partners, LTD. | 920 066 | −7,71 | 20 573 | −7,26 | ||||
| 2025-08-14 | 13F | Wells Fargo & Company/mn | 2 470 514 | 2,11 | 55 241 | 2,61 | ||||
| 2025-08-11 | 13F | United Capital Financial Advisers, Llc | 486 873 | 72,00 | 10 886 | 72,85 | ||||
| 2025-08-12 | 13F | Fca Corp /tx | 205 412 | 3,61 | 4 593 | 4,13 | ||||
| 2025-07-30 | 13F | Strategic Blueprint, LLC | 123 858 | 119,97 | 2 769 | 121,17 | ||||
| 2025-08-07 | 13F | Hughes Financial Services, LLC | 94 995 | 3,92 | 2 120 | 4,44 | ||||
| 2025-07-09 | 13F | Lbmc Investment Advisors, Llc | 16 480 | 56,19 | 368 | 57,26 | ||||
| 2025-08-04 | 13F | 4J Wealth Management LLC | 9 561 | 0,29 | 214 | 0,47 | ||||
| 2025-07-18 | 13F | Truist Financial Corp | 99 653 | −3,63 | 2 228 | −3,13 | ||||
| 2025-05-07 | 13F | Spectrum Wealth Counsel, LLC | 5 195 | 0,00 | 116 | 1,77 | ||||
| 2025-07-08 | 13F | Parallel Advisors, LLC | 122 891 | 12,31 | 2 748 | 12,86 | ||||
| 2025-07-30 | 13F/A | KPP Advisory Services LLC | 13 800 | 0,00 | 309 | 0,33 | ||||
| 2025-04-29 | 13F | Hm Payson & Co | 2 259 | 0,00 | 50 | 2,04 | ||||
| 2025-08-11 | 13F | Principal Securities, Inc. | 18 914 | 41,01 | 423 | 44,03 | ||||
| 2025-08-15 | 13F | Captrust Financial Advisors | 51 720 | 0,66 | 1 156 | 1,14 | ||||
| 2025-08-15 | 13F | Howland Capital Management Llc | 124 988 | 9,00 | 2 795 | 9,53 | ||||
| 2025-08-13 | 13F | SCS Capital Management LLC | 104 079 | 0,19 | 2 327 | 0,69 | ||||
| 2025-07-15 | 13F | BCS Wealth Management | 0 | −100,00 | 0 | |||||
| 2025-07-17 | 13F | Stockman Wealth Management, Inc. | 174 695 | 6,38 | 3 906 | 6,93 | ||||
| 2025-07-30 | 13F | D.a. Davidson & Co. | 260 580 | 2,93 | 5 827 | 3,43 | ||||
| 2025-08-14 | 13F | Jane Street Group, Llc | 40 461 | −62,66 | 905 | −62,51 | ||||
| 2025-08-01 | 13F | Bank of Jackson Hole Trust | 3 314 | 0,00 | 74 | 1,37 | ||||
| 2025-05-05 | 13F | Montag A & Associates Inc | 0 | −100,00 | 0 | |||||
| 2025-08-12 | 13F | AlphaCore Capital LLC | 49 | 0,00 | 1 | 0,00 | ||||
| 2025-08-14 | 13F | GWM Advisors LLC | 1 266 678 | −15,31 | 28 323 | −14,90 | ||||
| 2025-07-14 | 13F | UMA Financial Services, Inc. | 10 396 | 0,33 | 232 | 0,87 | ||||
| 2025-08-14 | 13F | Essential Planning, LLC. | 12 421 | 0,62 | 278 | 1,09 | ||||
| 2025-08-14 | 13F | Susquehanna International Group, Llp | 0 | −100,00 | 0 | |||||
| 2025-08-01 | 13F | Liberty Wealth Management Llc | 12 358 | 276 | ||||||
| 2025-08-12 | 13F | Tableaux Llc | 0 | −100,00 | 0 | |||||
| 2025-04-11 | 13F | Safeguard Financial, LLC | 9 910 | 0,18 | 220 | 1,85 | ||||
| 2025-07-23 | 13F | Valmark Advisers, Inc. | 88 970 | 15,22 | 1 989 | 15,77 | ||||
| 2025-07-07 | 13F | Trust Co | 472 918 | −3,55 | 10 574 | −3,08 | ||||
| 2025-08-14 | 13F | Hara Capital LLC | 4 925 | −31,12 | 110 | −30,82 | ||||
| 2025-07-30 | 13F | Bogart Wealth, LLC | 3 358 | 0,09 | 75 | 1,35 | ||||
| 2025-05-15 | 13F | Wealth Management Strategies, Inc. | 353 920 | 11,41 | 7 875 | 11 311,59 | ||||
| 2025-08-08 | 13F | Woodley Farra Manion Portfolio Management Inc | 10 205 | 228 | ||||||
| 2025-04-22 | 13F | Mendota Financial Group, LLC | 0 | −100,00 | 0 | |||||
| 2025-08-13 | 13F | Hamel Associates, Inc. | 10 590 | 237 | ||||||
| 2025-08-14 | 13F | UBS Group AG | 802 629 | 2,31 | 17 947 | 2,81 | ||||
| 2025-08-04 | 13F | Grant Street Asset Management, Inc. | 23 562 | 1,00 | 527 | 1,35 | ||||
| 2025-08-11 | 13F | Summit Wealth Partners, LLC | 14 275 | 46,10 | 319 | 47,00 | ||||
| 2025-08-12 | 13F | BlackRock, Inc. | 189 726 | 13,83 | 4 242 | 14,40 | ||||
| 2025-07-30 | 13F | Granite Harbor Advisors, Inc. | 38 294 | 1,99 | 856 | 2,51 | ||||
| 2025-08-14 | 13F | Black Maple Capital Management LP | 10 000 | 224 | ||||||
| 2025-08-07 | 13F | Allworth Financial LP | 145 592 | 48,75 | 3 255 | 49,24 | ||||
| 2025-08-13 | 13F | RFP Financial Group LLC | 29 674 | 11,12 | 664 | 11,62 | ||||
| 2025-07-11 | 13F | Financial Advisory Corp | 767 440 | 3,48 | 17 160 | 3,98 | ||||
| 2025-08-14 | 13F | Goldman Sachs Group Inc | 268 521 | 69,55 | 6 004 | 70,42 | ||||
| 2025-08-14 | 13F | Colony Group, LLC | 2 671 393 | 8,41 | 59 732 | 8,94 | ||||
| 2025-07-31 | 13F | Keeler THomas Management LLC | 58 987 | 43,31 | 1 319 | 44,04 | ||||
| 2025-08-01 | 13F | Envestnet Asset Management Inc | 983 561 | 42,14 | 21 992 | 42,85 | ||||
| 2025-08-14 | 13F | Raymond James Financial Inc | 1 359 691 | 12,41 | 30 403 | 12,96 | ||||
| 2025-08-13 | 13F | Northwestern Mutual Wealth Management Co | 184 355 | 17,07 | 4 122 | 17,67 | ||||
| 2025-07-14 | 13F | Wealth Advisory Solutions, LLC | 20 716 | 3,13 | 463 | 3,81 | ||||
| 2025-06-23 | NP | LDRT - iShares iBonds 1-5 Year Treasury Ladder ETF | 177 372 | 200,00 | 3 980 | 206,15 | ||||
| 2025-08-13 | 13F | Capital Analysts, Inc. | 2 080 | 0,00 | 0 | |||||
| 2025-08-14 | 13F | Integrated Wealth Concepts LLC | 340 157 | 50,73 | 7 606 | 51,46 | ||||
| 2025-08-18 | 13F/A | Kestra Investment Management, LLC | 17 399 | −44,02 | 389 | −43,70 | ||||
| 2025-07-18 | 13F | Foundry Financial Group, Inc. | 62 039 | −9,73 | 1 387 | −9,29 | ||||
| 2025-07-24 | 13F | Leo Wealth, LLC | 104 929 | −1,62 | 2 346 | −1,14 | ||||
| 2025-08-12 | 13F | Titleist Asset Management, Llc | 292 439 | 14,51 | 6 539 | 15,07 | ||||
| 2025-08-12 | 13F | MAI Capital Management | 18 544 | 1,00 | 415 | 1,47 | ||||
| 2025-08-05 | 13F | C2P Capital Advisory Group, LLC d.b.a. Prosperity Capital Advisors | 0 | −100,00 | 0 | |||||
| 2025-07-22 | 13F | Yoder Wealth Management, Inc. | 10 970 | 0,00 | 245 | 0,41 | ||||
| 2025-08-11 | 13F | Wealthspire Advisors, LLC | 12 315 | 275 | ||||||
| 2025-08-05 | 13F | Hills Bank & Trust Co | 4 529 | 101 | ||||||
| 2025-08-11 | 13F | Pineridge Advisors LLC | 264 183 | −6,30 | 5 907 | −5,83 | ||||
| 2025-09-04 | 13F/A | Advisor Group Holdings, Inc. | 274 200 | 8,69 | 6 135 | 9,22 | ||||
| 2025-08-05 | 13F | Fullcircle Wealth Llc | 28 942 | 0,00 | 646 | −0,31 | ||||
| 2025-08-14 | 13F | Stifel Financial Corp | 153 765 | 7,95 | 3 438 | 8,49 | ||||
| 2025-08-13 | 13F | Cerity Partners LLC | 21 057 | −0,44 | 471 | 0,00 | ||||
| 2025-08-13 | 13F | Boston Family Office Llc | 180 163 | 35,98 | 4 | 100,00 | ||||
| 2025-07-07 | 13F | Horizons Wealth Management | 1 549 | 46,96 | 35 | 47,83 | ||||
| 2025-08-12 | 13F | Steward Partners Investment Advisory, Llc | 435 921 | 44,39 | 9 747 | 45,11 | ||||
| 2025-07-30 | 13F/A | Old Point Trust & Financial Services N A | 2 100 | 0,00 | 47 | 0,00 | ||||
| 2025-07-23 | 13F | Prime Capital Investment Advisors, LLC | 11 105 | 248 | ||||||
| 2025-07-25 | 13F | Cwm, Llc | 43 588 | 12,15 | 1 | |||||
| 2025-08-19 | 13F | Asset Dedication, LLC | 12 142 | 31,04 | 271 | 31,55 | ||||
| 2025-07-16 | 13F | MKT Advisors LLC | 517 987 | 3,72 | 11 525 | 3,62 | ||||
| 2025-08-12 | 13F | LPL Financial LLC | 544 355 | 7,74 | 12 172 | 8,27 | ||||
| 2025-05-07 | 13F | Mb, Levis & Associates, Llc | 0 | −100,00 | 0 | −100,00 | ||||
| 2025-07-25 | 13F | Heartland Bank & Trust Co | 17 835 | 0,00 | 399 | 0,51 | ||||
| 2025-07-08 | 13F | Atwood & Palmer Inc | 907 555 | −19,96 | 20 293 | −19,56 | ||||
| 2025-07-11 | 13F | Prosperity Planning, Inc. | 353 | 4,14 | ||||||
| 2025-08-13 | 13F | Baird Financial Group, Inc. | 124 018 | 86,80 | 2 773 | 87,75 | ||||
| 2025-07-22 | 13F | Merit Financial Group, LLC | 10 922 | 244 | ||||||
| 2025-08-08 | 13F | Creative Planning | 20 936 | 0,00 | 468 | 0,65 | ||||
| 2025-07-25 | 13F | Hemington Wealth Management | 36 | 0,00 | 0 | |||||
| 2025-08-11 | 13F | HighTower Advisors, LLC | 15 850 | 20,59 | 354 | 21,23 | ||||
| 2025-08-14 | 13F | Hrt Financial Lp | 0 | −100,00 | 0 | |||||
| 2025-08-26 | 13F/A | Thrivent Financial For Lutherans | 0 | −100,00 | 0 | |||||
| 2025-08-01 | 13F | Koss-Olinger Consulting, LLC | 22 903 | 0,32 | 512 | 0,79 | ||||
| 2025-08-18 | 13F/A | National Bank Of Canada /fi/ | 12 268 | 5,40 | 274 | 6,20 | ||||
| 2025-07-23 | 13F | Horizon Advisory Services, Inc. | 841 186 | 1,84 | 18 809 | 2,34 | ||||
| 2025-07-24 | 13F | Us Bancorp \de\ | 3 050 | 0,00 | 68 | 1,49 | ||||
| 2025-08-05 | 13F | Bank Of Montreal /can/ | 3 294 | 59,67 | 74 | 62,22 | ||||
| 2025-07-23 | 13F | Element Wealth, LLC | 14 720 | 33,88 | 329 | 34,84 | ||||
| 2025-07-17 | 13F | Janney Montgomery Scott LLC | 187 490 | 27,56 | 4 | 33,33 | ||||
| 2025-04-17 | 13F | Montecito Bank & Trust | 38 664 | 180,30 | 860 | 184,77 | ||||
| 2025-08-14 | 13F | Fmr Llc | 1 105 | 100,54 | 25 | 100,00 | ||||
| 2025-07-24 | 13F | Eastern Bank | 950 | 0,00 | 21 | 0,00 | ||||
| 2025-07-31 | 13F | Cambridge Investment Research Advisors, Inc. | 41 558 | 8,29 | 1 | |||||
| 2025-08-08 | 13F | Thoroughbred Financial Services, Llc | 132 000 | −13,79 | 3 | −33,33 | ||||
| 2025-08-14 | 13F | Mercer Global Advisors Inc /adv | 677 243 | 28,24 | 15 143 | 28,88 | ||||
| 2025-08-12 | 13F | Jacobi Capital Management LLC | 17 107 | 6,51 | 383 | 7,00 | ||||
| 2025-08-01 | 13F | Logan Capital Management Inc | 289 | 0,00 | 6 | 0,00 | ||||
| 2025-09-09 | 13F | Cambridge Financial Group, LLC | 11 704 | 0,00 | 262 | 0,38 | ||||
| 2025-07-11 | 13F | Farther Finance Advisors, LLC | 0 | −100,00 | 0 | |||||
| 2025-07-24 | 13F | Blair William & Co/il | 2 286 | −8,41 | 51 | −7,27 | ||||
| 2025-08-14 | 13F | Financial Engines Advisors L.L.C. | 204 350 | −22,84 | 4 569 | −22,45 | ||||
| 2025-08-14 | 13F | Citadel Advisors Llc | 40 866 | −67,43 | 914 | −67,29 | ||||
| 2025-07-30 | 13F | Journey Advisory Group, LLC | 791 883 | 1,73 | 17 706 | 2,23 | ||||
| 2025-08-12 | 13F | Laurel Wealth Advisors LLC | 32 422 | 2 136,00 | 1 | −96,87 | ||||
| 2025-08-04 | 13F | Jim Saulnier & Associates, Llc | 83 044 | 14,31 | 1 857 | 14,85 | ||||
| 2025-08-04 | 13F | Atria Investments Llc | 99 009 | 0,22 | 2 214 | 0,68 | ||||
| 2025-08-06 | 13F | Modera Wealth Management, LLC | 12 298 | 275 | ||||||
| 2025-05-12 | 13F | Benjamin Edwards Inc | 0 | −100,00 | 0 | |||||
| 2025-07-24 | 13F | Moseley Investment Management Inc | 515 238 | 18,29 | 11 521 | 18,87 | ||||
| 2025-08-14 | 13F | Eight 31 Financial Llc | 346 647 | −5,62 | 7 751 | −5,15 | ||||
| 2025-07-15 | 13F | Highland Financial Advisors, LLC | 11 430 | 0,00 | 256 | 0,39 | ||||
| 2025-07-21 | 13F | Old Second National Bank Of Aurora | 1 825 | 0,00 | 41 | 0,00 | ||||
| 2025-07-11 | 13F | Pinnacle Bancorp, Inc. | 15 492 | 0,00 | 346 | 0,58 | ||||
| 2025-08-12 | 13F | Jpmorgan Chase & Co | 0 | −100,00 | 0 | |||||
| 2025-08-14 | 13F | Snowden Capital Advisors LLC | 362 669 | −0,01 | 8 109 | 0,48 | ||||
| 2025-07-08 | 13F | Apella Capital, LLC | 90 433 | 26,81 | 2 007 | 26,94 | ||||
| 2025-08-08 | 13F | Cetera Investment Advisers | 116 601 | −0,60 | 2 607 | −0,11 | ||||
| 2025-08-12 | 13F | Associated Banc-corp | 74 568 | 25,77 | 1 667 | 26,38 | ||||
| 2025-08-14 | 13F | Mariner, LLC | 40 000 | 894 | ||||||
| 2025-07-08 | 13F | Lowe Wealth Advisors, LLC | 4 218 | −21,09 | 94 | −20,34 | ||||
| 2025-04-01 | 13F | Cornerstone Planning, LLC | 120 926 | 2 649 | ||||||
| 2025-07-14 | 13F | Park Avenue Securities Llc | 230 265 | 1,56 | 5 | 0,00 | ||||
| 2025-07-17 | 13F/A | Capital Investment Advisors, LLC | 52 356 | 19,91 | 1 171 | 20,49 | ||||
| 2025-08-14 | 13F | Vista Private Wealth Partners. LLC | 750 016 | 8,81 | 16 770 | 9,35 | ||||
| 2025-07-22 | 13F | Mascoma Wealth Management LLC | 1 985 | 0,00 | 44 | 0,00 | ||||
| 2025-07-22 | 13F | Berger Financial Group, Inc | 9 601 | 0,00 | 215 | 0,47 | ||||
| 2025-08-14 | 13F | Comerica Bank | 5 197 | −0,29 | 116 | 0,87 | ||||
| 2025-08-07 | 13F | Kestra Private Wealth Services, Llc | 15 820 | 354 | ||||||
| 2025-07-11 | 13F | First PREMIER Bank | 3 050 | −1,33 | 0 | |||||
| 2025-08-04 | 13F | Creative Financial Designs Inc /adv | 189 | 0,00 | 4 | 0,00 | ||||
| 2025-08-14 | 13F | Ameriprise Financial Inc | 217 421 | −5,94 | 4 857 | −5,62 | ||||
| 2025-08-12 | 13F | Proequities, Inc. | 0 | 0 | ||||||
| 2025-07-18 | 13F | Precision Wealth Strategies, LLC | 10 432 | 233 | ||||||
| 2025-08-14 | 13F | Federation des caisses Desjardins du Quebec | 69 763 | 0,85 | 1 560 | 1,30 | ||||
| 2025-07-28 | 13F | Harbour Investments, Inc. | 14 856 | 18,28 | 332 | 19,00 | ||||
| 2025-08-14 | 13F | Connecticut Wealth Management, LLC | 11 862 | 265 | ||||||
| 2025-07-18 | 13F | Northstar Group, Inc. | 244 218 | 28,26 | 5 461 | 28,90 | ||||
| 2025-05-12 | 13F | Kohmann Bosshard Financial Services, LLC | 0 | −100,00 | 0 | |||||
| 2025-05-09 | 13F | TD Waterhouse Canada Inc. | 0 | −100,00 | 0 | |||||
| 2025-08-08 | 13F | WASHINGTON TRUST Co | 0 | −100,00 | 0 | |||||
| 2025-08-13 | 13F | Baltimore-Washington Financial Advisors, Inc. | 633 631 | 5,43 | 14 168 | 5,95 | ||||
| 2025-07-11 | 13F | Trinity Wealth Management, LLC | 15 078 | 0,00 | 337 | 0,60 | ||||
| 2025-08-05 | 13F | Cherry Tree Wealth Management, LLC | 4 563 | 13,45 | 102 | 14,61 | ||||
| 2025-07-08 | 13F | Legacy Private Trust Co. | 488 906 | 2,05 | 10 932 | 2,55 | ||||
| 2025-08-07 | 13F | CENTRAL TRUST Co | 292 634 | 5,64 | 6 543 | 6,17 | ||||
| 2025-08-14 | 13F | STAR Financial Bank | 94 839 | 10,76 | 2 121 | 11,29 | ||||
| 2025-07-24 | 13F | IFP Advisors, Inc | 227 324 | 4,87 | 5 083 | 5,39 | ||||
| 2025-07-31 | 13F | Blake Schutter Theil Wealth Advisors, LLC | 24 191 | 0,00 | 541 | 0,37 | ||||
| 2025-08-14 | 13F | AllSquare Wealth Management LLC | 3 207 | 4,36 | 72 | 4,41 | ||||
| 2025-07-28 | 13F | Duncker Streett & Co Inc | 26 855 | 0,00 | 600 | 0,50 | ||||
| 2025-08-15 | 13F | Equitable Holdings, Inc. | 10 736 | 15,95 | 240 | 16,50 | ||||
| 2025-08-13 | 13F | Cary Street Partners Financial Llc | 41 917 | 3,10 | 937 | 3,65 | ||||
| 2025-08-28 | NP | NDOW - Anydrus Advantage ETF | 131 807 | 2 947 | ||||||
| 2025-05-06 | 13F | Venturi Wealth Management, LLC | 0 | −100,00 | 0 | |||||
| 2025-07-21 | 13F | Barrett & Company, Inc. | 21 503 | 10,47 | 481 | 10,85 | ||||
| 2025-07-22 | 13F | Belpointe Asset Management LLC | 21 610 | 483 | ||||||
| 2025-07-29 | 13F | Straight Path Wealth Management | 22 260 | 6,03 | 498 | 6,42 | ||||
| 2025-07-29 | 13F | Private Trust Co Na | 1 162 | −81,33 | 26 | −81,88 | ||||
| 2025-08-08 | 13F | Gts Securities Llc | 0 | −100,00 | 0 | |||||
| 2025-07-23 | 13F | Evexia Wealth Llc | 22 183 | 15,02 | 493 | 15,46 | ||||
| 2025-08-01 | 13F | Austin Private Wealth, LLC | 40 506 | 12,62 | 906 | 13,13 | ||||
| 2025-08-14 | 13F | Royal Bank Of Canada | 465 046 | −6,41 | 10 399 | −5,94 | ||||
| 2025-04-29 | 13F | Bank of New York Mellon Corp | 0 | −100,00 | 0 | |||||
| 2025-07-22 | 13F | Autumn Glory Partners, LLC | 12 918 | 0,23 | 289 | 0,70 | ||||
| 2025-07-14 | 13F | Kfg Wealth Management, Llc | 9 299 | 3,06 | 208 | 3,50 | ||||
| 2025-08-08 | 13F | Pnc Financial Services Group, Inc. | 63 | 0,00 | 1 | 0,00 | ||||
| 2025-07-16 | 13F | Signaturefd, Llc | 150 110 | 63,69 | 3 356 | 64,51 | ||||
| 2025-08-15 | 13F | Morgan Stanley | 3 279 644 | −4,43 | 73 333 | −3,96 | ||||
| 2025-07-09 | 13F | Krilogy Financial LLC | 127 113 | −4,63 | 2 842 | −4,15 | ||||
| 2025-07-21 | 13F | Crews Bank & Trust | 14 725 | 3,15 | 329 | 3,79 | ||||
| 2025-07-29 | 13F | Carmel Capital Partners, LLC | 250 233 | 1,25 | 5 595 | 1,75 | ||||
| 2025-07-31 | 13F | Leavell Investment Management, Inc. | 87 123 | 37,47 | 1 948 | 38,16 | ||||
| 2025-08-11 | 13F | Midwest Professional Planners, LTD. | 50 617 | 18,64 | 1 132 | 19,18 | ||||
| 2025-08-12 | 13F | CIBC Private Wealth Group, LLC | 449 | 10 | ||||||
| 2025-07-21 | 13F | Cliftonlarsonallen Wealth Advisors, Llc | 205 773 | 16,58 | 4 601 | 17,16 | ||||
| 2025-07-15 | 13F | Retireful, LLC | 131 807 | 2 947 | ||||||
| 2025-08-14 | 13F | Bank Of America Corp /de/ | 2 263 583 | 9,61 | 50 614 | 10,15 | ||||
| 2025-07-16 | 13F | Rebalance, Llc | 151 843 | 162,95 | 3 395 | 164,41 | ||||
| 2025-07-29 | 13F | Accretive Wealth Partners, LLC | 146 699 | 6,90 | 3 280 | 7,36 | ||||
| 2025-08-15 | 13F | Scissortail Wealth Management, LLC | 422 078 | 2,33 | 9 438 | 2,83 | ||||
| 2025-07-01 | 13F | Confluence Investment Management Llc | 436 479 | −0,50 | 9 760 | −0,01 | ||||
| 2025-08-08 | 13F | Mv Capital Management, Inc. | 251 720 | 19,79 | 5 628 | 20,39 | ||||
| 2025-08-15 | 13F | Kestra Advisory Services, LLC | 31 190 | 0,34 | 697 | 0,87 | ||||
| 2025-07-21 | 13F | Asset Advisors Investment Management, LLC | 566 440 | 102,17 | 12 666 | 103,16 | ||||
| 2025-08-01 | 13F | Transcend Wealth Collective, Llc | 123 550 | −43,63 | 2 763 | −43,36 | ||||
| 2025-07-30 | 13F | Probity Advisors, Inc. | 384 268 | 4,74 | 8 592 | 5,27 | ||||
| 2025-08-05 | 13F | Sigma Planning Corp | 55 618 | 4,08 | 1 244 | 4,63 | ||||
| 2025-08-05 | 13F | Strategic Financial Concepts, LLC | 12 525 | 0,00 | 280 | 0,72 | ||||
| 2025-07-24 | 13F | Costello Asset Management, INC | 21 | 5,00 | 0 | |||||
| 2025-08-01 | 13F | Signature Wealth Management Group | 22 943 | −1,39 | 513 | −0,77 | ||||
| 2025-08-12 | 13F | Coldstream Capital Management Inc | 25 451 | 0,00 | 569 | 0,53 | ||||
| 2025-07-21 | 13F | Exchange Capital Management, Inc. | 11 179 | 250 | ||||||
| 2025-08-11 | 13F | Independent Advisor Alliance | 10 552 | −3,40 | 236 | −3,29 | ||||
| 2025-08-12 | 13F | PSI Advisors, LLC | 0 | −100,00 | 0 | |||||
| 2025-08-12 | 13F | Global Retirement Partners, LLC | 61 953 | −55,37 | 1 385 | −54,44 | ||||
| 2025-07-24 | 13F | Stonebridge Financial Group, LLC | 0 | −100,00 | 0 | |||||
| 2025-07-18 | 13F | Consolidated Portfolio Review Corp | 42 875 | 7,01 | 959 | 7,52 | ||||
| 2025-07-31 | 13F | United Community Bank | 11 520 | 0,00 | 258 | 0,39 | ||||
| 2025-07-11 | 13F | Shelton Wealth Management, Llc | 339 810 | 4,26 | 7 598 | 4,79 | ||||
| 2025-08-11 | 13F | CFS Investment Advisory Services, LLC | 17 004 | 0,38 | 0 | |||||
| 2025-07-30 | 13F | DecisionMap Wealth Management, LLC | 11 672 | 29,66 | 261 | 30,00 | ||||
| 2025-08-01 | 13F | Schmidt P J Investment Management Inc | 13 058 | 292 |