Grundläggande statistik
| Institutionella ägare | 155 total, 155 long only, 0 short only, 0 long/short - change of 14,81% MRQ |
| Genomsnittlig portföljallokering | 0.4225 % - change of −51,65% MRQ |
| Institutionella aktier (lång) | 11 445 076 (ex 13D/G) - change of 0,13MM shares 1,13% MRQ |
| Institutionellt värde (lång) | $ 867 599 USD ($1000) |
Institutionellt ägande och aktieägare
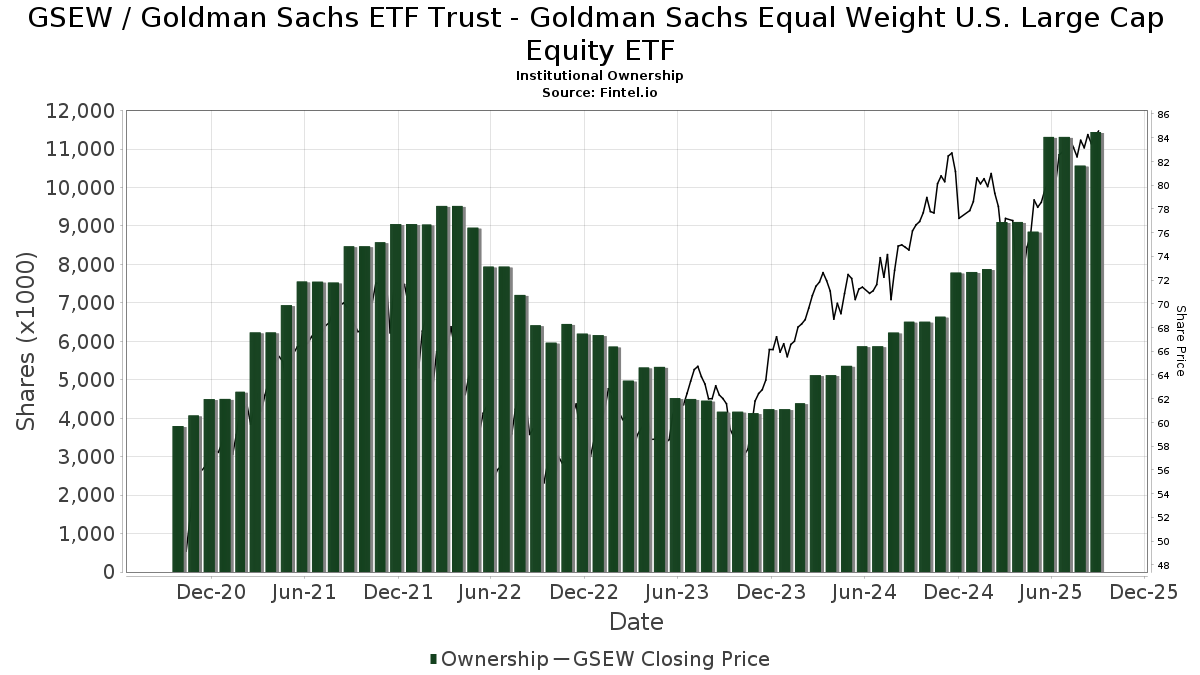
Goldman Sachs ETF Trust - Goldman Sachs Equal Weight U.S. Large Cap Equity ETF (US:GSEW) har 155 Institutionella ägare och aktieägare som har lämnat in 13D/G- eller 13F-formulär till Securities Exchange Commission (SEC). Dessa institut innehar totalt 11,445,076 aktier. Största aktieägare inkluderar Integrated Wealth Concepts LLC, Endurance Services Ltd, Morgan Stanley, Bank Of America Corp /de/, Aptus Capital Advisors, LLC, Ckw Financial Group, Great Lakes Retirement, Inc., Raymond James Financial Inc, Resources Investment Advisors, LLC., and Ameriprise Financial Inc .
Goldman Sachs ETF Trust - Goldman Sachs Equal Weight U.S. Large Cap Equity ETF (BATS:GSEW) Institutionell ägarstruktur visar institutioners och fonders nuvarande positioner i företaget, samt de senaste förändringarna i positionernas storlek. Större aktieägare kan vara enskilda investerare, fonder, hedgefonder eller institutioner. Bilaga 13D visar att investeraren äger (eller ägde) mer än 5% av företaget och avser (eller avsåg) att aktivt eftersträva en förändring av affärsstrategin. Schedule 13G indikerar en passiv investering på över 5%.
The share price as of September 16, 2025 is 84,36 / share. Previously, on September 17, 2024, the share price was 76,31 / share. This represents an increase of 10,55% over that period.
Fondsentimentets poäng
Fondsentimentet poängen(fka Ägarackumulation-poäng) visar vilka aktier som är mest köpta av fonder. Det är resultatet av en sofistikerad kvantitativ flerfaktormodell som identifierar företag med de högsta nivåerna av institutionell ackumulering. Poängsättningsmodellen använder en kombination av den totala ökningen av redovisade ägare, förändringarna i portföljallokeringarna för dessa ägare och andra mått. Siffran sträcker sig från 0 till 100, där högre siffror indikerar en högre nivå av ackumulering i förhållande till sina konkurrenter, och 50 är genomsnittet.
Uppdateringsfrekvens: Dagligen
Se Ownership Explorer, som innehåller en lista över de högst rankade företagen.
Institutionell sälj/köp-kvot
Förutom att rapportera vanliga eget kapital- och skuldemissioner måste institutioner med mer än 100MM tillgångar under förvaltning också avslöja sina innehav av sälj- och köpoptioner. Eftersom säljoptioner i allmänhet indikerar ett negativt sentiment och köpoptioner indikerar ett positivt sentiment, kan vi få en uppfattning om det övergripande institutionella sentimentet genom att plotta förhållandet mellan säljoptioner och köpoptioner. Diagrammet till höger visar det historiska förhållandet mellan sälj- och köpoptioner för detta instrument.
Genom att använda sälj/köp-kvoten som en indikator på aktieägarnas sentiment undviker man en av de största bristerna med att använda det totala institutionella ägandet, nämligen att en betydande del av de förvaltade tillgångarna investeras passivt för att följa index. Passivt förvaltade fonder köper vanligtvis inte optioner, så indikatorn för sälj/köp-kvoten ger en bättre bild av stämningen i aktivt förvaltade fonder.
13F- och NPORT-arkiveringar
Detaljer om 13F-arkiveringar är gratis. Detaljer om NP-arkiveringar kräver ett premiummedlemskap. Gröna rader indikerar nya positioner. Röda rader indikerar stängda positioner. Klicka på länk symbolen för att se hela transaktionshistoriken.
Uppgradera
för att låsa upp premiumdata och exportera till Excel ![]() .
.
| Fil Datum | Källa | Investerare | Typ | Genomsnittligt pris (beräknat) |
Aktier | Δ Aktier (%) |
Rapporterat värde (1000 USD) |
Δ Värde (%) |
Portföljallokering (%) |
|
|---|---|---|---|---|---|---|---|---|---|---|
| 2025-07-08 | 13F | Richard P Slaughter Associates Inc | 2 831 | −25,03 | 231 | −19,86 | ||||
| 2025-08-08 | 13F | Gts Securities Llc | 27 324 | 2 228 | ||||||
| 2025-08-12 | 13F | Vawter Financial, Ltd. | 0 | −100,00 | 0 | |||||
| 2025-08-12 | 13F | Proequities, Inc. | 0 | 0 | ||||||
| 2025-07-22 | 13F | Wealthcare Advisory Partners LLC | 71 642 | 5 842 | ||||||
| 2025-08-08 | 13F | New England Capital Financial Advisors LLC | 2 187 | −39,55 | 178 | −35,27 | ||||
| 2025-08-05 | 13F | EPG Wealth Management LLC | 0 | −100,00 | 0 | |||||
| 2025-08-08 | 13F | Paragon Capital Management LLC | 8 525 | 0,55 | 695 | 7,92 | ||||
| 2025-07-11 | 13F | Wealth Management Partners, LLC | 0 | −100,00 | 0 | |||||
| 2025-08-12 | 13F | Virtu Financial LLC | 31 836 | 3 | ||||||
| 2025-05-12 | 13F | Simplex Trading, Llc | 0 | −100,00 | 0 | |||||
| 2025-08-14 | 13F | Brinker Capital Investments, LLC | 0 | −100,00 | 0 | |||||
| 2025-08-14 | 13F | Stifel Financial Corp | 34 606 | 2 822 | ||||||
| 2025-08-18 | 13F | Goodman Advisory Group, LLC | 0 | −100,00 | 0 | |||||
| 2025-08-13 | 13F | Cerity Partners LLC | 94 569 | 0,72 | 7 711 | 8,01 | ||||
| 2025-05-16 | 13F | Financial Strategies Group, Inc. | 0 | −100,00 | 0 | |||||
| 2025-07-23 | 13F | Country Club Bank /gfn | 31 077 | 17,29 | 2 524 | 25,96 | ||||
| 2025-07-25 | 13F | SPC Financial, Inc. | 91 998 | −90,06 | 7 501 | −89,34 | ||||
| 2025-07-17 | 13F | LexAurum Advisors, LLC | 8 223 | 181,71 | 671 | 203,17 | ||||
| 2025-08-07 | 13F | WESCAP Management Group, Inc. | 67 669 | −0,94 | 5 518 | 6,22 | ||||
| 2025-08-11 | 13F | Dorsey & Whitney Trust CO LLC | 53 473 | −1,06 | 4 360 | 6,11 | ||||
| 2025-08-11 | 13F | Principal Securities, Inc. | 921 | 0,00 | 75 | 5,63 | ||||
| 2025-07-16 | 13F | Valicenti Advisory Services Inc | 21 117 | 1,50 | 2 | 0,00 | ||||
| 2025-08-11 | 13F | Sierra Capital LLC | 88 538 | −0,45 | 7 | 16,67 | ||||
| 2025-08-07 | 13F | 1620 Investment Advisors, Inc. | 1 | 0 | ||||||
| 2025-08-13 | 13F | Kilter Group LLC | 88 586 | 7 223 | ||||||
| 2025-07-25 | 13F | Sequoia Financial Advisors, LLC | 2 963 | 242 | ||||||
| 2025-08-05 | 13F | Advisors Preferred, LLC | 25 700 | 0,00 | 2 116 | 7,96 | ||||
| 2025-08-14 | 13F | Wilkins Miller Wealth Management, LLC | 56 443 | 14,69 | 4 602 | 22,98 | ||||
| 2025-08-14 | 13F | Aqr Capital Management Llc | 6 733 | 549 | ||||||
| 2025-08-14 | 13F | Citadel Advisors Llc | 3 788 | −88,09 | 309 | −87,26 | ||||
| 2025-08-01 | 13F | Private Wealth Partners, LLC | 14 450 | −41,60 | 1 178 | −37,37 | ||||
| 2025-07-30 | 13F | Exencial Wealth Advisors, Llc | 11 609 | 947 | ||||||
| 2025-08-08 | 13F | Creative Planning | 102 097 | 0,90 | 8 325 | 8,22 | ||||
| 2025-08-14 | 13F | Knightsbridge Asset Management, Llc | 4 005 | −34,43 | 327 | −29,74 | ||||
| 2025-04-21 | 13F | ORG Partners LLC | 0 | −100,00 | 0 | |||||
| 2025-08-11 | 13F | United Advisor Group, LLC | 43 500 | 27,76 | 3 547 | 37,02 | ||||
| 2025-07-22 | 13F | Iron Horse Wealth Management, LLC | 740 | −7,50 | 60 | 0,00 | ||||
| 2025-08-14 | 13F | Royal Bank Of Canada | 58 200 | −51,44 | 4 746 | −47,92 | ||||
| 2025-08-14 | 13F | Integrated Wealth Concepts LLC | 1 262 686 | 20,51 | 102 959 | 29,22 | ||||
| 2025-07-30 | 13F | Wbh Advisory Inc | 3 480 | 284 | ||||||
| 2025-08-14 | 13F | Qube Research & Technologies Ltd | 120 | −82,12 | 10 | −82,35 | ||||
| 2025-08-13 | 13F | Virtue Capital Management, LLC | 12 961 | 9,06 | 1 057 | 17,07 | ||||
| 2025-08-19 | 13F | Advisory Services Network, LLC | 9 556 | 788 | ||||||
| 2025-07-17 | 13F | Janney Montgomery Scott LLC | 63 621 | 29,61 | 5 | 66,67 | ||||
| 2025-08-28 | NP | SNAV - Mohr Sector Navigator ETF | 0 | −100,00 | 0 | −100,00 | ||||
| 2025-07-08 | 13F | Legacy Private Trust Co. | 13 805 | −8,50 | 1 126 | −1,92 | ||||
| 2025-07-29 | 13F | Stephens Inc /ar/ | 9 500 | 0,00 | 775 | 7,20 | ||||
| 2025-04-03 | 13F | First Hawaiian Bank | 46 527 | −0,77 | 3 538 | −2,29 | ||||
| 2025-07-25 | 13F | JustInvest LLC | 4 882 | −15,08 | 398 | −8,92 | ||||
| 2025-07-15 | 13F | SJS Investment Consulting Inc. | 476 | 0,00 | 39 | 5,56 | ||||
| 2025-08-14 | 13F | Fort Point Capital Partners LLC | 52 977 | −69,12 | 4 320 | −66,89 | ||||
| 2025-08-01 | NP | Advisors Preferred Trust - Dynamic Alpha Macro Fund Institutional Class Shares | 25 700 | 0,00 | 2 096 | 7,22 | ||||
| 2025-08-12 | 13F | LPL Financial LLC | 198 382 | −30,93 | 16 176 | −25,93 | ||||
| 2025-08-14 | 13F | Bank Of America Corp /de/ | 592 731 | −0,26 | 48 331 | 6,95 | ||||
| 2025-07-16 | 13F | Perigon Wealth Management, LLC | 43 938 | 4,39 | 3 583 | 11,94 | ||||
| 2025-08-12 | 13F | Osborne Partners Capital Management, Llc | 26 890 | 12,70 | 2 193 | 20,84 | ||||
| 2025-08-15 | 13F | Captrust Financial Advisors | 3 032 | −40,75 | 247 | −36,50 | ||||
| 2025-07-09 | 13F | Sunpointe, LLC | 2 932 | 239 | ||||||
| 2025-08-12 | 13F | Global Retirement Partners, LLC | 6 042 | −48,90 | 493 | −46,11 | ||||
| 2025-04-28 | 13F | Financial Advocates Investment Management | 0 | −100,00 | 0 | |||||
| 2025-07-31 | 13F | CVA Family Office, LLC | 7 843 | 0,05 | 640 | 7,21 | ||||
| 2025-08-04 | 13F | FRG Family Wealth Advisors LLC | 4 360 | 356 | ||||||
| 2025-07-17 | 13F | Sound Income Strategies, LLC | 143 | 0,00 | 12 | 10,00 | ||||
| 2025-08-14 | 13F | Fmr Llc | 3 148 | 1,03 | 257 | 8,47 | ||||
| 2025-08-14 | 13F | Two Sigma Securities, Llc | 2 620 | 214 | ||||||
| 2025-08-04 | 13F | Arkadios Wealth Advisors | 5 078 | 0,30 | 414 | 7,81 | ||||
| 2025-05-19 | 13F | Heck Capital Advisors, LLC | 0 | −100,00 | 0 | −100,00 | ||||
| 2025-07-18 | 13F | Parsons Capital Management Inc/ri | 27 880 | 3,53 | 2 273 | 11,04 | ||||
| 2025-08-14 | 13F | Susquehanna International Group, Llp | 232 469 | 1 332,34 | 18 956 | 1 436,06 | ||||
| 2025-09-04 | 13F/A | Advisor Group Holdings, Inc. | 11 387 | 0,70 | 929 | 8,03 | ||||
| 2025-07-28 | 13F | Rosenberg Matthew Hamilton | 320 | 0,00 | 26 | 8,33 | ||||
| 2025-08-12 | 13F | Jpmorgan Chase & Co | 14 911 | 93,10 | 1 216 | 106,98 | ||||
| 2025-08-14 | 13F | Raymond James Financial Inc | 353 011 | 19,73 | 28 785 | 28,39 | ||||
| 2025-08-12 | 13F | Richmond Investment Services, LLC | 4 196 | 342 | ||||||
| 2025-08-13 | 13F | BlackDiamond Wealth Management Inc. | 3 357 | −3,03 | 276 | 4,55 | ||||
| 2025-09-03 | 13F | Q3 Asset Management | 32 848 | 3 | ||||||
| 2025-08-12 | 13F | Eldridge Investment Advisors, Inc. | 22 575 | 18,00 | 1 841 | 26,55 | ||||
| 2025-08-14 | 13F | Horizon Investments, LLC | 186 114 | −3,08 | 15 176 | 3,93 | ||||
| 2025-08-01 | 13F | Transcend Wealth Collective, Llc | 4 013 | 14,62 | 327 | 22,93 | ||||
| 2025-08-05 | 13F | GPS Wealth Strategies Group, LLC | 425 | 0,00 | 35 | 6,25 | ||||
| 2025-08-11 | 13F | Private Advisor Group, LLC | 2 554 | 208 | ||||||
| 2025-07-09 | 13F | Christopher J. Hasenberg, Inc | 117 | 0,00 | 10 | 12,50 | ||||
| 2025-08-26 | 13F | Nautilus Advisors LLC | 26 412 | 3,25 | 2 154 | 10,69 | ||||
| 2025-08-07 | 13F | Commerce Bank | 3 387 | 0,00 | 276 | 7,39 | ||||
| 2025-07-18 | 13F | O'ROURKE & COMPANY, Inc | 13 772 | −1,27 | 1 123 | 5,94 | ||||
| 2025-08-12 | 13F | O'shaughnessy Asset Management, Llc | 217 | 18 | ||||||
| 2025-07-17 | 13F | Sterneck Capital Management, LLC | 4 646 | 0,00 | 379 | 7,08 | ||||
| 2025-08-07 | 13F | Sierra Ocean, Llc | 1 033 | 0,00 | 84 | 7,69 | ||||
| 2025-08-07 | 13F | Nwam Llc | 12 483 | 130,36 | 1 038 | 151,94 | ||||
| 2025-08-13 | 13F/A | StoneX Group Inc. | 0 | −100,00 | 0 | −100,00 | ||||
| 2025-08-14 | 13F | GWM Advisors LLC | 9 569 | −36,25 | 780 | −31,64 | ||||
| 2025-07-02 | 13F | Central Pacific Bank - Trust Division | 5 923 | 0,00 | 483 | 7,11 | ||||
| 2025-08-12 | 13F | Steward Partners Investment Advisory, Llc | 7 083 | 103,94 | 578 | 118,56 | ||||
| 2025-08-15 | 13F | Kestra Advisory Services, LLC | 5 650 | 17,71 | 461 | 26,37 | ||||
| 2025-08-14 | 13F | Visionary Wealth Advisors | 60 711 | −10,34 | 4 950 | −3,85 | ||||
| 2025-07-09 | 13F | Westshore Wealth, LLC | 18 136 | 81,72 | 1 479 | 94,99 | ||||
| 2025-08-06 | 13F | Vantage Financial Partners, LLC | 66 800 | 5 447 | ||||||
| 2025-08-19 | 13F | National Asset Management, Inc. | 0 | −100,00 | 0 | |||||
| 2025-07-15 | 13F | Retireful, LLC | 0 | −100,00 | 0 | |||||
| 2025-07-29 | 13F | Signature Estate & Investment Advisors Llc | 3 009 | 0,40 | 245 | 7,93 | ||||
| 2025-08-11 | 13F | Aptus Capital Advisors, LLC | 540 589 | 10,74 | 44 080 | 18,75 | ||||
| 2025-07-18 | 13F | Consolidated Portfolio Review Corp | 105 928 | 0,64 | 8 637 | 7,92 | ||||
| 2025-08-13 | 13F | Alerus Financial Na | 151 | 12 | ||||||
| 2025-08-15 | 13F | CI Private Wealth, LLC | 9 620 | −17,21 | 784 | −11,21 | ||||
| 2025-07-24 | 13F | IFP Advisors, Inc | 161 088 | 0,86 | 13 135 | 8,16 | ||||
| 2025-08-06 | 13F | Commonwealth Equity Services, Llc | 50 262 | 61,80 | 4 | 100,00 | ||||
| 2025-07-07 | 13F | Accelerate Investment Advisors LLC | 3 370 | −0,30 | 275 | 7,03 | ||||
| 2025-07-31 | 13F | Richards, Merrill & Peterson, Inc. | 4 422 | 112,60 | 361 | 127,85 | ||||
| 2025-08-14 | 13F | Mariner, LLC | 15 313 | −19,66 | 1 249 | −13,87 | ||||
| 2025-08-14 | 13F | Barnett & Company, Inc. | 6 746 | 4,70 | 550 | 12,47 | ||||
| 2025-08-13 | 13F | Quest Investment Management Llc | 119 725 | 9 762 | ||||||
| 2025-08-14 | 13F | Jane Street Group, Llc | 14 992 | −45,19 | 1 222 | −41,22 | ||||
| 2025-07-29 | 13F | Stratos Wealth Advisors, LLC | 4 148 | −5,30 | 338 | 1,50 | ||||
| 2025-08-04 | 13F | Great Lakes Retirement, Inc. | 405 426 | 28,66 | 33 058 | 37,97 | ||||
| 2025-08-11 | 13F | HighTower Advisors, LLC | 40 586 | 18,87 | 3 309 | 27,47 | ||||
| 2025-08-12 | 13F | MAI Capital Management | 4 250 | 14,99 | 347 | 23,13 | ||||
| 2025-08-08 | 13F | Cornerstone Advisors Asset Management, Inc | 128 491 | 2,47 | 10 477 | 9,89 | ||||
| 2025-08-11 | 13F | Traub Capital Management LLC | 59 | 5 | ||||||
| 2025-07-03 | 13F | TrueWealth Advisors, LLC | 2 654 | −10,88 | 216 | −4,42 | ||||
| 2025-04-23 | 13F | Bessemer Group Inc | 0 | −100,00 | 0 | |||||
| 2025-08-14 | 13F | Bbr Partners, Llc | 3 344 | 0,00 | 273 | 7,09 | ||||
| 2025-08-05 | 13F | Sigma Planning Corp | 0 | −100,00 | 0 | |||||
| 2025-08-12 | 13F | Gladstone Institutional Advisory LLC | 44 657 | 10,89 | 3 641 | 18,91 | ||||
| 2025-07-30 | 13F | First Interstate Bank | 66 446 | 5 418 | ||||||
| 2025-08-13 | 13F | Jackson Creek Investment Advisors LLC | 8 493 | −0,01 | 1 | |||||
| 2025-08-13 | 13F | Northwestern Mutual Wealth Management Co | 70 246 | 34,90 | 5 728 | 44,66 | ||||
| 2025-07-16 | 13F | Kathmere Capital Management, LLC | 47 290 | 143,12 | 3 856 | 160,72 | ||||
| 2025-07-11 | 13F | Quad-Cities Investment Group, LLC | 4 240 | 5,79 | 346 | 13,49 | ||||
| 2025-08-08 | 13F | Cetera Investment Advisers | 4 341 | −5,53 | 354 | 1,15 | ||||
| 2025-08-12 | 13F | Del-Sette Capital Management, LLC | 0 | −100,00 | 0 | |||||
| 2025-08-07 | 13F | Resources Investment Advisors, LLC. | 338 082 | −8,90 | 27 567 | −2,31 | ||||
| 2025-08-14 | 13F | CoreCap Advisors, LLC | 127 601 | 6,36 | 10 405 | 14,05 | ||||
| 2025-08-14 | 13F | Wells Fargo & Company/mn | 218 967 | 87,20 | 17 855 | 100,74 | ||||
| 2025-08-15 | 13F | Tower Research Capital LLC (TRC) | 26 064 | 2 125 | ||||||
| 2025-07-28 | 13F | Harbour Investments, Inc. | 42 225 | 18,35 | 3 443 | 26,95 | ||||
| 2025-08-12 | 13F | Running Point Capital Advisors, LLC | 10 123 | 0,00 | 825 | 7,28 | ||||
| 2025-07-08 | 13F | Arlington Trust Co LLC | 1 369 | −1,86 | 112 | 4,72 | ||||
| 2025-07-10 | 13F | Wealth Enhancement Advisory Services, Llc | 144 720 | −1,19 | 12 013 | 7,87 | ||||
| 2025-08-11 | 13F | Western Wealth Management, LLC | 4 677 | 381 | ||||||
| 2025-08-01 | 13F | Envestnet Asset Management Inc | 201 006 | 13,27 | 16 390 | 21,47 | ||||
| 2025-07-21 | 13F | Pflug Koory, LLC | 7 795 | 0,01 | 636 | 7,26 | ||||
| 2025-08-12 | 13F | J.w. Cole Advisors, Inc. | 8 417 | 120,74 | 686 | 137,37 | ||||
| 2025-08-14 | 13F | UBS Group AG | 135 707 | 8,58 | 11 066 | 16,42 | ||||
| 2025-08-14 | 13F | Goldman Sachs Group Inc | 31 064 | 0,00 | 2 533 | 7,20 | ||||
| 2025-07-24 | NP | HASAX - Horizon Active Asset Allocation Fund Advisor Class | 186 758 | −4,79 | 14 692 | −5,90 | ||||
| 2025-07-09 | 13F | Lineweaver Wealth Advisors, LLC | 84 961 | 2,70 | 6 928 | 10,06 | ||||
| 2025-07-25 | 13F | Cwm, Llc | 18 091 | −8,56 | 1 | 0,00 | ||||
| 2025-07-29 | 13F | Private Trust Co Na | 133 | 11 | ||||||
| 2025-08-08 | 13F | Pinney & Scofield, Inc. | 317 | 0,63 | 26 | 8,70 | ||||
| 2025-08-14 | 13F | Ameriprise Financial Inc | 296 747 | 0,15 | 24 195 | 7,39 | ||||
| 2025-08-13 | 13F | SageView Advisory Group, LLC | 5 661 | −10,03 | 474 | −0,84 | ||||
| 2025-08-14 | 13F | Guardian Wealth Advisors, Llc / Nc | 294 193 | 8,10 | 23 988 | 15,92 | ||||
| 2025-07-11 | 13F | Afg Fiduciary Services Limited Partnership | 2 642 | 218 | ||||||
| 2025-07-02 | 13F | HBW Advisory Services LLC | 101 | 8 | ||||||
| 2025-08-14 | 13F | EP Wealth Advisors, Inc. | 39 791 | −1,19 | 3 245 | 5,94 | ||||
| 2025-07-30 | 13F | Princeton Global Asset Management LLC | 14 574 | 6,63 | 1 188 | 14,34 | ||||
| 2025-07-10 | 13F | Secure Asset Management, LLC | 21 040 | 1 716 | ||||||
| 2025-08-04 | 13F | Spire Wealth Management | 12 656 | 5,21 | 1 032 | 12,80 | ||||
| 2025-08-13 | 13F | Capital Advisors Wealth Management, LLC | 14 491 | 16,23 | 1 182 | 24,58 | ||||
| 2025-08-14 | 13F | Endurance Services Ltd | 1 140 000 | 0,00 | 92 819 | 7,24 | ||||
| 2025-07-28 | 13F | Ckw Financial Group | 478 789 | 0,43 | 39 | 8,33 | ||||
| 2025-08-14 | 13F | Colony Group, LLC | 4 977 | 406 | ||||||
| 2025-07-25 | 13F | Concord Wealth Partners | 0 | −100,00 | 0 | |||||
| 2025-08-07 | 13F | Panoramic Investment Advisors, Llc | 10 285 | 839 | ||||||
| 2025-08-15 | 13F | Morgan Stanley | 736 446 | 1,63 | 60 050 | 8,98 | ||||
| 2025-08-07 | 13F | Summit X, LLC | 2 700 | 0,00 | 220 | 7,32 | ||||
| 2025-04-15 | 13F | Noble Wealth Management PBC | 38 890 | −10,01 | 2 957 | −11,39 | ||||
| 2025-08-06 | 13F | Black Swift Group, LLC | 133 310 | −26,73 | 10 870 | −21,43 | ||||
| 2025-08-08 | 13F | Bouchey Financial Group Ltd | 3 605 | 0,00 | 294 | 6,93 | ||||
| 2025-08-06 | 13F | O'Dell Group, LLC | 0 | −100,00 | 0 | |||||
| 2025-08-08 | 13F | Firestone Capital Management | 5 358 | 23,77 | 437 | 32,52 | ||||
| 2025-08-14 | 13F/A | Rockefeller Capital Management L.P. | 133 092 | 193,48 | 10 852 | 214,73 | ||||
| 2025-05-15 | 13F/A | Orion Portfolio Solutions, LLC | 6 928 | 3,34 | 527 | 1,74 | ||||
| 2025-08-11 | 13F | FSA Wealth Management LLC | 57 | 5 |