Grundläggande statistik
| Portföljvärde | $ 127 119 303 |
| Aktuella positioner | 78 |
Senaste innehav, resultat, förvaltat kapital (från 13F, 13D)
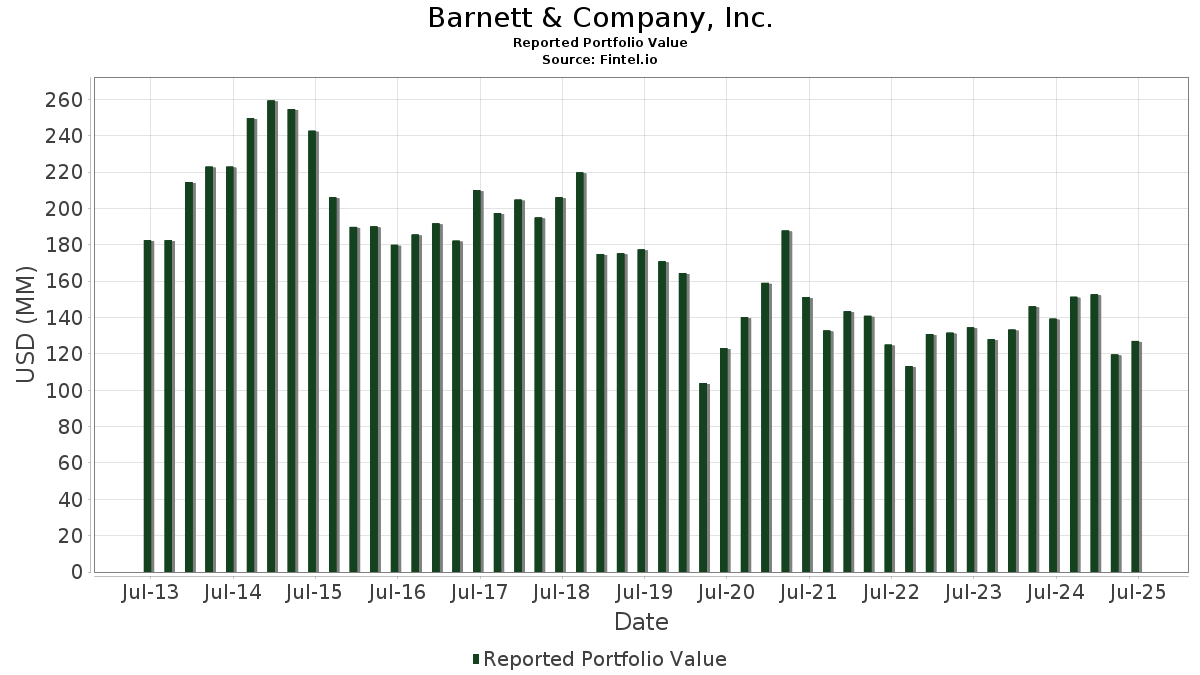
Barnett & Company, Inc. har redovisat 78 totala innehav i sina senaste SEC-arkiveringar. Det senaste portföljvärdet beräknas vara $ 127 119 303 USD. Faktiskt förvaltade tillgångar (AUM) är detta värde plus likvida medel (som inte redovisas). Barnett & Company, Inc.s största innehav är Unum Group (US:UNM) , Federal Agricultural Mortgage Corporation (US:AGM) , The Williams Companies, Inc. (US:WMB) , OneMain Holdings, Inc. (US:OMF) , and Pfizer Inc. (US:PFE) . Barnett & Company, Inc.s nya positioner inkluderar Brookfield Infrastructure Corporation (US:BIPC) , Global Ship Lease, Inc. (US:GSL) , .
Största ökningarna detta kvartal
Vi använder förändringen i portföljallokeringen eftersom det är det mest meningsfulla måttet. Förändringar kan bero på transaktioner eller förändringar i aktiekurser.
| Värdepapper | Aktier (MM) |
Värde (MM$) |
Portfölj % av | ΔPortfölj % av |
|---|---|---|---|---|
| 0,04 | 2,13 | 1,6786 | 1,0742 | |
| 0,03 | 1,14 | 0,8999 | 0,8999 | |
| 0,02 | 0,78 | 0,6121 | 0,6121 | |
| 0,02 | 1,06 | 0,8307 | 0,6042 | |
| 0,12 | 6,63 | 5,2123 | 0,5488 | |
| 0,08 | 0,85 | 0,6669 | 0,5194 | |
| 0,02 | 0,56 | 0,4429 | 0,4429 | |
| 0,10 | 2,12 | 1,6666 | 0,4220 | |
| 0,23 | 3,66 | 2,8756 | 0,4165 | |
| 0,12 | 1,26 | 0,9928 | 0,3618 |
Största minskningarna detta kvartal
Vi använder förändringen i portföljallokeringen eftersom det är det mest meningsfulla måttet. Förändringar kan bero på transaktioner eller förändringar i aktiepriser.
| Värdepapper | Aktier (MM) |
Värde (MM$) |
Portfölj % av | ΔPortfölj % av |
|---|---|---|---|---|
| 0,05 | 4,30 | 3,3788 | −0,9103 | |
| 0,02 | 4,42 | 3,4748 | −0,7102 | |
| 0,01 | 2,65 | 2,0844 | −0,6337 | |
| 0,13 | 10,40 | 8,1817 | −0,6064 | |
| 0,09 | 2,23 | 1,7524 | −0,4238 | |
| 0,02 | 2,03 | 1,5936 | −0,4172 | |
| 0,21 | 5,06 | 3,9779 | −0,3528 | |
| 0,04 | 7,67 | 6,0314 | −0,2714 | |
| 0,04 | 2,27 | 1,7846 | −0,2698 | |
| 0,00 | 0,66 | 0,5188 | −0,2464 |
13F- och fond arkiveringar
Denna blankett lämnades in den 2025-08-14 för rapporteringsperioden 2025-06-30. Klicka på länksymbolen för att se hela transaktionshistoriken.
Uppgradera för att låsa upp premiumdata och exportera till Excel![]() .
.
| Värdepapper | Typ | Genomsnittligt aktiepris | Aktier (MM) |
ΔAktier (%) |
ΔAktier (%) |
Värde ($MM) |
Portfölj (%) |
ΔPortfölj (%) |
|
|---|---|---|---|---|---|---|---|---|---|
| UNM / Unum Group | 0,13 | −0,22 | 10,40 | −1,07 | 8,1817 | −0,6064 | |||
| AGM / Federal Agricultural Mortgage Corporation | 0,04 | −1,87 | 7,67 | 1,68 | 6,0314 | −0,2714 | |||
| WMB / The Williams Companies, Inc. | 0,12 | −1,49 | 7,49 | 3,55 | 5,8929 | −0,1544 | |||
| OMF / OneMain Holdings, Inc. | 0,12 | 1,84 | 6,63 | 18,75 | 5,2123 | 0,5488 | |||
| PFE / Pfizer Inc. | 0,21 | 2,03 | 5,06 | −2,41 | 3,9779 | −0,3528 | |||
| ABBV / AbbVie Inc. | 0,02 | −0,42 | 4,42 | −11,77 | 3,4748 | −0,7102 | |||
| OKE / ONEOK, Inc. | 0,05 | 1,74 | 4,30 | −16,29 | 3,3788 | −0,9103 | |||
| NFG / National Fuel Gas Company | 0,05 | 2,24 | 3,87 | 9,36 | 3,0415 | 0,0866 | |||
| CLMT / Calumet, Inc. | 0,23 | 0,00 | 3,66 | 24,28 | 2,8756 | 0,4165 | |||
| GNRC / Generac Holdings Inc. | 0,02 | 4,01 | 3,25 | 17,63 | 2,5568 | 0,2469 | |||
| SMG / The Scotts Miracle-Gro Company | 0,04 | −0,23 | 2,84 | 19,86 | 2,2371 | 0,2544 | |||
| TMO / Thermo Fisher Scientific Inc. | 0,01 | 0,00 | 2,65 | −18,52 | 2,0844 | −0,6337 | |||
| VICI / VICI Properties Inc. | 0,08 | 10,99 | 2,58 | 10,93 | 2,0280 | 0,0853 | |||
| KR / The Kroger Co. | 0,03 | −5,24 | 2,46 | 0,41 | 1,9373 | −0,1127 | |||
| RTX / RTX Corporation | 0,02 | −1,21 | 2,39 | 8,87 | 1,8833 | 0,0459 | |||
| SUN / Sunoco LP - Limited Partnership | 0,04 | 0,00 | 2,27 | −7,69 | 1,7846 | −0,2698 | |||
| PLYM / Plymouth Industrial REIT, Inc. | 0,14 | 27,90 | 2,25 | 26,08 | 1,7724 | 0,2779 | |||
| HPQ / HP Inc. | 0,09 | −3,14 | 2,23 | −14,44 | 1,7524 | −0,4238 | |||
| PZZA / Papa John's International, Inc. | 0,04 | 147,73 | 2,13 | 195,02 | 1,6786 | 1,0742 | |||
| HPE / Hewlett Packard Enterprise Company | 0,10 | 7,36 | 2,12 | 42,34 | 1,6666 | 0,4220 | |||
| AM / Antero Midstream Corporation | 0,11 | 14,43 | 2,09 | 20,48 | 1,6428 | 0,1939 | |||
| MPLX / MPLX LP - Limited Partnership | 0,04 | −0,60 | 2,05 | −4,34 | 1,6146 | −0,1787 | |||
| COP / ConocoPhillips | 0,02 | −1,45 | 2,03 | −15,80 | 1,5936 | −0,4172 | |||
| OBDC / Blue Owl Capital Corporation | 0,14 | 14,86 | 1,98 | 12,39 | 1,5562 | 0,0845 | |||
| BXSL / Blackstone Secured Lending Fund | 0,06 | 1,49 | 1,97 | −3,57 | 1,5526 | −0,1580 | |||
| FMC / FMC Corporation | 0,05 | 21,12 | 1,94 | 19,84 | 1,5257 | 0,1731 | |||
| ALLY / Ally Financial Inc. | 0,04 | 9,11 | 1,73 | 16,55 | 1,3574 | 0,1197 | |||
| FUN / Six Flags Entertainment Corporation | 0,05 | 3,58 | 1,40 | −11,64 | 1,1051 | −0,2237 | |||
| ALK / Alaska Air Group, Inc. | 0,03 | −10,89 | 1,40 | −10,46 | 1,0987 | −0,2045 | |||
| MATV / Mativ Holdings, Inc. | 0,19 | 7,60 | 1,32 | 17,78 | 1,0374 | 0,1016 | |||
| GT / The Goodyear Tire & Rubber Company | 0,12 | 48,96 | 1,26 | 67,37 | 0,9928 | 0,3618 | |||
| UNP / Union Pacific Corporation | 0,01 | 0,00 | 1,23 | −2,61 | 0,9671 | −0,0880 | |||
| BIPC / Brookfield Infrastructure Corporation | 0,03 | 1,14 | 0,8999 | 0,8999 | |||||
| CNI / Canadian National Railway Company | 0,01 | 0,00 | 1,08 | 6,80 | 0,8530 | 0,0040 | |||
| ODC / Oil-Dri Corporation of America | 0,02 | 203,39 | 1,06 | 290,74 | 0,8307 | 0,6042 | |||
| CCI / Crown Castle Inc. | 0,01 | 1,34 | 0,97 | −0,21 | 0,7661 | −0,0489 | |||
| MLI / Mueller Industries, Inc. | 0,01 | 0,00 | 0,93 | 4,39 | 0,7299 | −0,0131 | |||
| WAB / Westinghouse Air Brake Technologies Corporation | 0,00 | 0,00 | 0,92 | 15,37 | 0,7212 | 0,0574 | |||
| AR / Antero Resources Corporation | 0,02 | −16,08 | 0,91 | −16,38 | 0,7193 | −0,1951 | |||
| LH / Labcorp Holdings Inc. | 0,00 | 0,00 | 0,88 | 12,79 | 0,6939 | 0,0402 | |||
| TSLX / Sixth Street Specialty Lending, Inc. | 0,04 | 22,30 | 0,88 | 30,21 | 0,6883 | 0,1262 | |||
| PBI / Pitney Bowes Inc. | 0,08 | 298,46 | 0,85 | 381,25 | 0,6669 | 0,5194 | |||
| CSX / CSX Corporation | 0,03 | 57,89 | 0,85 | 75,31 | 0,6651 | 0,2614 | |||
| IWD / iShares Trust - iShares Russell 1000 Value ETF | 0,00 | −0,68 | 0,82 | 2,49 | 0,6480 | −0,0236 | |||
| SCHD / Schwab Strategic Trust - Schwab U.S. Dividend Equity ETF | 0,03 | −1,91 | 0,82 | −7,04 | 0,6449 | −0,0921 | |||
| BMY / Bristol-Myers Squibb Company | 0,02 | 0,78 | 0,6121 | 0,6121 | |||||
| BKH / Black Hills Corporation | 0,01 | 64,29 | 0,77 | 52,06 | 0,6090 | 0,1832 | |||
| UHAL / U-Haul Holding Company | 0,01 | −5,45 | 0,74 | −12,40 | 0,5788 | −0,1232 | |||
| IWF / iShares Trust - iShares Russell 1000 Growth ETF | 0,00 | −1,03 | 0,73 | 16,51 | 0,5775 | 0,0502 | |||
| BRK.A / Berkshire Hathaway Inc. | 0,00 | 0,00 | 0,73 | −8,77 | 0,5733 | −0,0941 | |||
| AAPL / Apple Inc. | 0,00 | −22,00 | 0,66 | −27,98 | 0,5188 | −0,2464 | |||
| DE / Deere & Company | 0,00 | 0,00 | 0,63 | 8,43 | 0,4960 | 0,0095 | |||
| INTC / Intel Corporation | 0,03 | 53,93 | 0,61 | 51,75 | 0,4778 | 0,1434 | |||
| GSL / Global Ship Lease, Inc. | 0,02 | 0,56 | 0,4429 | 0,4429 | |||||
| GSEW / Goldman Sachs ETF Trust - Goldman Sachs Equal Weight U.S. Large Cap Equity ETF | 0,01 | 4,70 | 0,55 | 12,47 | 0,4327 | 0,0232 | |||
| TT / Trane Technologies plc | 0,00 | 0,00 | 0,52 | 29,97 | 0,4060 | 0,0737 | |||
| KNTK / Kinetik Holdings Inc. | 0,01 | 9,28 | 0,51 | −7,34 | 0,3980 | −0,0583 | |||
| BLDR / Builders FirstSource, Inc. | 0,00 | −8,01 | 0,50 | −14,19 | 0,3955 | −0,0936 | |||
| GOOGL / Alphabet Inc. | 0,00 | 9,28 | 0,49 | 24,56 | 0,3871 | 0,0568 | |||
| GOOG / Alphabet Inc. | 0,00 | −4,56 | 0,37 | 8,48 | 0,2923 | 0,0057 | |||
| VIG / Vanguard Specialized Funds - Vanguard Dividend Appreciation ETF | 0,00 | −0,11 | 0,37 | 5,46 | 0,2892 | −0,0024 | |||
| CP / Canadian Pacific Kansas City Limited | 0,00 | 0,00 | 0,36 | 12,93 | 0,2822 | 0,0166 | |||
| CCAP / Crescent Capital BDC, Inc. | 0,02 | 35,84 | 0,33 | 11,82 | 0,2607 | 0,0131 | |||
| TSLA / Tesla, Inc. | 0,00 | 0,31 | 0,2466 | 0,2466 | |||||
| MOAT / VanEck ETF Trust - VanEck Morningstar Wide Moat ETF | 0,00 | −3,39 | 0,30 | 3,05 | 0,2395 | −0,0077 | |||
| LCII / LCI Industries | 0,00 | 0,00 | 0,30 | 4,20 | 0,2351 | −0,0044 | |||
| SO / The Southern Company | 0,00 | 0,00 | 0,28 | −0,36 | 0,2209 | −0,0141 | |||
| RSPA / Invesco S&P 500 Equal Weight Income Advantage ETF | 0,01 | 25,83 | 0,27 | 27,70 | 0,2147 | 0,0359 | |||
| SPY / SPDR S&P 500 ETF | 0,00 | 0,00 | 0,26 | 10,68 | 0,2041 | 0,0078 | |||
| MGPI / MGP Ingredients, Inc. | 0,01 | 0,00 | 0,24 | 2,12 | 0,1898 | −0,0079 | |||
| CARR / Carrier Global Corporation | 0,00 | 0,00 | 0,23 | 15,84 | 0,1842 | 0,0147 | |||
| GLDM / World Gold Trust - SPDR Gold MiniShares Trust | 0,00 | −0,31 | 0,23 | 5,43 | 0,1835 | −0,0012 | |||
| MSFT / Microsoft Corporation | 0,00 | 0,23 | 0,1820 | 0,1820 | |||||
| HRB / H&R Block, Inc. | 0,00 | 0,00 | 0,23 | 0,00 | 0,1779 | −0,0112 | |||
| WES / Western Midstream Partners, LP - Limited Partnership | 0,01 | 0,00 | 0,22 | −5,58 | 0,1735 | −0,0216 | |||
| SPHQ / Invesco Exchange-Traded Fund Trust - Invesco S&P 500 Quality ETF | 0,00 | −2,31 | 0,22 | 4,76 | 0,1734 | −0,0022 | |||
| BRK.B / Berkshire Hathaway Inc. | 0,00 | 0,21 | 0,1655 | 0,1655 | |||||
| FCG / First Trust Exchange-Traded Fund - First Trust Natural Gas ETF | 0,01 | 0,00 | 0,20 | −6,88 | 0,1597 | −0,0228 | |||
| FTXP / Foothills Exploration, Inc. | 0,00 | −100,00 | 0,00 | 0,0000 | |||||
| WBA / Walgreens Boots Alliance, Inc. | 0,00 | −100,00 | 0,00 | 0,0000 | |||||
| XLV / The Select Sector SPDR Trust - The Health Care Select Sector SPDR Fund | 0,00 | −100,00 | 0,00 | 0,0000 | |||||
| CSCO / Cisco Systems, Inc. | 0,00 | −100,00 | 0,00 | 0,0000 | |||||
| CCK / Crown Holdings, Inc. | 0,00 | −100,00 | 0,00 | 0,0000 | |||||
| ON / ON Semiconductor Corporation | 0,00 | −100,00 | 0,00 | 0,0000 | |||||
| TEX / Terex Corporation | 0,00 | −100,00 | 0,00 | 0,0000 | |||||
| NTB / The Bank of N.T. Butterfield & Son Limited | 0,00 | −100,00 | 0,00 | 0,0000 |