Grundläggande statistik
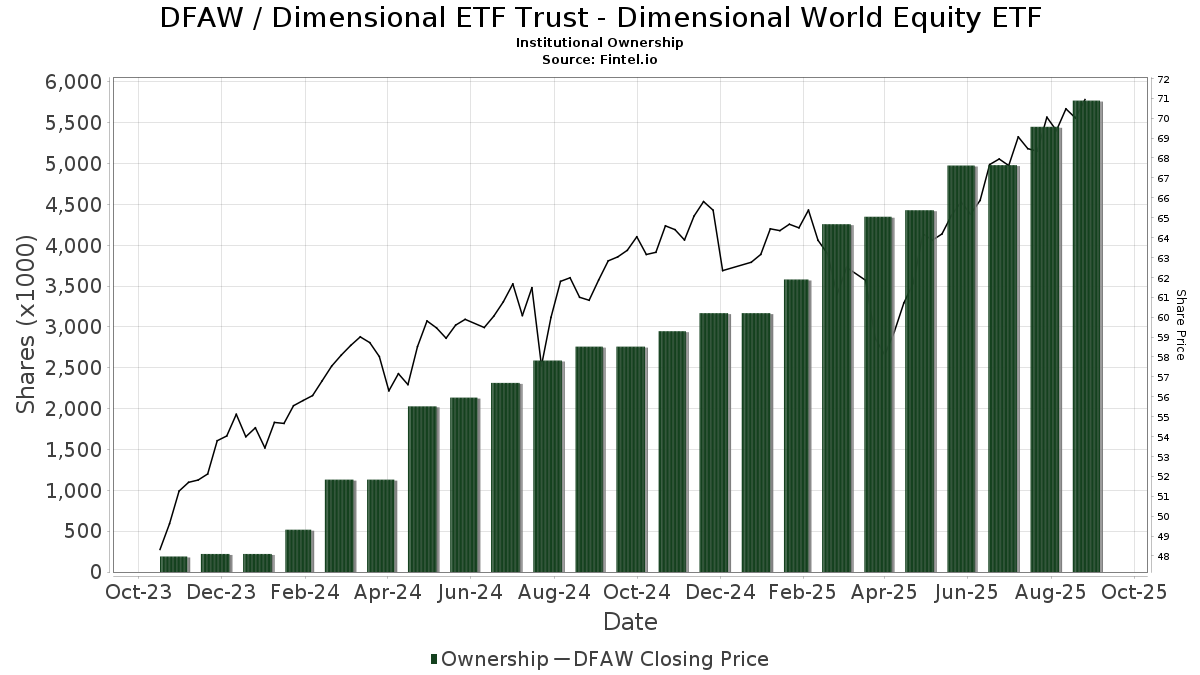
| Institutionella ägare | 151 total, 151 long only, 0 short only, 0 long/short - change of 8,63% MRQ |
| Genomsnittlig portföljallokering | 0.5003 % - change of −2,76% MRQ |
| Institutionella aktier (lång) | 5 771 960 (ex 13D/G) - change of 0,79MM shares 15,89% MRQ |
| Institutionellt värde (lång) | $ 377 694 USD ($1000) |
Institutionellt ägande och aktieägare
Dimensional ETF Trust - Dimensional World Equity ETF (US:DFAW) har 151 Institutionella ägare och aktieägare som har lämnat in 13D/G- eller 13F-formulär till Securities Exchange Commission (SEC). Dessa institut innehar totalt 5,771,960 aktier. Största aktieägare inkluderar First Pacific Financial, Arlington Financial Advisors, LLC, Wealth Management Nebraska, DiNuzzo Private Wealth, Inc., Strategic Investment Solutions, Inc. /IL, Abacus Planning Group, Inc., Fundamentun, Llc, Keyes, Stange & Wooten Wealth Management, LLC, Bryant Woods Investment Advisors, LLC, and Sivia Capital Partners, LLC .
Dimensional ETF Trust - Dimensional World Equity ETF (ARCA:DFAW) Institutionell ägarstruktur visar institutioners och fonders nuvarande positioner i företaget, samt de senaste förändringarna i positionernas storlek. Större aktieägare kan vara enskilda investerare, fonder, hedgefonder eller institutioner. Bilaga 13D visar att investeraren äger (eller ägde) mer än 5% av företaget och avser (eller avsåg) att aktivt eftersträva en förändring av affärsstrategin. Schedule 13G indikerar en passiv investering på över 5%.
The share price as of September 15, 2025 is 71,71 / share. Previously, on September 16, 2024, the share price was 62,10 / share. This represents an increase of 15,48% over that period.
Fondsentimentets poäng
Fondsentimentet poängen(fka Ägarackumulation-poäng) visar vilka aktier som är mest köpta av fonder. Det är resultatet av en sofistikerad kvantitativ flerfaktormodell som identifierar företag med de högsta nivåerna av institutionell ackumulering. Poängsättningsmodellen använder en kombination av den totala ökningen av redovisade ägare, förändringarna i portföljallokeringarna för dessa ägare och andra mått. Siffran sträcker sig från 0 till 100, där högre siffror indikerar en högre nivå av ackumulering i förhållande till sina konkurrenter, och 50 är genomsnittet.
Uppdateringsfrekvens: Dagligen
Se Ownership Explorer, som innehåller en lista över de högst rankade företagen.
Institutionell sälj/köp-kvot
Förutom att rapportera vanliga eget kapital- och skuldemissioner måste institutioner med mer än 100MM tillgångar under förvaltning också avslöja sina innehav av sälj- och köpoptioner. Eftersom säljoptioner i allmänhet indikerar ett negativt sentiment och köpoptioner indikerar ett positivt sentiment, kan vi få en uppfattning om det övergripande institutionella sentimentet genom att plotta förhållandet mellan säljoptioner och köpoptioner. Diagrammet till höger visar det historiska förhållandet mellan sälj- och köpoptioner för detta instrument.
Genom att använda sälj/köp-kvoten som en indikator på aktieägarnas sentiment undviker man en av de största bristerna med att använda det totala institutionella ägandet, nämligen att en betydande del av de förvaltade tillgångarna investeras passivt för att följa index. Passivt förvaltade fonder köper vanligtvis inte optioner, så indikatorn för sälj/köp-kvoten ger en bättre bild av stämningen i aktivt förvaltade fonder.
13F- och NPORT-arkiveringar
Detaljer om 13F-arkiveringar är gratis. Detaljer om NP-arkiveringar kräver ett premiummedlemskap. Gröna rader indikerar nya positioner. Röda rader indikerar stängda positioner. Klicka på länk symbolen för att se hela transaktionshistoriken.
Uppgradera
för att låsa upp premiumdata och exportera till Excel ![]() .
.
| Fil Datum | Källa | Investerare | Typ | Genomsnittligt pris (beräknat) |
Aktier | Δ Aktier (%) |
Rapporterat värde (1000 USD) |
Δ Värde (%) |
Portföljallokering (%) |
|
|---|---|---|---|---|---|---|---|---|---|---|
| 2025-07-30 | 13F | Phillips Financial Management, Llc | 6 555 | −7,26 | 440 | 1,39 | ||||
| 2025-09-04 | 13F/A | Advisor Group Holdings, Inc. | 2 388 | 121,73 | 160 | 146,15 | ||||
| 2025-07-17 | 13F | Barry Investment Advisors, LLC | 28 958 | 11,29 | 1 943 | 21,83 | ||||
| 2025-07-14 | 13F | Parkshore Wealth Management, Inc. | 28 059 | 3,74 | 1 882 | 13,58 | ||||
| 2025-07-31 | 13F | Cambridge Investment Research Advisors, Inc. | 0 | −100,00 | 0 | |||||
| 2025-07-31 | 13F | Buckingham Strategic Partners | 4 555 | 306 | ||||||
| 2025-08-19 | 13F | Advisory Services Network, LLC | 4 806 | 327 | ||||||
| 2025-07-17 | 13F | SC&H Financial Advisors, Inc. | 37 196 | 52,26 | 2 495 | 66,78 | ||||
| 2025-07-24 | 13F | Ronald Blue Trust, Inc. | 11 469 | 35,39 | 769 | 48,17 | ||||
| 2025-07-31 | 13F | Brighton Jones Llc | 4 407 | 33,75 | 296 | 46,77 | ||||
| 2025-07-31 | 13F | Aspen Capital Management, LLC | 13 320 | 11,19 | 893 | 21,66 | ||||
| 2025-08-01 | 13F | Envestnet Asset Management Inc | 6 912 | 21,43 | 464 | 33,05 | ||||
| 2025-08-14 | 13F | Wells Fargo & Company/mn | 0 | −100,00 | 0 | |||||
| 2025-08-07 | 13F | Allworth Financial LP | 250 | 0,00 | 17 | 6,67 | ||||
| 2025-07-25 | 13F | Cwm, Llc | 1 135 | 0 | ||||||
| 2025-08-01 | 13F | Ashton Thomas Private Wealth, LLC | 4 759 | 319 | ||||||
| 2025-07-29 | 13F | AssuredPartners Investment Advisors, LLC | 25 833 | 9,16 | 1 733 | 19,45 | ||||
| 2025-07-09 | 13F | HFG Wealth Management, LLC | 119 203 | −9,08 | 7 305 | −10,81 | ||||
| 2025-07-15 | 13F | Cordant, Inc. | 2 | 100,00 | 0 | |||||
| 2025-07-09 | 13F | Shore Point Advisors, LLC | 10 023 | 35,98 | 672 | 49,00 | ||||
| 2025-07-23 | 13F | Wealth Management Nebraska | 487 566 | 22,13 | 32 574 | 33,15 | ||||
| 2025-07-25 | 13F | Investment Advisory Group, LLC | 4 141 | 0,02 | 278 | 9,49 | ||||
| 2025-07-21 | 13F | Quent Capital, LLC | 0 | −100,00 | 0 | |||||
| 2025-07-28 | 13F | Mutual Advisors, LLC | 4 588 | −11,97 | 317 | 0,64 | ||||
| 2025-07-09 | 13F | Krilogy Financial LLC | 33 474 | 0,75 | 2 245 | 10,32 | ||||
| 2025-07-10 | 13F | Strathmore Capital Advisors, Inc. | 57 586 | 639,80 | 3 913 | 704,94 | ||||
| 2025-07-11 | 13F | Farther Finance Advisors, LLC | 1 366 | −20,12 | 92 | −13,33 | ||||
| 2025-07-03 | 13F | Fiduciary Financial Group, Llc | 14 827 | 15,27 | 998 | 35,97 | ||||
| 2025-07-14 | 13F | Maryland Capital Advisors Inc. | 146 | 10 | ||||||
| 2025-07-17 | 13F | Vermillion Wealth Management, Inc. | 430 | −12,60 | 29 | −6,67 | ||||
| 2025-08-14 | 13F | Mercer Global Advisors Inc /adv | 3 722 | −91,69 | 250 | −90,93 | ||||
| 2025-07-15 | 13F | Bannerman Wealth Management Group, Llc | 7 991 | 536 | ||||||
| 2025-08-11 | 13F | Babb Wealth Advisors LLC | 26 743 | −14,35 | 1 794 | −6,27 | ||||
| 2025-08-05 | 13F | Mission Wealth Management, Lp | 3 999 | 268 | ||||||
| 2025-07-18 | 13F | PBMares Wealth Management LLC | 6 941 | 14,77 | 466 | 25,68 | ||||
| 2025-08-12 | 13F | Pathstone Holdings, LLC | 3 110 | 209 | ||||||
| 2025-08-12 | 13F | Proequities, Inc. | 0 | 0 | ||||||
| 2025-07-16 | 13F | Jentner Corp | 7 987 | 1,69 | 536 | 11,23 | ||||
| 2025-08-11 | 13F | HighTower Advisors, LLC | 19 060 | 1 279 | ||||||
| 2025-08-14 | 13F | Jane Street Group, Llc | 22 265 | 63,53 | 1 494 | 79,02 | ||||
| 2025-07-16 | 13F | Vestia Personal Wealth Advisors | 18 398 | 55,70 | 1 234 | 70,44 | ||||
| 2025-07-15 | 13F | SJS Investment Consulting Inc. | 1 071 | 9,85 | 72 | 20,34 | ||||
| 2025-08-14 | 13F | Betterment LLC | 17 549 | 86,18 | 1 | |||||
| 2025-07-22 | 13F | Belpointe Asset Management LLC | 8 113 | 1,93 | 544 | 11,70 | ||||
| 2025-07-09 | 13F | GEM Asset Management, LLC | 4 792 | 25,05 | 323 | 37,45 | ||||
| 2025-07-15 | 13F | Fifth Third Bancorp | 0 | −100,00 | 0 | |||||
| 2025-07-18 | 13F | Parkwoods Wealth Partners, LLC | 17 759 | 36,70 | 1 191 | 49,62 | ||||
| 2025-08-12 | 13F | Jpmorgan Chase & Co | 81 717 | 100 785,19 | 5 482 | 136 925,00 | ||||
| 2025-05-02 | 13F | MB Generational Wealth, LLC | 19 463 | 22,27 | 1 193 | 19,92 | ||||
| 2025-08-14 | 13F | Citadel Advisors Llc | 0 | −100,00 | 0 | |||||
| 2025-07-24 | 13F | Us Bancorp \de\ | 163 | 11 | ||||||
| 2025-08-08 | 13F | Creative Planning | 5 162 | 346 | ||||||
| 2025-08-13 | 13F | Townsquare Capital Llc | 0 | −100,00 | 0 | |||||
| 2025-07-17 | 13F | Mustard Seed Financial, LLC | 10 486 | 40,88 | 703 | 54,17 | ||||
| 2025-07-30 | 13F | Rehmann Capital Advisory Group | 3 190 | −2,98 | 214 | 5,97 | ||||
| 2025-07-23 | 13F | Pillar Financial Advisors, LLC | 3 851 | 7,66 | 258 | 17,81 | ||||
| 2025-08-15 | 13F | CI Private Wealth, LLC | 0 | −100,00 | 0 | |||||
| 2025-07-18 | 13F | First Pacific Financial | 621 634 | 14,74 | 41 699 | 25,60 | ||||
| 2025-08-08 | 13F | Royal Harbor Partners, LLC | 102 632 | 6 885 | ||||||
| 2025-08-14 | 13F | Monograph Wealth Advisors, Llc | 14 579 | 15,67 | 978 | 26,55 | ||||
| 2025-07-28 | 13F | Morris Financial Concepts, Inc. | 406 | 78,85 | 27 | 107,69 | ||||
| 2025-07-25 | 13F | LRI Investments, LLC | 418 | 28 | ||||||
| 2025-08-14 | 13F | Beaird Harris Wealth Management, LLC | 278 | 19 | ||||||
| 2025-07-18 | 13F | Fmb Wealth Management | 6 531 | 27,29 | 438 | 39,49 | ||||
| 2025-07-25 | 13F | Ruedi Wealth Management, Inc. | 12 282 | −13,30 | 824 | −5,18 | ||||
| 2025-08-07 | 13F | Fonville Wealth Management LLC | 3 812 | 0,26 | 256 | 9,91 | ||||
| 2025-08-14 | 13F | Envision Financial Planning, LLC | 9 302 | 126,22 | 624 | 147,22 | ||||
| 2025-04-14 | 13F | Greenspring Advisors, LLC | 4 030 | 0,00 | 247 | −1,99 | ||||
| 2025-07-15 | 13F | Maseco Llp | 133 950 | 8 979 | ||||||
| 2025-08-04 | 13F | Syverson Strege & Co | 36 836 | 1,78 | 2 471 | 11,41 | ||||
| 2025-07-29 | 13F | Stratos Wealth Partners, LTD. | 6 417 | 431 | ||||||
| 2025-07-16 | 13F | Blue Oak Capital, LLC | 4 220 | −1,10 | 283 | 8,43 | ||||
| 2025-08-13 | 13F | American Investment Services, Inc. | 102 722 | −1,70 | 6 891 | 7,61 | ||||
| 2025-07-29 | 13F | Fundamentun, Llc | 188 794 | 50,99 | 12 664 | 65,28 | ||||
| 2025-07-17 | 13F | Porter White Investment Advisors, Inc. | 3 330 | 0,39 | 223 | 9,85 | ||||
| 2025-07-29 | 13F | Riverbend Wealth Management, LLC | 12 098 | 6,49 | 812 | 16,52 | ||||
| 2025-07-15 | 13F | Evanson Asset Management, LLC | 62 525 | 7,62 | 4 194 | 17,81 | ||||
| 2025-08-14 | 13F | DecisionPoint Financial, LLC | 6 732 | 13,52 | 453 | 24,79 | ||||
| 2025-07-10 | 13F | Wealth Enhancement Advisory Services, Llc | 0 | −100,00 | 0 | |||||
| 2025-08-04 | 13F | Waterfront Wealth Inc. | 8 597 | 104,98 | 577 | 124,12 | ||||
| 2025-08-05 | 13F | Bank Of Montreal /can/ | 12 982 | −1,61 | 871 | 7,67 | ||||
| 2025-08-08 | 13F | Tortoise Investment Management, LLC | 13 | 0,00 | 1 | |||||
| 2025-08-07 | 13F | Tilson Financial Group, Inc. | 4 923 | 6,88 | 0 | |||||
| 2025-07-31 | 13F | Curio Wealth, Llc | 1 327 | 44 133,33 | 89 | −5,38 | ||||
| 2025-04-17 | 13F | Vista Wealth Management Group, LLC | 4 236 | 18,32 | 260 | 16,14 | ||||
| 2025-07-16 | 13F | Builder Investment Group Inc /adv | 62 398 | 2,60 | 4 186 | 12,32 | ||||
| 2025-07-15 | 13F | Mather Group, Llc. | 43 826 | 0,06 | 2 940 | 9,50 | ||||
| 2025-07-31 | 13F | Glass Jacobson Investment Advisors llc | 487 | 0,21 | 33 | 6,67 | ||||
| 2025-08-14 | 13F | Mariner, LLC | 0 | −100,00 | 0 | |||||
| 2025-07-28 | 13F | Arlington Financial Advisors, LLC | 583 061 | 10,87 | 39 112 | 21,36 | ||||
| 2025-04-18 | 13F | JP Wealth Management, Inc. | 0 | −100,00 | 0 | |||||
| 2025-07-16 | 13F | TCI Wealth Advisors, Inc. | 61 721 | 61,94 | 4 140 | 77,30 | ||||
| 2025-07-16 | 13F | Strategic Investment Solutions, Inc. /IL | 220 243 | −32,63 | 14 818 | −26,07 | ||||
| 2025-07-17 | 13F | Smith Anglin Financial, LLC | 3 639 | 0,55 | 244 | 10,41 | ||||
| 2025-07-16 | 13F | BOS Asset Management, LLC | 4 865 | 13,06 | 326 | 23,95 | ||||
| 2025-08-06 | 13F | Modera Wealth Management, LLC | 5 279 | 354 | ||||||
| 2025-07-25 | 13F | Concord Wealth Partners | 1 543 | 0,59 | 103 | 9,57 | ||||
| 2025-08-13 | 13F | Beacon Pointe Advisors, LLC | 9 544 | 4,08 | 640 | 14,08 | ||||
| 2025-08-25 | 13F/A | Promus Capital, LLC | 485 | 0,62 | 33 | 10,34 | ||||
| 2025-07-29 | 13F | Chicago Partners Investment Group LLC | 17 314 | 61,66 | 1 196 | 81,06 | ||||
| 2025-07-03 | 13F | Lam Group, Inc. | 3 492 | 0,23 | 234 | 9,86 | ||||
| 2025-08-13 | 13F | Annandale Capital, LLC | 6 785 | 78,88 | 0 | |||||
| 2025-07-16 | 13F | Plancorp, LLC | 48 200 | 34,63 | 3 233 | 47,42 | ||||
| 2025-08-13 | 13F | Cary Street Partners Financial Llc | 11 054 | 48,44 | 741 | 62,50 | ||||
| 2025-07-10 | 13F | Pacific Asset Management, LLC | 10 709 | 0,68 | 718 | 10,29 | ||||
| 2025-07-15 | 13F | Hippocratic Financial Advisors, LLC | 8 043 | 7,54 | 540 | 17,69 | ||||
| 2025-08-11 | 13F | Mosaic Family Wealth Partners, Llc | 20 142 | 9,25 | 1 351 | 19,66 | ||||
| 2025-08-14 | 13F | Cardiff Park Advisors, Llc | 18 443 | 0,55 | 1 237 | 10,05 | ||||
| 2025-08-06 | 13F | Savant Capital, LLC | 4 652 | 20,18 | 312 | 31,65 | ||||
| 2025-07-08 | 13F | Apella Capital, LLC | 98 127 | 11,65 | 6 618 | 27,74 | ||||
| 2025-08-14 | 13F | McIlrath & Eck, LLC | 809 | 15,90 | 54 | 28,57 | ||||
| 2025-08-11 | 13F | Compass Capital Corp /ma/ /adv | 0 | −100,00 | 0 | |||||
| 2025-08-14 | 13F | Visionary Wealth Advisors | 6 491 | 80,71 | 435 | 97,73 | ||||
| 2025-08-14 | 13F | Raymond James Financial Inc | 24 224 | −48,39 | 1 625 | −43,53 | ||||
| 2025-07-15 | 13F | Verum Partners LLC | 7 112 | 477 | ||||||
| 2025-08-12 | 13F | LPL Financial LLC | 49 250 | −10,74 | 3 304 | −2,31 | ||||
| 2025-08-12 | 13F | Nemes Rush Group LLC | 11 274 | 44,69 | 756 | 58,49 | ||||
| 2025-08-14 | 13F | Safeguard Investment Advisory Group, LLC | 3 070 | −24,77 | 206 | −18,00 | ||||
| 2025-08-04 | 13F | Savvy Advisors, Inc. | 6 947 | 49,11 | 466 | 63,51 | ||||
| 2025-07-21 | 13F | Keystone Financial Group, Inc. | 14 404 | 7,39 | 979 | 18,38 | ||||
| 2025-07-11 | 13F | Sprinkle Financial Consultants LLC | 43 922 | 14,81 | 2 946 | 25,68 | ||||
| 2025-08-04 | 13F | McMill Wealth Management | 122 525 | 19,66 | 8 192 | 30,57 | ||||
| 2025-08-13 | 13F | EverSource Wealth Advisors, LLC | 8 099 | −0,64 | 543 | 8,82 | ||||
| 2025-08-19 | 13F | Asset Dedication, LLC | 1 356 | 27,44 | 91 | 38,46 | ||||
| 2025-07-21 | 13F | Crews Bank & Trust | 1 265 | 0,00 | 85 | 9,09 | ||||
| 2025-07-15 | 13F | BKA Wealth Consulting, Inc. | 6 173 | 18,92 | 414 | 30,19 | ||||
| 2025-07-15 | 13F | Total Wealth Planning, Llc | 9 803 | −10,78 | 658 | −2,38 | ||||
| 2025-07-23 | 13F | Prime Capital Investment Advisors, LLC | 0 | −100,00 | 0 | |||||
| 2025-08-12 | 13F | Triune Financial Partners, LLC | 146 493 | 723,78 | 9 827 | 802,30 | ||||
| 2025-08-14 | 13F | Aqr Capital Management Llc | 20 240 | 0,00 | 1 358 | 9,44 | ||||
| 2025-07-14 | 13F | Foster Group, Inc. | 15 275 | 14,36 | 1 025 | 25,18 | ||||
| 2025-07-17 | 13F | DiNuzzo Private Wealth, Inc. | 246 172 | −2,78 | 16 513 | 6,42 | ||||
| 2025-08-15 | 13F | Morgan Stanley | 746 | −4,97 | 50 | 4,17 | ||||
| 2025-07-24 | 13F | Jfs Wealth Advisors, Llc | 6 531 | 18,21 | 438 | 29,59 | ||||
| 2025-07-30 | 13F | Mills Wealth Advisors LLC | 9 157 | 24,77 | 614 | 36,75 | ||||
| 2025-07-22 | 13F | Berger Financial Group, Inc | 35 440 | 41,44 | 2 377 | 54,85 | ||||
| 2025-08-06 | 13F | Cloud Capital Management, LLC | 0 | −100,00 | 0 | |||||
| 2025-07-24 | 13F | Bryant Woods Investment Advisors, LLC | 155 007 | 7,59 | 10 398 | 17,77 | ||||
| 2025-07-31 | 13F | Warburton Capital Management, LLC | 30 884 | 11,09 | 2 | 100,00 | ||||
| 2025-07-14 | 13F | UMA Financial Services, Inc. | 147 043 | 0,56 | 9 864 | 10,08 | ||||
| 2025-08-14 | 13F | Sterling Wealth Management, Inc. | 17 988 | 35,02 | 1 207 | 44,95 | ||||
| 2025-07-23 | 13F | Austin Asset Management Co Inc | 9 422 | 2,05 | 632 | 11,86 | ||||
| 2025-08-11 | 13F | Root Financial Partners, LLC | 6 686 | −4,34 | 448 | 4,67 | ||||
| 2025-07-16 | 13F | Spinnaker Investment Group, LLC | 24 179 | −26,15 | 1 622 | −19,19 | ||||
| 2025-08-14 | 13F | Colony Group, LLC | 35 388 | 53,10 | 2 374 | 67,58 | ||||
| 2025-08-07 | 13F | Alpha Financial Advisors, LLC | 4 799 | −16,23 | 322 | −8,55 | ||||
| 2025-07-15 | 13F | Highland Financial Advisors, LLC | 12 587 | 844 | ||||||
| 2025-08-14 | 13F | Federation des caisses Desjardins du Quebec | 4 155 | 35,43 | 278 | 47,87 | ||||
| 2025-04-21 | 13F | Nelson, Van Denburg & Campbell Wealth Management Group, LLC | 0 | −100,00 | 0 | |||||
| 2025-05-12 | 13F | Summit Financial Strategies, Inc. | 0 | −100,00 | 0 | −100,00 | ||||
| 2025-08-08 | 13F | RAM Investment Partners, LLC | 6 824 | −5,05 | 458 | 3,86 | ||||
| 2025-07-08 | 13F | Zrc Wealth Management, Llc | 83 | 6 | ||||||
| 2025-07-23 | 13F | Elevate Wealth Advisory, Inc | 3 688 | 98,60 | 247 | 118,58 | ||||
| 2025-08-06 | 13F | Commonwealth Equity Services, Llc | 61 429 | 15,87 | 4 | 33,33 | ||||
| 2025-08-07 | 13F | Prudent Man Investment Management, Inc. | 30 627 | 0,00 | 1 913 | 0,00 | ||||
| 2025-08-14 | 13F | C M Bidwell & Associates Ltd | 2 653 | 0,00 | 178 | 9,26 | ||||
| 2025-08-14 | 13F | Royal Bank Of Canada | 290 | 19 | ||||||
| 2025-08-14 | 13F | Main Street Financial Solutions, LLC | 47 782 | 12,89 | 3 205 | 23,60 | ||||
| 2025-04-17 | 13F | Rs Crum Inc. | 7 789 | −11,00 | 477 | −12,64 | ||||
| 2025-07-16 | 13F | Falcon Wealth Planning | 11 837 | 3,83 | 794 | 13,75 | ||||
| 2025-07-21 | 13F/A | Abacus Planning Group, Inc. | 217 521 | 1,45 | 14 591 | 11,05 | ||||
| 2025-08-11 | 13F | Keyes, Stange & Wooten Wealth Management, LLC | 159 219 | −1,15 | 10 680 | 8,21 | ||||
| 2025-08-12 | 13F | Coston, McIsaac & Partners | 2 798 | 4,17 | 0 | |||||
| 2025-08-01 | 13F | Red Lighthouse Investment Management, Llc | 1 077 | 99,44 | 72 | 132,26 | ||||
| 2025-08-08 | 13F | Pinney & Scofield, Inc. | 446 | 20,87 | 30 | 31,82 | ||||
| 2025-07-09 | 13F | Sivia Capital Partners, LLC | 152 823 | 5,94 | 10 251 | 15,97 | ||||
| 2025-07-21 | 13F | Keb Asset Management, Llc | 3 014 | 202 |