Grundläggande statistik
| Institutionella ägare | 405 total, 405 long only, 0 short only, 0 long/short - change of 3,57% MRQ |
| Genomsnittlig portföljallokering | 0.3453 % - change of −13,23% MRQ |
| Institutionella aktier (lång) | 133 592 657 (ex 13D/G) - change of 4,44MM shares 3,44% MRQ |
| Institutionellt värde (lång) | $ 1 602 614 USD ($1000) |
Institutionellt ägande och aktieägare
Sprott Physical Silver Trust (US:PSLV) har 405 Institutionella ägare och aktieägare som har lämnat in 13D/G- eller 13F-formulär till Securities Exchange Commission (SEC). Dessa institut innehar totalt 133,592,657 aktier. Största aktieägare inkluderar BlackRock, Inc., Federation des caisses Desjardins du Quebec, Jupiter Asset Management Ltd, Jane Street Group, Llc, Morgan Stanley, Royal Bank Of Canada, Polar Asset Management Partners Inc., LPL Financial LLC, Capital Wealth Alliance, LLC, and Wealthcare Capital Management Llc .
Sprott Physical Silver Trust (ARCA:PSLV) Institutionell ägarstruktur visar institutioners och fonders nuvarande positioner i företaget, samt de senaste förändringarna i positionernas storlek. Större aktieägare kan vara enskilda investerare, fonder, hedgefonder eller institutioner. Bilaga 13D visar att investeraren äger (eller ägde) mer än 5% av företaget och avser (eller avsåg) att aktivt eftersträva en förändring av affärsstrategin. Schedule 13G indikerar en passiv investering på över 5%.
The share price as of September 12, 2025 is 14,30 / share. Previously, on September 16, 2024, the share price was 10,40 / share. This represents an increase of 37,50% over that period.

Fondsentimentets poäng
Fondsentimentet poängen(fka Ägarackumulation-poäng) visar vilka aktier som är mest köpta av fonder. Det är resultatet av en sofistikerad kvantitativ flerfaktormodell som identifierar företag med de högsta nivåerna av institutionell ackumulering. Poängsättningsmodellen använder en kombination av den totala ökningen av redovisade ägare, förändringarna i portföljallokeringarna för dessa ägare och andra mått. Siffran sträcker sig från 0 till 100, där högre siffror indikerar en högre nivå av ackumulering i förhållande till sina konkurrenter, och 50 är genomsnittet.
Uppdateringsfrekvens: Dagligen
Se Ownership Explorer, som innehåller en lista över de högst rankade företagen.
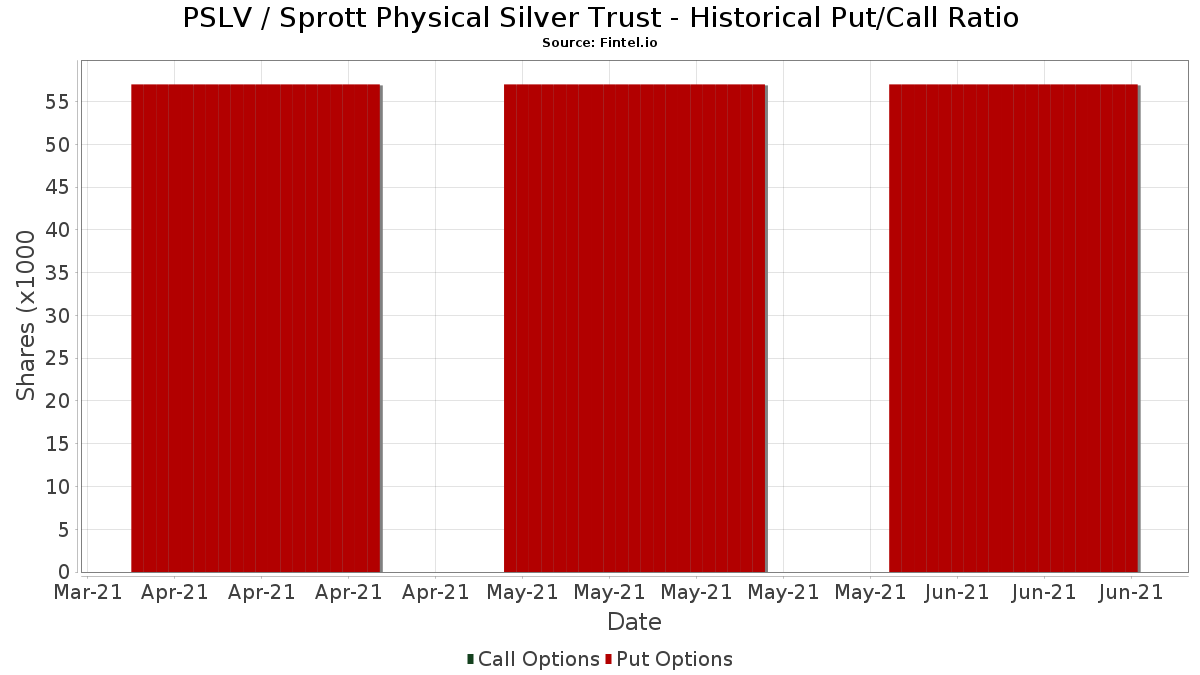
Institutionell sälj/köp-kvot
Förutom att rapportera vanliga eget kapital- och skuldemissioner måste institutioner med mer än 100MM tillgångar under förvaltning också avslöja sina innehav av sälj- och köpoptioner. Eftersom säljoptioner i allmänhet indikerar ett negativt sentiment och köpoptioner indikerar ett positivt sentiment, kan vi få en uppfattning om det övergripande institutionella sentimentet genom att plotta förhållandet mellan säljoptioner och köpoptioner. Diagrammet till höger visar det historiska förhållandet mellan sälj- och köpoptioner för detta instrument.
Genom att använda sälj/köp-kvoten som en indikator på aktieägarnas sentiment undviker man en av de största bristerna med att använda det totala institutionella ägandet, nämligen att en betydande del av de förvaltade tillgångarna investeras passivt för att följa index. Passivt förvaltade fonder köper vanligtvis inte optioner, så indikatorn för sälj/köp-kvoten ger en bättre bild av stämningen i aktivt förvaltade fonder.
13F- och NPORT-arkiveringar
Detaljer om 13F-arkiveringar är gratis. Detaljer om NP-arkiveringar kräver ett premiummedlemskap. Gröna rader indikerar nya positioner. Röda rader indikerar stängda positioner. Klicka på länk symbolen för att se hela transaktionshistoriken.
Uppgradera
för att låsa upp premiumdata och exportera till Excel ![]() .
.
| Fil Datum | Källa | Investerare | Typ | Genomsnittligt pris (beräknat) |
Aktier | Δ Aktier (%) |
Rapporterat värde (1000 USD) |
Δ Värde (%) |
Portföljallokering (%) |
|
|---|---|---|---|---|---|---|---|---|---|---|
| 2025-08-14 | 13F | Promus Capital, LLC | 0 | −100,00 | 0 | −100,00 | ||||
| 2025-08-15 | 13F | Kestra Advisory Services, LLC | 1 207 084 | 43,23 | 14 775 | 51,13 | ||||
| 2025-07-09 | 13F | Procyon Private Wealth Partners, LLC | 24 608 | −0,20 | 301 | 5,24 | ||||
| 2025-07-24 | 13F | Us Bancorp \de\ | 18 324 | 159,91 | 224 | 176,54 | ||||
| 2025-08-04 | 13F | Center for Financial Planning, Inc. | 3 383 | 0,00 | 41 | 5,13 | ||||
| 2025-07-25 | 13F | Sequoia Financial Advisors, LLC | 80 742 | 7,27 | 988 | 13,17 | ||||
| 2025-07-18 | 13F | Parsons Capital Management Inc/ri | 322 218 | −8,52 | 3 944 | −3,48 | ||||
| 2025-07-09 | 13F | Lincoln Capital Corp | 65 000 | 0,00 | 796 | 5,44 | ||||
| 2025-07-31 | 13F/A | Sendero Wealth Management, LLC | 12 000 | 0,00 | 147 | 5,04 | ||||
| 2025-08-06 | 13F | AE Wealth Management LLC | 24 525 | −33,63 | 300 | −29,91 | ||||
| 2025-07-10 | 13F | ARS Wealth Advisors Group, LLC | 18 600 | 0,00 | 228 | 5,58 | ||||
| 2025-07-31 | 13F | Briaud Financial Planning, Inc | 100 | 0,00 | 0 | |||||
| 2025-08-08 | 13F | Cedar Wealth Management, LLC | 183 | 0,00 | 2 | 0,00 | ||||
| 2025-08-14 | 13F | Spears Abacus Advisors LLC | 353 000 | 0,00 | 4 321 | 5,52 | ||||
| 2025-08-11 | 13F | Ritter Daniher Financial Advisory LLC / DE | 862 | 0,00 | 11 | 0,00 | ||||
| 2025-08-14 | 13F | Ancora Advisors, LLC | 186 807 | 1,43 | 2 287 | 7,02 | ||||
| 2025-08-14 | 13F | Bank Of America Corp /de/ | 465 112 | 4,69 | 5 693 | 10,46 | ||||
| 2025-07-29 | 13F | Salomon & Ludwin, LLC | 11 322 | 0,00 | 141 | 6,87 | ||||
| 2025-08-14 | 13F | Stansberry Asset Management, Llc | 11 421 | 140 | ||||||
| 2025-08-14 | 13F | Prelude Capital Management, Llc | 72 703 | 0,00 | 890 | 5,46 | ||||
| 2025-07-29 | 13F | Stratos Wealth Advisors, LLC | 10 646 | 0,00 | 130 | 5,69 | ||||
| 2025-07-07 | 13F | Hedges Asset Management LLC | 31 500 | −28,41 | 386 | −24,51 | ||||
| 2025-07-17 | 13F | Chicago Capital, LLC | 24 000 | 50,00 | 294 | 58,38 | ||||
| 2025-07-21 | 13F | Ameriflex Group, Inc. | 3 400 | 161,54 | 42 | 180,00 | ||||
| 2025-08-12 | 13F | TCTC Holdings, LLC | 102 | 0,00 | 1 | 0,00 | ||||
| 2025-05-05 | 13F | Montag A & Associates Inc | 0 | −100,00 | 0 | |||||
| 2025-07-25 | 13F | Apollon Wealth Management, LLC | 98 916 | 3,43 | 1 211 | 9,11 | ||||
| 2025-07-22 | 13F | Wealthcare Capital Management Llc | 2 444 008 | −34,09 | 29 915 | −30,45 | ||||
| 2025-08-14 | 13F | Sentinus, LLC | 0 | −100,00 | 0 | |||||
| 2025-08-08 | 13F | Avantax Advisory Services, Inc. | 46 238 | 57,10 | 566 | 65,69 | ||||
| 2025-08-01 | 13F | Pasadena Private Wealth, LLC | 473 927 | −8,14 | 5 801 | −3,07 | ||||
| 2025-08-13 | 13F | Smith, Moore & Co. | 108 217 | 2,05 | 1 325 | 7,64 | ||||
| 2025-07-18 | 13F | Sicart Associates LLC | 97 637 | 0,00 | 1 195 | 5,57 | ||||
| 2025-07-09 | 13F | Beacon Financial Group | 36 019 | −0,50 | 441 | 5,01 | ||||
| 2025-07-16 | 13F | Signaturefd, Llc | 152 | 0,00 | 2 | 0,00 | ||||
| 2025-08-08 | 13F | Hudock, Inc. | 179 435 | 0,00 | 2 196 | 5,53 | ||||
| 2025-08-12 | 13F | Foster Dykema Cabot & Partners, Llc | 31 570 | −1,87 | 386 | 3,49 | ||||
| 2025-07-23 | 13F | Mraz, Amerine & Associates, Inc. | 84 725 | 0,00 | 1 037 | 5,71 | ||||
| 2025-08-06 | 13F | Founders Financial Securities Llc | 20 791 | 4,30 | 254 | 14,41 | ||||
| 2025-08-13 | 13F | Continuum Advisory, LLC | 0 | −100,00 | 0 | |||||
| 2025-07-07 | 13F | Whitaker-Myers Wealth Managers, LTD. | 0 | −100,00 | 0 | −100,00 | ||||
| 2025-07-16 | 13F | Castleview Partners, Llc | 35 193 | 18,66 | 431 | 25,00 | ||||
| 2025-07-29 | 13F | Private Trust Co Na | 596 | 7 | ||||||
| 2025-07-28 | 13F | Kiker Wealth Management, LLC | 34 599 | 1,31 | 423 | 6,82 | ||||
| 2025-08-05 | 13F | Huntington National Bank | 0 | −100,00 | ||||||
| 2025-08-12 | 13F | Winnow Wealth Llc | 530 399 | 6 492 | ||||||
| 2025-08-12 | 13F | Journey Strategic Wealth Llc | 22 167 | 0,00 | 271 | 5,45 | ||||
| 2025-04-17 | 13F | FNY Investment Advisers, LLC | 0 | −100,00 | 0 | |||||
| 2025-07-22 | 13F | Capital City Trust Co/fl | 27 320 | 0,00 | 334 | 5,70 | ||||
| 2025-08-04 | 13F | Atria Investments Llc | 13 177 | −10,29 | 161 | −5,29 | ||||
| 2025-08-14 | 13F | Fiduciary Trust Co | 175 865 | −17,28 | 2 153 | −12,73 | ||||
| 2025-08-01 | 13F | Lane Generational LLC | 45 833 | 0,00 | 561 | 5,46 | ||||
| 2025-08-06 | 13F | Adviser Investments LLC | 12 500 | 153 | ||||||
| 2025-08-15 | 13F | Global View Capital Management LLC | 12 434 | −7,13 | 152 | −1,94 | ||||
| 2025-08-11 | 13F | Principal Securities, Inc. | 13 117 | 2 213,40 | 161 | 3 100,00 | ||||
| 2025-08-06 | 13F | First Horizon Advisors, Inc. | 0 | −100,00 | 0 | |||||
| 2025-07-29 | 13F | Arnhold LLC | 99 500 | 0,00 | 1 218 | 5,46 | ||||
| 2025-08-25 | 13F/A | Neuberger Berman Group LLC | 20 300 | −13,18 | 248 | −8,49 | ||||
| 2025-08-14 | 13F | Colony Group, LLC | 17 715 | 26,22 | 217 | 33,33 | ||||
| 2025-08-25 | NP | SLVR - Sprott Silver Miners & Physical Silver ETF | 1 395 549 | 82,72 | 17 082 | 92,81 | ||||
| 2025-07-09 | 13F | Sandy Cove Advisors, LLC | 16 200 | 198 | ||||||
| 2025-08-04 | 13F | Creekmur Asset Management LLC | 62 | 0,00 | 1 | |||||
| 2025-08-12 | 13F | Global Retirement Partners, LLC | 660 | 312,50 | 8 | 700,00 | ||||
| 2025-07-24 | 13F | Insight Inv LLC | 25 750 | 0,00 | 315 | 5,70 | ||||
| 2025-08-05 | 13F | BEAM Asset Management, LLC | 81 857 | 26,08 | 1 002 | 32,93 | ||||
| 2025-07-24 | 13F | Mainstay Capital Management Llc /adv | 31 220 | 100,00 | 382 | 111,05 | ||||
| 2025-07-29 | 13F | Stephens Inc /ar/ | 16 575 | 7,80 | 203 | 13,48 | ||||
| 2025-08-04 | 13F | Integrity Alliance, Llc. | 0 | −100,00 | 0 | |||||
| 2025-07-15 | 13F | Evanson Asset Management, LLC | 50 300 | 0,00 | 616 | 5,49 | ||||
| 2025-07-22 | 13F | Belpointe Asset Management LLC | 405 653 | 3,17 | 4 965 | 8,88 | ||||
| 2025-08-14 | 13F | Hrt Financial Lp | 72 260 | 1 | ||||||
| 2025-08-14 | 13F | Nokomis Capital, L.L.C. | 479 721 | 48,60 | 5 872 | 56,81 | ||||
| 2025-07-21 | 13F | Hilltop National Bank | 2 000 | 0,00 | 24 | 26,32 | ||||
| 2025-07-14 | 13F | AdvisorNet Financial, Inc | 625 | 0,00 | 8 | 0,00 | ||||
| 2025-07-14 | 13F | Bank & Trust Co | 1 500 | 0,00 | 18 | 5,88 | ||||
| 2025-08-14 | 13F/A | Rockefeller Capital Management L.P. | 17 446 | 214 | ||||||
| 2025-08-14 | 13F | Smartleaf Asset Management LLC | 64 | −81,40 | 1 | −100,00 | ||||
| 2025-07-09 | 13F | Veracity Capital LLC | 48 252 | 0,02 | 591 | 5,55 | ||||
| 2025-08-12 | 13F | Cutter & CO Brokerage, Inc. | 0 | −100,00 | 0 | |||||
| 2025-08-13 | 13F | Baird Financial Group, Inc. | 270 088 | −6,33 | 3 306 | −1,17 | ||||
| 2025-05-12 | 13F | Citigroup Inc | 0 | −100,00 | 0 | |||||
| 2025-08-14 | 13F | Van Den Berg Management I, Inc | 37 819 | −0,66 | 463 | 4,76 | ||||
| 2025-08-13 | 13F | Pictet Asset Management Holding SA | 285 444 | 0,00 | 3 494 | 5,50 | ||||
| 2025-04-11 | 13F | Littlejohn Financial Services, Inc. | 0 | −100,00 | 0 | |||||
| 2025-09-10 | 13F | WT Wealth Management | 0 | −100,00 | 0 | |||||
| 2025-08-14 | 13F | Stifel Financial Corp | 796 609 | 21,75 | 9 750 | 28,48 | ||||
| 2025-08-14 | 13F | Money Concepts Capital Corp | 613 995 | 1,63 | 7 515 | 7,25 | ||||
| 2025-07-25 | 13F | Concord Wealth Partners | 2 500 | 0,00 | 31 | 3,45 | ||||
| 2025-08-14 | 13F | Guardian Wealth Advisors, Llc / Nc | 180 503 | 16,41 | 2 209 | 22,86 | ||||
| 2025-07-11 | 13F | Seacrest Wealth Management, Llc | 109 234 | −0,55 | 1 337 | 4,95 | ||||
| 2025-08-14 | 13F | PenderFund Capital Management Ltd. | 665 000 | 8 140 | ||||||
| 2025-08-18 | 13F | Geneos Wealth Management Inc. | 888 086 | −3,95 | 10 870 | 1,36 | ||||
| 2025-08-13 | 13F | Summit Financial, LLC | 606 451 | 399,77 | 7 423 | 427,51 | ||||
| 2025-07-09 | 13F | VisionPoint Advisory Group, LLC | 15 087 | 0,00 | 185 | 5,14 | ||||
| 2025-07-23 | 13F | Regency Capital Management Inc.\DE | 208 896 | 3,06 | 2 557 | 8,72 | ||||
| 2025-08-14 | 13F | Harwood Advisory Group, LLC | 0 | −100,00 | 0 | |||||
| 2025-07-23 | 13F | Prime Capital Investment Advisors, LLC | 0 | −100,00 | 0 | |||||
| 2025-07-24 | 13F | Costello Asset Management, INC | 1 500 | 0,00 | 18 | 5,88 | ||||
| 2025-07-30 | 13F | Avidian Wealth Solutions, LLC | 51 874 | 2,37 | 635 | 8,01 | ||||
| 2025-04-14 | 13F | Midland Wealth Advisors Llc | 0 | −100,00 | 0 | |||||
| 2025-08-11 | 13F | Private Advisor Group, LLC | 319 698 | 0,21 | 3 913 | 5,76 | ||||
| 2025-08-06 | 13F | Csenge Advisory Group | 24 401 | 3,84 | 272 | 5,45 | ||||
| 2025-08-08 | 13F | Larson Financial Group LLC | 176 521 | −0,19 | 2 161 | 5,31 | ||||
| 2025-08-12 | 13F | Amitell Capital Pte Ltd | 240 680 | 0,00 | 2 946 | 5,52 | ||||
| 2025-08-13 | 13F | Botty Investors LLC | 245 864 | 0,00 | 3 009 | 5,50 | ||||
| 2025-08-14 | 13F | Polar Asset Management Partners Inc. | 3 437 232 | −32,33 | 42 072 | −28,59 | ||||
| 2025-07-28 | 13F | Pettinga Financial Advisors, LLC | 230 100 | −2,82 | 2 816 | 2,55 | ||||
| 2025-08-14 | 13F | Mercer Global Advisors Inc /adv | 38 188 | −12,39 | 467 | −7,52 | ||||
| 2025-04-14 | 13F | IMC-Chicago, LLC | 0 | −100,00 | 0 | |||||
| 2025-07-01 | 13F | Kera Capital Partners, Inc. | 431 836 | 4,72 | 5 286 | 10,50 | ||||
| 2025-08-11 | 13F | Hexagon Capital Partners LLC | 0 | −100,00 | 0 | |||||
| 2025-08-08 | 13F | Ironwood Investment Counsel, LLC | 43 570 | 0,00 | 533 | 5,54 | ||||
| 2025-08-11 | 13F | Sprott Inc. | 1 871 227 | −2,27 | 22 904 | 3,12 | ||||
| 2025-08-12 | 13F | SPX Equities Gestao de Recursos Ltda | 150 000 | −25,00 | 1 836 | −20,86 | ||||
| 2025-08-19 | 13F | Hohimer Wealth Management, Llc | 17 469 | 0,00 | 214 | 5,45 | ||||
| 2025-07-16 | 13F | Beaumont Financial Advisors, LLC | 85 867 | −3,44 | 1 051 | 1,94 | ||||
| 2025-04-28 | 13F | Fedenia Advisers LLC | 0 | −100,00 | 0 | |||||
| 2025-08-18 | 13F/A | National Bank Of Canada /fi/ | 167 339 | −71,55 | 2 029 | −69,99 | ||||
| 2025-07-08 | 13F | Parallel Advisors, LLC | 4 395 | 0,00 | 54 | 6,00 | ||||
| 2025-08-13 | 13F | Gateway Wealth Partners, LLC | 10 000 | 122 | ||||||
| 2025-08-12 | 13F | Jpmorgan Chase & Co | 115 928 | −5,74 | 1 419 | −0,56 | ||||
| 2025-07-11 | 13F | Farther Finance Advisors, LLC | 65 958 | 26,81 | 807 | 34,72 | ||||
| 2025-08-04 | 13F | Pensionmark Financial Group, Llc | 556 498 | 53,96 | 6 812 | 62,48 | ||||
| 2025-08-04 | 13F | IFG Advisory, LLC | 19 654 | 0,00 | 241 | 5,73 | ||||
| 2025-07-14 | 13F | UMA Financial Services, Inc. | 589 | 0,00 | 7 | 16,67 | ||||
| 2025-08-14 | 13F | Royal Bank Of Canada | 3 547 320 | 4,87 | 43 418 | 10,65 | ||||
| 2025-08-14 | 13F | Two Sigma Securities, Llc | 105 752 | 143,18 | 1 294 | 156,75 | ||||
| 2025-07-16 | 13F | Pacific Sage Partners, LLC | 452 093 | 7,58 | 5 534 | 13,52 | ||||
| 2025-08-12 | 13F | J.w. Cole Advisors, Inc. | 134 567 | 19,30 | 1 647 | 25,92 | ||||
| 2025-07-10 | 13F | Worth Asset Management, LLC | 17 300 | 0,00 | 212 | 5,50 | ||||
| 2025-08-13 | 13F | Millstone Evans Group, LLC | 6 000 | 0,00 | 73 | 5,80 | ||||
| 2025-05-14 | 13F | Walleye Capital LLC | 0 | −100,00 | 0 | |||||
| 2025-08-14 | 13F | IPG Investment Advisors LLC | 22 390 | 0,00 | 274 | 5,79 | ||||
| 2025-08-14 | 13F | LM Asset (IM) Inc. | 330 000 | 10,00 | 4 039 | 16,06 | ||||
| 2025-07-14 | 13F | Cobblestone Asset Management LLC | 84 303 | −0,26 | 1 032 | 5,20 | ||||
| 2025-08-01 | 13F | Envestnet Asset Management Inc | 1 050 899 | 28,02 | 12 863 | 35,09 | ||||
| 2025-08-11 | 13F | Strategic Wealth Partners, Ltd. | 6 408 | 78 | ||||||
| 2025-07-22 | 13F | Warwick Investment Management, Inc. | 21 615 | 0,00 | 265 | 5,60 | ||||
| 2025-08-14 | 13F | Hurley Capital, LLC | 462 561 | 0,17 | 5 662 | 5,69 | ||||
| 2025-08-29 | 13F | Total Investment Management Inc | 18 039 | 0,00 | 221 | 5,26 | ||||
| 2025-08-12 | 13F | AlphaCore Capital LLC | 140 575 | 99,19 | 1 721 | 110,53 | ||||
| 2025-07-22 | 13F | Jamison Private Wealth Management, Inc. | 57 590 | 0,00 | 705 | 5,39 | ||||
| 2025-08-13 | 13F | SMART Wealth LLC | 255 824 | 21,85 | 3 131 | 28,58 | ||||
| 2025-08-14 | 13F | Wiley Bros.-aintree Capital, Llc | 31 536 | 73,75 | 386 | 83,81 | ||||
| 2025-07-30 | 13F | Schulhoff & Co Inc | 12 000 | 147 | ||||||
| 2025-07-11 | 13F/A | Umb Bank N A/mo | 25 000 | 306 | ||||||
| 2025-08-06 | 13F | Pekin Hardy Strauss, Inc. | 880 542 | 10,05 | 10 778 | 16,12 | ||||
| 2025-07-29 | 13F | Oxbow Advisors, LLC | 33 204 | −2,92 | 406 | 2,53 | ||||
| 2025-07-23 | 13F | Vontobel Holding Ltd. | 15 000 | 0,00 | 184 | 12,27 | ||||
| 2025-07-10 | 13F | Focus Financial Network, Inc. | 14 303 | −6,87 | 175 | −1,69 | ||||
| 2025-07-21 | 13F | Fortis Capital Advisors, LLC | 64 028 | −1,15 | 784 | 4,26 | ||||
| 2025-08-12 | 13F | Heritage Trust Co | 14 049 | 7,66 | 172 | 13,25 | ||||
| 2025-08-12 | 13F | Argent Trust Co | 63 749 | 0,00 | 780 | 5,55 | ||||
| 2025-07-22 | 13F | Apexium Financial, Lp | 19 000 | 0,00 | 233 | 5,45 | ||||
| 2025-08-12 | 13F | Accordant Advisory Group Inc | 530 399 | 3,60 | 6 492 | 9,31 | ||||
| 2025-08-14 | 13F | Kovitz Investment Group Partners, LLC | 12 624 | 6,32 | 155 | 12,41 | ||||
| 2025-08-14 | 13F | Principia Wealth Advisory, LLC | 17 070 | −16,51 | 209 | −1,89 | ||||
| 2025-08-12 | 13F | Steward Partners Investment Advisory, Llc | 331 076 | −0,54 | 4 052 | 4,95 | ||||
| 2025-08-12 | 13F | Ade, Llc | 33 777 | 0,00 | 413 | 5,63 | ||||
| 2025-08-13 | 13F | Townsquare Capital Llc | 0 | −100,00 | 0 | |||||
| 2025-07-17 | 13F/A | Capital Investment Advisors, LLC | 24 359 | 10,25 | 298 | 16,41 | ||||
| 2025-08-14 | 13F | First Manhattan Co | 102 395 | 0,00 | 1 253 | 5,56 | ||||
| 2025-08-12 | 13F | Northeast Planning Associates, Inc. / Nh / | 36 452 | 0,00 | 446 | 5,69 | ||||
| 2025-08-14 | 13F | Federation des caisses Desjardins du Quebec | 15 939 078 | 4,99 | 194 717 | 10,79 | ||||
| 2025-07-25 | 13F | We Are One Seven, LLC | 17 884 | 11,75 | 219 | 17,84 | ||||
| 2025-08-18 | 13F/A | Nomura Holdings Inc | 44 600 | −50,10 | 546 | −47,39 | ||||
| 2025-07-18 | 13F | First Pacific Financial | 1 112 | 42,38 | 14 | 44,44 | ||||
| 2025-08-04 | 13F | Kovack Advisors, Inc. | 301 376 | 1,12 | 3 689 | 6,68 | ||||
| 2025-08-08 | 13F | Jupiter Asset Management Ltd | 7 610 391 | 15,17 | 93 214 | 21,66 | ||||
| 2025-07-14 | 13F | U.S. Capital Wealth Advisors, LLC | 40 689 | 0,00 | 498 | 5,73 | ||||
| 2025-08-14 | 13F | GWM Advisors LLC | 103 898 | 52,98 | 1 272 | 61,50 | ||||
| 2025-07-30 | 13F | Bleakley Financial Group, LLC | 299 258 | 0,31 | 3 663 | 5,84 | ||||
| 2025-08-05 | 13F | Sigma Planning Corp | 97 429 | −2,89 | 1 193 | 2,49 | ||||
| 2025-07-29 | 13F | JTC Employer Solutions Trusteee Ltd | 11 245 | 0,00 | 0 | |||||
| 2025-08-12 | 13F | Blueprint Investment Partners LLC | 503 561 | 12,03 | 6 164 | 18,20 | ||||
| 2025-07-25 | 13F | Almanack Investment Partners, LLC. | 10 500 | 0,00 | 129 | 5,79 | ||||
| 2025-07-24 | 13F | IFP Advisors, Inc | 6 565 | 0,46 | 80 | 6,67 | ||||
| 2025-07-25 | 13F | Cwm, Llc | 1 614 | 118,40 | 0 | |||||
| 2025-08-07 | 13F | Fidelis Capital Partners, LLC | 1 618 160 | −0,87 | 20 761 | 14,58 | ||||
| 2025-08-12 | 13F | Bokf, Na | 23 728 | 290 | ||||||
| 2025-08-07 | 13F | Cypress Capital Management LLC (WY) | 15 | 0,00 | 0 | |||||
| 2025-05-12 | 13F | Independent Advisor Alliance | 0 | −100,00 | 0 | |||||
| 2025-08-18 | 13F | Hollencrest Capital Management | 1 354 839 | 0,07 | 16 583 | 5,60 | ||||
| 2025-07-15 | 13F | Mather Group, Llc. | 0 | −100,00 | 0 | |||||
| 2025-07-28 | 13F | Duncker Streett & Co Inc | 1 800 | 0,00 | 22 | 10,00 | ||||
| 2025-08-14 | 13F | Jane Street Group, Llc | 5 772 074 | 163,57 | 70 650 | 178,12 | ||||
| 2025-07-11 | 13F | SILVER OAK SECURITIES, Inc | 33 678 | 1,51 | 412 | 7,29 | ||||
| 2025-08-06 | 13F | Commonwealth Equity Services, Llc | 475 439 | −49,40 | 6 | −50,00 | ||||
| 2025-07-18 | 13F | Clarity Financial LLC | 29 362 | 0,09 | 359 | 5,59 | ||||
| 2025-08-11 | 13F | NewEdge Wealth, LLC | 211 665 | 0,00 | 2 745 | 11,81 | ||||
| 2025-08-05 | 13F | Westside Investment Management, Inc. | 1 200 | 0,00 | 15 | 7,69 | ||||
| 2025-08-08 | 13F | Islay Capital Management, Llc | 57 124 | −3,05 | 699 | 2,34 | ||||
| 2025-08-01 | 13F | Transcend Wealth Collective, Llc | 58 500 | 0,00 | 716 | 5,60 | ||||
| 2025-08-14 | 13F | Alliance Wealth Advisors, LLC /UT | 45 500 | 151,38 | 557 | 166,03 | ||||
| 2025-08-07 | 13F | Resources Investment Advisors, LLC. | 199 391 | −0,62 | 2 441 | 4,86 | ||||
| 2025-08-12 | 13F | Insigneo Advisory Services, Llc | 152 747 | −5,81 | 1 870 | −0,64 | ||||
| 2025-08-14 | 13F | Glenmede Investment Management, LP | 342 718 | 4 195 | ||||||
| 2025-08-21 | NP | LIONX - Issachar Fund Class N Shares | 0 | −100,00 | 0 | −100,00 | ||||
| 2025-07-08 | 13F | Apella Capital, LLC | 346 258 | 3,06 | 4 342 | 24,52 | ||||
| 2025-08-15 | 13F | Captrust Financial Advisors | 18 065 | −16,55 | 221 | −11,95 | ||||
| 2025-08-26 | NP | PVCMX - Palm Valley Capital Fund Investor Class | 556 096 | −13,41 | 6 807 | −8,64 | ||||
| 2025-08-08 | 13F | Kingsview Wealth Management, LLC | 548 152 | 10,59 | 6 709 | 16,70 | ||||
| 2025-08-04 | 13F | Assetmark, Inc | 1 335 | 2 372,22 | 16 | |||||
| 2025-08-13 | 13F | Philadelphia Trust Co | 102 366 | −19,89 | 1 | 0,00 | ||||
| 2025-08-14 | 13F | Raymond James Financial Inc | 1 167 191 | −49,41 | 14 286 | −46,62 | ||||
| 2025-05-09 | 13F | Hemington Wealth Management | 0 | −100,00 | 0 | |||||
| 2025-08-08 | 13F | Creative Planning | 80 224 | −53,51 | 982 | −50,97 | ||||
| 2025-08-04 | 13F | Bay Colony Advisory Group, Inc d/b/a Bay Colony Advisors | 19 063 | −82,31 | 233 | −81,32 | ||||
| 2025-07-11 | 13F | Arrow Investment Advisors, LLC | 0 | −100,00 | 0 | |||||
| 2025-08-07 | 13F | Rathbone Brothers plc | 399 155 | 4,19 | 4 886 | 9,92 | ||||
| 2025-08-11 | 13F | HighTower Advisors, LLC | 579 977 | 31,79 | 7 099 | 39,07 | ||||
| 2025-08-12 | 13F | Tocqueville Asset Management L.p. | 32 000 | 0,00 | 392 | 5,39 | ||||
| 2025-07-23 | 13F | 1 North Wealth Services Llc | 10 560 | 0,00 | 129 | 5,74 | ||||
| 2025-08-14 | 13F | Susquehanna International Group, Llp | 344 358 | 242,95 | 4 215 | 262,03 | ||||
| 2025-07-09 | 13F | St. Louis Financial Planners Asset Management, LLC | 10 010 | 0,00 | 123 | 5,17 | ||||
| 2025-08-13 | 13F | Beacon Pointe Advisors, LLC | 162 100 | −10,22 | 1 984 | −5,25 | ||||
| 2025-07-14 | 13F | S.A. Mason LLC | 1 400 | 0,00 | 17 | 6,25 | ||||
| 2025-08-12 | 13F | Laurel Wealth Advisors LLC | 15 912 | 1 124,00 | 1 | −93,33 | ||||
| 2025-08-13 | 13F | RIA Advisory Group LLC | 120 498 | −4,14 | 1 475 | 1,10 | ||||
| 2025-08-05 | 13F | Meixler Investment Management, Ltd. | 28 240 | 3,39 | 346 | 9,18 | ||||
| 2025-08-08 | 13F | Cetera Investment Advisers | 1 299 231 | 16,95 | 15 903 | 23,41 | ||||
| 2025-07-24 | 13F | Total Wealth Planning & Management, Inc. | 22 460 | 4,66 | 275 | 10,48 | ||||
| 2025-07-31 | 13F | Oppenheimer & Co Inc | 60 285 | 3,56 | 738 | 9,19 | ||||
| 2025-08-01 | 13F | Rossby Financial, LCC | 197 450 | 3,89 | 2 417 | 14,56 | ||||
| 2025-08-12 | 13F | Proequities, Inc. | 0 | 0 | ||||||
| 2025-08-14 | 13F | Snowden Capital Advisors LLC | 0 | −100,00 | 0 | −100,00 | ||||
| 2025-08-07 | 13F | Guardian Partners Inc. | 13 450 | 0,00 | 167 | 9,93 | ||||
| 2025-07-14 | 13F | Toth Financial Advisory Corp | 150 | 0,00 | 2 | 0,00 | ||||
| 2025-08-12 | 13F | Change Path, LLC | 66 928 | 157,22 | 819 | 172,09 | ||||
| 2025-07-30 | 13F | Princeton Global Asset Management LLC | 2 500 | 0,00 | 31 | 3,45 | ||||
| 2025-08-07 | 13F | CENTRAL TRUST Co | 593 635 | −4,13 | 7 266 | 1,16 | ||||
| 2025-07-29 | 13F | Koshinski Asset Management, Inc. | 13 259 | 0,00 | 162 | 5,88 | ||||
| 2025-04-30 | 13F | Sofos Investments, Inc. | 36 | 0 | ||||||
| 2025-08-13 | 13F | Northwestern Mutual Wealth Management Co | 5 950 | 0,00 | 73 | 4,35 | ||||
| 2025-07-08 | 13F | Arlington Trust Co LLC | 21 101 | 0,00 | 258 | 5,74 | ||||
| 2025-08-14 | 13F | Harvest Investment Services, LLC | 167 947 | 2,22 | 2 056 | 7,87 | ||||
| 2025-07-24 | 13F | Columbia Advisory Partners Llc | 132 670 | −6,17 | 1 624 | −1,04 | ||||
| 2025-07-31 | 13F | Buckingham Strategic Partners | 26 322 | 322 | ||||||
| 2025-08-12 | 13F | Waddell & Associates, Llc | 305 808 | −7,87 | 3 743 | −2,78 | ||||
| 2025-08-07 | 13F | PFG Advisors | 60 072 | 21,60 | 735 | 28,27 | ||||
| 2025-07-30 | 13F | Rehmann Capital Advisory Group | 10 328 | 0,00 | 126 | 5,88 | ||||
| 2025-08-13 | 13F | Transce3nd, LLC | 1 350 | 0,00 | 17 | 6,67 | ||||
| 2025-07-16 | 13F | Crown Wealth Group, LLC | 16 429 | 201 | ||||||
| 2025-08-08 | 13F | Thoroughbred Financial Services, Llc | 23 842 | 0,00 | 0 | |||||
| 2025-08-05 | 13F | Cherry Tree Wealth Management, LLC | 17 289 | −9,01 | 212 | −4,09 | ||||
| 2025-08-06 | 13F | TKG Advisors, LLC | 12 221 | 150 | ||||||
| 2025-08-14 | 13F | TT Capital Management LLC | 687 475 | 4 785,41 | 7 640 | 4 586,50 | ||||
| 2025-07-08 | 13F | Baker Ellis Asset Management LLC | 0 | −100,00 | 0 | |||||
| 2025-05-13 | 13F | Camden Capital, LLC | 0 | −100,00 | 0 | |||||
| 2025-07-10 | 13F | Wealth Enhancement Advisory Services, Llc | 749 758 | 1,14 | 9 402 | 9,34 | ||||
| 2025-07-16 | 13F | Pictet & Cie (Europe) SA | 11 449 | 0,00 | 140 | 6,06 | ||||
| 2025-08-14 | 13F | IHT Wealth Management, LLC | 112 700 | −5,71 | 1 379 | −0,51 | ||||
| 2025-08-07 | 13F | HC Advisors, LLC | 193 472 | 57,81 | 2 368 | 66,53 | ||||
| 2025-08-07 | 13F | Vise Technologies, Inc. | 14 462 | 0,00 | 177 | 27,34 | ||||
| 2025-07-18 | 13F | PFG Investments, LLC | 90 017 | 0,63 | 1 102 | 6,17 | ||||
| 2025-08-12 | 13F | Providence Wealth Advisors, LLC | 36 363 | 0,00 | 472 | 12,92 | ||||
| 2025-04-21 | 13F | ORG Wealth Partners, LLC | 0 | −100,00 | 0 | |||||
| 2025-08-15 | 13F | Tower Research Capital LLC (TRC) | 7 565 | 1 190,96 | 93 | 1 433,33 | ||||
| 2025-08-13 | 13F | StoneX Group Inc. | 58 324 | 122,19 | 714 | 134,54 | ||||
| 2025-08-06 | 13F | Moors & Cabot, Inc. | 129 890 | −26,91 | 1 590 | −22,90 | ||||
| 2025-08-12 | 13F | Entruity Wealth, LLC | 457 194 | 2,95 | 5 596 | 8,64 | ||||
| 2025-08-19 | 13F | Asset Dedication, LLC | 17 | 0 | ||||||
| 2025-08-14 | 13F | Heritage Wealth Management, Inc. | 36 920 | 0,00 | 452 | 5,37 | ||||
| 2025-08-15 | 13F | Morgan Stanley | 3 730 578 | 3,67 | 45 662 | 9,39 | ||||
| 2025-07-31 | 13F | Fielder Capital Group LLC | 520 150 | −8,22 | 6 367 | −3,16 | ||||
| 2025-08-14 | 13F | Sunbelt Securities, Inc. | 16 600 | 0,00 | 160 | −16,67 | ||||
| 2025-07-29 | 13F | Stratos Wealth Partners, LTD. | 124 172 | 3,03 | 1 520 | 8,66 | ||||
| 2025-08-14 | 13F | Benjamin Edwards Inc | 42 953 | 526 | ||||||
| 2025-03-24 | 13F/A | Wellington Management Group Llp | 0 | −100,00 | 0 | |||||
| 2025-07-28 | 13F | Nadler Financial Group, Inc. | 73 066 | 5,53 | 894 | 11,33 | ||||
| 2025-08-14 | 13F | Mason Hill Advisors Llc | 1 473 000 | 0,00 | 18 030 | 5,52 | ||||
| 2025-09-04 | 13F | V. M. Manning & Co., Inc. | 30 871 | 417 | ||||||
| 2025-07-21 | 13F | Synergy Financial Management, LLC | 29 856 | 0,84 | 365 | 6,41 | ||||
| 2025-08-12 | 13F | Financial Advocates Investment Management | 102 799 | 20,51 | 1 258 | 27,20 | ||||
| 2025-05-16 | 13F | Jones Financial Companies Lllp | 76 396 | 9 449,50 | 5 839 | 83 300,00 | ||||
| 2025-07-18 | 13F | Trust Co Of Vermont | 4 583 | 56 | ||||||
| 2025-08-13 | 13F | Cerity Partners LLC | 102 908 | 5,19 | 1 260 | 11,02 | ||||
| 2025-07-16 | 13F | Badgley Phelps Wealth Managers, LLC | 24 300 | 3,85 | 297 | 9,59 | ||||
| 2025-07-22 | 13F | Wealthcare Advisory Partners LLC | 280 504 | 0,71 | 3 433 | 6,28 | ||||
| 2025-08-14 | 13F | Citadel Advisors Llc | 11 423 | 140 | ||||||
| 2025-08-13 | 13F | Nicolet Advisory Services, Llc | 16 240 | 0,00 | 203 | 19,41 | ||||
| 2025-07-25 | 13F | Atria Wealth Solutions, Inc. | 134 232 | 12,94 | 1 664 | 20,75 | ||||
| 2025-07-21 | 13F | Ameritas Advisory Services, LLC | 109 264 | 76,33 | 1 337 | 102,58 | ||||
| 2025-08-04 | 13F | Flagship Harbor Advisors, Llc | 16 890 | −13,85 | 207 | −9,25 | ||||
| 2025-08-14 | 13F | CIBC World Markets Inc. | 788 067 | 46,52 | 9 646 | 54,59 | ||||
| 2025-08-08 | 13F | Foundations Investment Advisors, LLC | 32 365 | 171,45 | 396 | 186,96 | ||||
| 2025-08-04 | 13F | Keybank National Association/oh | 57 858 | 17,53 | 708 | 23,99 | ||||
| 2025-08-13 | 13F | Proactive Wealth Strategies LLC | 252 927 | 3 | ||||||
| 2025-07-31 | 13F | Leavell Investment Management, Inc. | 132 816 | 2,17 | 1 626 | 7,76 | ||||
| 2025-08-06 | 13F | Prospera Financial Services Inc | 1 147 512 | 102,30 | 14 045 | 113,48 | ||||
| 2025-07-23 | 13F | Tcfg Wealth Management, Llc | 75 725 | −54,28 | 927 | −51,80 | ||||
| 2025-08-27 | 13F/A | Brinker Capital Investments, LLC | 14 685 | 180 | ||||||
| 2025-08-14 | 13F | Warren Averett Asset Management, LLC | 95 829 | 0,52 | 1 173 | 6,06 | ||||
| 2025-08-14 | 13F | Integrated Wealth Concepts LLC | 193 468 | −2,81 | 2 368 | 2,56 | ||||
| 2025-07-25 | 13F | Sharp Financial Services, LLC | 12 000 | 147 | ||||||
| 2025-08-14 | 13F | Beaird Harris Wealth Management, LLC | 165 624 | 0,00 | 2 027 | 5,52 | ||||
| 2025-08-13 | 13F | EverSource Wealth Advisors, LLC | 44 176 | 996,72 | 541 | 1 073,91 | ||||
| 2025-07-21 | 13F | Mendota Financial Group, LLC | 16 000 | −9,14 | 196 | −4,41 | ||||
| 2025-07-30 | 13F | LifeWealth Investments, LLC | 11 760 | 144 | ||||||
| 2025-08-28 | NP | Cohen & Steers Closed-end Opportunity Fund, Inc. | 440 145 | 36,21 | 5 387 | 43,73 | ||||
| 2025-08-13 | 13F | Alerus Financial Na | 300 | 4 | ||||||
| 2025-07-15 | 13F | McAdam, LLC | 0 | −100,00 | 0 | |||||
| 2025-08-05 | 13F | GHP Investment Advisors, Inc. | 0 | −100,00 | 0 | |||||
| 2025-05-12 | 13F | Fiduciary Family Office, Llc | 0 | −100,00 | 0 | |||||
| 2025-07-10 | 13F | Baker Tilly Financial, Llc | 39 432 | 0,00 | 483 | 5,47 | ||||
| 2025-08-06 | 13F | Atlantic Union Bankshares Corp | 2 629 | 32 | ||||||
| 2025-08-04 | 13F | Spire Wealth Management | 191 430 | −10,14 | 2 343 | −5,18 | ||||
| 2025-08-06 | 13F | O'Brien Greene & Co. Inc | 29 864 | 20,11 | 366 | 26,74 | ||||
| 2025-04-17 | 13F | James Hambro & Partners | 0 | −100,00 | 0 | −100,00 | ||||
| 2025-07-17 | 13F | Northwest Wealth Management, Llc | 20 644 | 0,00 | 253 | 5,44 | ||||
| 2025-08-01 | 13F | Gwn Securities Inc. | 0 | −100,00 | 0 | |||||
| 2025-08-12 | 13F | Tradition Wealth Management, LLC | 62 194 | 50,25 | 761 | 58,54 | ||||
| 2025-08-08 | 13F | Pnc Financial Services Group, Inc. | 112 430 | 177,95 | 1 376 | 193,39 | ||||
| 2025-08-14 | 13F | Mariner, LLC | 165 401 | −3,85 | 2 025 | 1,45 | ||||
| 2025-08-14 | 13F | Integrity Wealth Advisors, Inc. | 62 872 | −0,28 | 770 | 5,20 | ||||
| 2025-08-07 | 13F | Allworth Financial LP | 42 017 | −31,80 | 514 | −26,04 | ||||
| 2025-08-06 | 13F | Wedbush Securities Inc | 18 399 | 0,00 | 0 | |||||
| 2025-08-01 | 13F | Brookwood Investment Group LLC | 12 498 | −59,56 | 153 | −57,54 | ||||
| 2025-07-31 | 13F | Cambridge Investment Research Advisors, Inc. | 717 960 | 37,10 | 9 | 33,33 | ||||
| 2025-07-25 | 13F | Total Clarity Wealth Management, Inc. | 18 715 | 229 | ||||||
| 2025-07-11 | 13F | Caldwell Securities, Inc | 10 300 | 0,00 | 126 | 5,88 | ||||
| 2025-07-24 | 13F | Ronald Blue Trust, Inc. | 6 050 | 74 | ||||||
| 2025-08-12 | 13F | Ci Investments Inc. | 55 000 | 37,50 | 1 | |||||
| 2025-07-28 | 13F | Cypress Wealth Services, LLC | 85 816 | 0,14 | 1 050 | 5,63 | ||||
| 2025-08-14 | 13F | Banque Transatlantique SA | 0 | −100,00 | 0 | |||||
| 2025-06-26 | NP | DWAT - Arrow DWA Tactical ETF | 11 561 | −37,02 | 127 | −34,37 | ||||
| 2025-08-14 | 13F | Hara Capital LLC | 6 037 | −1,63 | 74 | 2,82 | ||||
| 2025-07-21 | 13F | Matauro, Llc | 19 397 | 237 | ||||||
| 2025-08-06 | 13F | Carnegie Lake Advisors LLC | 62 000 | −2,05 | 1 | |||||
| 2025-07-23 | 13F/A | Euro Pacific Asset Management, LLC | 311 622 | 14,50 | 4 | 0,00 | ||||
| 2025-08-13 | 13F | Scotia Capital Inc. | 75 704 | 942 | ||||||
| 2025-08-14 | 13F | Apriem Advisors | 10 500 | 0,00 | 129 | 5,79 | ||||
| 2025-08-14 | 13F | Matrix Private Capital Group Llc | 0 | −100,00 | 0 | |||||
| 2025-08-05 | 13F | Tiaa Trust, National Association | 810 456 | 297,48 | 9 920 | 319,41 | ||||
| 2025-07-22 | 13F | Miracle Mile Advisors, LLC | 10 000 | 0,00 | 122 | 5,17 | ||||
| 2025-07-30 | 13F | Caliber Wealth Management, LLC / KS | 49 250 | 0,00 | 603 | 5,43 | ||||
| 2025-07-16 | 13F | ORG Partners LLC | 1 972 | 11,92 | 24 | 20,00 | ||||
| 2025-07-09 | 13F | Bulwark Capital Corp | 1 450 | 18 | ||||||
| 2025-07-21 | 13F | Andina Capital Management, LLC | 28 000 | 343 | ||||||
| 2025-07-31 | 13F | Moloney Securities Asset Management, LLC | 10 710 | 131 | ||||||
| 2025-08-07 | 13F | Kestra Private Wealth Services, Llc | 10 745 | 0,00 | 132 | 5,65 | ||||
| 2025-07-09 | 13F | Keystone Wealth Services, LLC | 17 650 | 0,00 | 216 | 5,88 | ||||
| 2025-08-19 | 13F | Advisory Services Network, LLC | 511 726 | 44,21 | 6 356 | 54,40 | ||||
| 2025-08-01 | 13F | Redwood Park Advisors LLC | 2 605 | 32 | ||||||
| 2025-07-01 | 13F | Private Client Services, Llc | 32 151 | 28,50 | 394 | 35,52 | ||||
| 2025-04-21 | 13F | Nelson, Van Denburg & Campbell Wealth Management Group, LLC | 0 | −100,00 | 0 | |||||
| 2025-08-13 | 13F | Beutel, Goodman & Co Ltd. | 92 500 | 0,00 | 1 | 0,00 | ||||
| 2025-08-12 | 13F | SRS Capital Advisors, Inc. | 1 900 | 23 | ||||||
| 2025-04-22 | 13F | VanWeelden Wealth Management, LLC | 27 000 | 14,18 | 313 | 37,28 | ||||
| 2025-08-05 | 13F | Bank Of Montreal /can/ | 861 955 | 36,22 | 14 386 | 97,18 | ||||
| 2025-08-04 | 13F | Arkadios Wealth Advisors | 76 096 | 3,30 | 931 | 9,02 | ||||
| 2025-07-29 | 13F | Tradewinds Capital Management, LLC | 530 | 324,00 | 6 | 500,00 | ||||
| 2025-07-22 | 13F | Compass Financial Group, INC/SD | 10 093 | 0,00 | 124 | 5,13 | ||||
| 2025-07-28 | 13F | Mutual Advisors, LLC | 22 890 | 22,41 | 296 | 43,00 | ||||
| 2025-04-14 | 13F | BCS Wealth Management | 0 | −100,00 | 0 | |||||
| 2025-08-12 | 13F | OneAscent Financial Services LLC | 69 020 | 11,47 | 1 | |||||
| 2025-08-14 | 13F | CoreCap Advisors, LLC | 9 575 | 8,17 | 117 | 14,71 | ||||
| 2025-08-11 | 13F | Blue Bell Private Wealth Management, Llc | 368 | 0,00 | 5 | 0,00 | ||||
| 2025-08-11 | 13F | TD Waterhouse Canada Inc. | 168 004 | 39,26 | 2 052 | 48,16 | ||||
| 2025-07-24 | 13F | Blair William & Co/il | 58 166 | −11,86 | 712 | −7,06 | ||||
| 2025-08-13 | 13F/A | Claudia M.p. Batlle, Crp (r) Llc | 68 777 | 0,36 | 842 | 5,92 | ||||
| 2025-07-28 | 13F | Harbour Investments, Inc. | 179 737 | 5,87 | 2 200 | 11,68 | ||||
| 2025-07-16 | 13F | RWM Asset Management, LLC | 32 085 | 2,90 | 393 | 8,59 | ||||
| 2025-08-12 | 13F | Blueprint Financial Advisors LLC | 503 561 | 12,03 | 6 164 | 18,20 | ||||
| 2025-08-14 | 13F | Cohen & Steers, Inc. | 440 145 | 36,21 | 5 | 66,67 | ||||
| 2025-07-31 | 13F | Sumitomo Mitsui Trust Holdings, Inc. | 37 000 | 453 | ||||||
| 2025-05-14 | 13F | Flow Traders U.s. Llc | 0 | −100,00 | 0 | |||||
| 2025-05-15 | 13F | Farringdon Capital, Ltd. | 0 | −100,00 | 0 | |||||
| 2025-07-22 | 13F | Merit Financial Group, LLC | 44 842 | 0,00 | 549 | 5,38 | ||||
| 2025-07-25 | 13F | Bill Few Associates, Inc. | 22 150 | 0,00 | 271 | 5,86 | ||||
| 2025-07-30 | 13F | Brookstone Capital Management | 486 451 | 14,07 | 5 954 | 20,38 | ||||
| 2025-07-30 | 13F | Eqis Capital Management, Inc. | 39 906 | −21,63 | 488 | −17,29 | ||||
| 2025-08-05 | 13F | K.J. Harrison & Partners Inc | 460 765 | 56,00 | 5 637 | 63,98 | ||||
| 2025-08-14 | 13F/A | Barclays Plc | 229 639 | 367,16 | 3 | |||||
| 2025-07-17 | 13F | Sound Income Strategies, LLC | 1 000 | 0,00 | 12 | 9,09 | ||||
| 2025-07-09 | 13F | Fiduciary Alliance LLC | 14 210 | 0,00 | 174 | 5,49 | ||||
| 2025-07-14 | 13F | E&G Advisors, LP | 14 500 | 0,00 | 177 | 5,36 | ||||
| 2025-08-05 | 13F | Wakefield Asset Management LLLP | 81 780 | 1 001 | ||||||
| 2025-08-13 | 13F | Channing Global Advisors, Llc | 208 | 0,00 | 3 | 0,00 | ||||
| 2025-08-14 | 13F | Great Valley Advisor Group, Inc. | 245 669 | −0,67 | 3 007 | 4,85 | ||||
| 2025-07-15 | 13F | Palumbo Wealth Management LLC | 0 | −100,00 | 0 | |||||
| 2025-07-16 | 13F | Novem Group | 14 300 | 0,00 | 175 | 6,06 | ||||
| 2025-08-13 | 13F | New Harbor Financial Group, LLC | 153 800 | 10,67 | 1 883 | 16,75 | ||||
| 2025-08-14 | 13F | Manatuck Hill Partners, LLC | 450 000 | −35,71 | 5 508 | −32,17 | ||||
| 2025-08-14 | 13F/A | Perritt Capital Management Inc | 3 000 | 0,00 | 37 | 5,88 | ||||
| 2025-07-29 | 13F | Latitude Advisors, LLC | 32 369 | 3,19 | 396 | 9,09 | ||||
| 2025-07-17 | 13F | Peoples Financial Services Corp. | 5 000 | 0,00 | 61 | 5,17 | ||||
| 2025-05-12 | 13F | Sandy Spring Bank | 2 629 | 0,00 | 30 | 20,00 | ||||
| 2025-07-21 | 13F/A | Abacus Planning Group, Inc. | 435 540 | 0,00 | 5 331 | 5,52 | ||||
| 2025-08-05 | 13F | Financial Sense Advisors, Inc. | 416 863 | 114,50 | 5 102 | 126,35 | ||||
| 2025-08-12 | 13F | CIBC Private Wealth Group, LLC | 24 260 | −7,26 | 297 | 12,55 | ||||
| 2025-08-14 | 13F | SWAN Capital LLC | 333 | 0,00 | 4 | 33,33 | ||||
| 2025-08-14 | 13F | Headlands Technologies LLC | 1 803 | 22 | ||||||
| 2025-07-17 | 13F | G&S Capital LLC | 81 059 | 1,52 | 992 | 7,13 | ||||
| 2025-08-08 | 13F | Financial Gravity Companies, Inc. | 36 | 0 | ||||||
| 2025-08-12 | 13F | Weitzel Financial Services, Inc. | 0 | −100,00 | 0 | |||||
| 2025-07-30 | 13F | Pacific Wealth Management | 15 034 | 0,00 | 184 | 5,75 | ||||
| 2025-08-11 | 13F | Fore Capital, LLC | 0 | −100,00 | 0 | |||||
| 2025-08-14 | 13F | Mml Investors Services, Llc | 162 149 | 1,19 | 2 | 0,00 | ||||
| 2025-08-14 | 13F | Wells Fargo & Company/mn | 1 777 636 | 7,92 | 21 758 | 13,87 | ||||
| 2025-07-22 | 13F | David Wealth Management LLC | 34 200 | 0,00 | 419 | 5,56 | ||||
| 2025-07-22 | 13F | DAVENPORT & Co LLC | 173 821 | −8,10 | 2 128 | −3,01 | ||||
| 2025-07-30 | 13F | Capital Wealth Alliance, LLC | 2 450 302 | 1,19 | 29 989 | 6,76 | ||||
| 2025-07-22 | 13F | Investors Asset Management Of Georgia Inc /ga/ /adv | 30 000 | −1,70 | 367 | 3,67 | ||||
| 2025-08-07 | 13F | Parkside Financial Bank & Trust | 1 500 | 114,29 | 18 | 125,00 | ||||
| 2025-08-06 | 13F | SOUTH STATE Corp | 36 675 | 0,00 | 449 | 5,41 | ||||
| 2025-05-15 | 13F | Glenmede Trust Co Na | 342 718 | 0,00 | 3 976 | 20,20 | ||||
| 2025-07-23 | 13F | Pure Portfolios Holdings Llc | 14 479 | 26,18 | 177 | 33,08 | ||||
| 2025-08-13 | 13F | Cresset Asset Management, LLC | 34 519 | 0,00 | 423 | 5,50 | ||||
| 2025-08-04 | 13F | Barnes Dennig Private Wealth Management LLC | 3 510 | 0,00 | 43 | 5,00 | ||||
| 2025-08-14 | 13F | Dagco, Inc. | 36 728 | −38,32 | 450 | −34,93 | ||||
| 2025-07-09 | 13F | Client First Investment Management LLC | 0 | −100,00 | 0 | −100,00 | ||||
| 2025-07-15 | 13F | North Star Investment Management Corp. | 81 510 | 0,00 | 998 | 5,50 | ||||
| 2025-08-14 | 13F | EP Wealth Advisors, Inc. | 20 325 | 2,26 | 249 | 7,83 | ||||
| 2025-08-11 | 13F | Waratah Capital Advisors Ltd. | 27 777 | 340 | ||||||
| 2025-07-08 | 13F | Gradient Investments LLC | 299 837 | 0,53 | 3 670 | 6,10 | ||||
| 2025-07-15 | 13F | Main Street Group, LTD | 42 700 | −2,51 | 523 | 2,76 | ||||
| 2025-07-30 | 13F | Whittier Trust Co Of Nevada Inc | 13 300 | 0,00 | 163 | 5,19 | ||||
| 2025-08-11 | 13F | Nations Financial Group Inc, /ia/ /adv | 25 300 | 1,12 | 310 | 6,55 | ||||
| 2025-07-29 | 13F | Mountain Capital Investment Advisors, Inc | 17 630 | 2,84 | 216 | 11,40 | ||||
| 2025-07-25 | 13F | LRI Investments, LLC | 1 750 | 0,00 | 21 | 5,00 | ||||
| 2025-08-11 | 13F | Compass Capital Corp /ma/ /adv | 41 001 | 20,77 | 525 | 41,13 | ||||
| 2025-08-12 | 13F | BlackRock, Inc. | 21 326 175 | −17,42 | 261 032 | −12,86 | ||||
| 2025-08-14 | 13F | Mountain Lake Investment Management LLC | 63 476 | 111,59 | 777 | 122,99 | ||||
| 2025-07-17 | 13F | CWA Asset Management Group, LLC | 79 867 | 0,00 | 978 | 5,51 | ||||
| 2025-08-08 | 13F | Schwarz Dygos Wheeler Investment Advisors Llc | 88 774 | 1,12 | 1 086 | 6,68 | ||||
| 2025-08-05 | 13F | Key FInancial Inc | 1 953 | 0,00 | 24 | 4,55 | ||||
| 2025-08-07 | 13F | Flagship Wealth Advisors, Llc | 1 386 | 0,00 | 17 | 0,00 | ||||
| 2025-08-12 | 13F | LPL Financial LLC | 2 705 147 | 8,37 | 33 111 | 14,35 | ||||
| 2025-08-14 | 13F | Ausdal Financial Partners, Inc. | 74 872 | 23,98 | 916 | 30,86 | ||||
| 2025-08-19 | 13F | National Asset Management, Inc. | 12 750 | 0,00 | 156 | 26,83 | ||||
| 2025-08-05 | 13F | American Capital Advisory, LLC | 157 530 | −0,72 | 1 928 | 4,78 | ||||
| 2025-08-14 | 13F | UBS Group AG | 437 766 | 5 438,54 | 5 358 | 5 787,91 | ||||
| 2025-08-05 | 13F | Flynn Zito Capital Management, Llc | 77 704 | 0,00 | 951 | 5,55 | ||||
| 2025-07-15 | 13F | Bfsg, Llc | 240 | 3 | ||||||
| 2025-08-08 | 13F | New England Capital Financial Advisors LLC | 125 | 0,00 | 2 | 0,00 | ||||
| 2025-07-24 | 13F | Cyndeo Wealth Partners, LLC | 1 051 303 | 1,95 | 12 868 | 7,57 | ||||
| 2025-08-14 | 13F | Evergreen Capital Management Llc | 755 879 | 2,21 | 9 252 | 7,85 | ||||
| 2025-08-12 | 13F | Archer Investment Corp | 8 | 0,00 | 0 | |||||
| 2025-05-14 | 13F | Caitlin John, LLC | 0 | −100,00 | 0 | |||||
| 2025-07-31 | 13F | City State Bank | 5 000 | 0,00 | 61 | 5,17 | ||||
| 2025-08-07 | 13F | Monaco Asset Management SAM | 0 | −100,00 | 0 | |||||
| 2025-07-08 | 13F | Nbc Securities, Inc. | 1 600 | 0,00 | 0 | |||||
| 2025-07-23 | 13F | Guild Investment Management, Inc. | 10 500 | 0,00 | 129 | 5,79 | ||||
| 2025-07-08 | 13F | Bard Financial Services, Inc. | 14 950 | 0,00 | 183 | 5,20 | ||||
| 2025-07-29 | 13F | Robinson Value Management, Ltd. | 19 696 | 0,00 | 241 | 5,70 | ||||
| 2025-08-12 | 13F | Atlas Capital Advisors Llc | 18 000 | 0,00 | 220 | 5,77 | ||||
| 2025-09-04 | 13F/A | Advisor Group Holdings, Inc. | 1 400 485 | 11,21 | 17 142 | 17,35 | ||||
| 2025-05-21 | 13F | Bluefin Capital Management, Llc | 0 | −100,00 | 0 | |||||
| 2025-08-14 | 13F | Atomi Financial Group, Inc. | 115 620 | 2,13 | 1 415 | 7,77 | ||||
| 2025-07-17 | 13F | Janney Montgomery Scott LLC | 11 492 | −97,84 | 0 | −100,00 | ||||
| 2025-08-12 | 13F | MAI Capital Management | 7 982 | 49,70 | 98 | 59,02 | ||||
| 2025-08-11 | 13F | Alps Advisors Inc | 1 395 549 | 82,72 | 17 082 | 92,81 | ||||
| 2025-08-06 | 13F | Menlo Advisors Llc | 253 380 | 3 | ||||||
| 2025-08-14 | 13F | Barometer Capital Management Inc. | 56 300 | −43,81 | 689 | −40,71 |