Grundläggande statistik
| Institutionella ägare | 251 total, 251 long only, 0 short only, 0 long/short - change of 0,40% MRQ |
| Genomsnittlig portföljallokering | 0.4730 % - change of −11,05% MRQ |
| Institutionella aktier (lång) | 48 759 114 (ex 13D/G) - change of −1,50MM shares −2,98% MRQ |
| Institutionellt värde (lång) | $ 2 833 802 USD ($1000) |
Institutionellt ägande och aktieägare
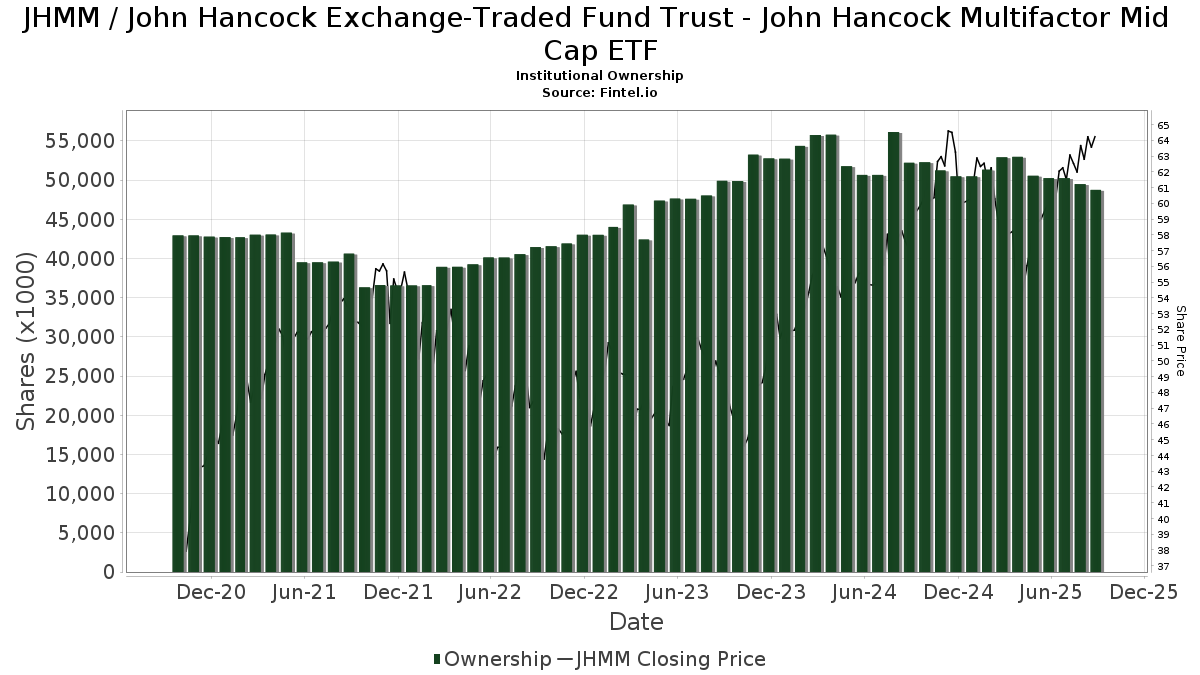
John Hancock Exchange-Traded Fund Trust - John Hancock Multifactor Mid Cap ETF (US:JHMM) har 251 Institutionella ägare och aktieägare som har lämnat in 13D/G- eller 13F-formulär till Securities Exchange Commission (SEC). Dessa institut innehar totalt 48,759,114 aktier. Största aktieägare inkluderar Ameriprise Financial Inc, LPL Financial LLC, Wells Fargo & Company/mn, Manufacturers Life Insurance Company, The, Morgan Stanley, Raymond James Financial Inc, UBS Group AG, JAIZX - Managed Volatility Growth Portfolio NAV, Commonwealth Equity Services, Llc, and Northwestern Mutual Wealth Management Co .
John Hancock Exchange-Traded Fund Trust - John Hancock Multifactor Mid Cap ETF (ARCA:JHMM) Institutionell ägarstruktur visar institutioners och fonders nuvarande positioner i företaget, samt de senaste förändringarna i positionernas storlek. Större aktieägare kan vara enskilda investerare, fonder, hedgefonder eller institutioner. Bilaga 13D visar att investeraren äger (eller ägde) mer än 5% av företaget och avser (eller avsåg) att aktivt eftersträva en förändring av affärsstrategin. Schedule 13G indikerar en passiv investering på över 5%.
The share price as of September 16, 2025 is 64,36 / share. Previously, on September 17, 2024, the share price was 58,94 / share. This represents an increase of 9,19% over that period.
Fondsentimentets poäng
Fondsentimentet poängen(fka Ägarackumulation-poäng) visar vilka aktier som är mest köpta av fonder. Det är resultatet av en sofistikerad kvantitativ flerfaktormodell som identifierar företag med de högsta nivåerna av institutionell ackumulering. Poängsättningsmodellen använder en kombination av den totala ökningen av redovisade ägare, förändringarna i portföljallokeringarna för dessa ägare och andra mått. Siffran sträcker sig från 0 till 100, där högre siffror indikerar en högre nivå av ackumulering i förhållande till sina konkurrenter, och 50 är genomsnittet.
Uppdateringsfrekvens: Dagligen
Se Ownership Explorer, som innehåller en lista över de högst rankade företagen.
Institutionell sälj/köp-kvot
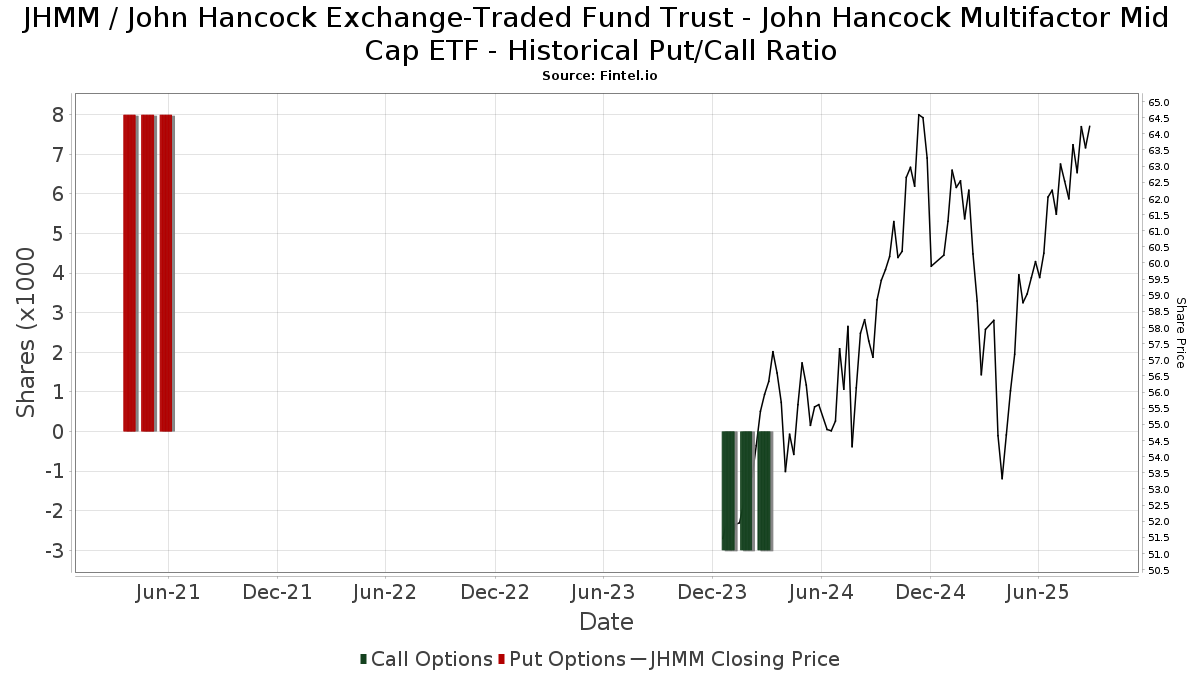
Förutom att rapportera vanliga eget kapital- och skuldemissioner måste institutioner med mer än 100MM tillgångar under förvaltning också avslöja sina innehav av sälj- och köpoptioner. Eftersom säljoptioner i allmänhet indikerar ett negativt sentiment och köpoptioner indikerar ett positivt sentiment, kan vi få en uppfattning om det övergripande institutionella sentimentet genom att plotta förhållandet mellan säljoptioner och köpoptioner. Diagrammet till höger visar det historiska förhållandet mellan sälj- och köpoptioner för detta instrument.
Genom att använda sälj/köp-kvoten som en indikator på aktieägarnas sentiment undviker man en av de största bristerna med att använda det totala institutionella ägandet, nämligen att en betydande del av de förvaltade tillgångarna investeras passivt för att följa index. Passivt förvaltade fonder köper vanligtvis inte optioner, så indikatorn för sälj/köp-kvoten ger en bättre bild av stämningen i aktivt förvaltade fonder.
13F- och NPORT-arkiveringar
Detaljer om 13F-arkiveringar är gratis. Detaljer om NP-arkiveringar kräver ett premiummedlemskap. Gröna rader indikerar nya positioner. Röda rader indikerar stängda positioner. Klicka på länk symbolen för att se hela transaktionshistoriken.
Uppgradera
för att låsa upp premiumdata och exportera till Excel ![]() .
.
| Fil Datum | Källa | Investerare | Typ | Genomsnittligt pris (beräknat) |
Aktier | Δ Aktier (%) |
Rapporterat värde (1000 USD) |
Δ Värde (%) |
Portföljallokering (%) |
|
|---|---|---|---|---|---|---|---|---|---|---|
| 2025-07-08 | 13F | Choice Wealth Advisors, LLC | 198 734 | −0,37 | 12 149 | 6,29 | ||||
| 2025-07-29 | 13F | Chicago Partners Investment Group LLC | 60 643 | 10,24 | 3 824 | 21,63 | ||||
| 2025-07-25 | 13F | Sovereign Financial Group, Inc. | 13 481 | 0,00 | 824 | 6,74 | ||||
| 2025-08-12 | 13F/A | Cozad Asset Management Inc | 8 860 | 0,00 | 542 | 6,71 | ||||
| 2025-08-14 | 13F | Manufacturers Life Insurance Company, The | 3 163 181 | −4,63 | 193 365 | 1,74 | ||||
| 2025-08-06 | 13F | Vantage Financial Partners, LLC | 13 665 | 0,79 | 835 | 7,60 | ||||
| 2025-08-14 | 13F | Comerica Bank | 23 288 | −26,51 | 1 424 | −21,60 | ||||
| 2025-07-21 | 13F | Synergy Financial Management, LLC | 6 256 | 0,00 | 382 | 6,70 | ||||
| 2025-08-07 | 13F | Rossmore Private Capital | 15 421 | 0,00 | 943 | 6,68 | ||||
| 2025-07-14 | 13F | Farmers & Merchants Investments Inc | 105 | 0,00 | 6 | 0,00 | ||||
| 2025-08-12 | 13F | PSI Advisors, LLC | 0 | −100,00 | 0 | |||||
| 2025-07-23 | 13F | Indiana Trust & Investment Management CO | 0 | −100,00 | 0 | |||||
| 2025-08-19 | 13F | Anchor Investment Management, LLC | 385 | 0,00 | 24 | 4,55 | ||||
| 2025-07-23 | 13F | SpringVest Wealth Management LLC | 21 379 | −15,85 | 1 307 | −10,24 | ||||
| 2025-08-12 | 13F | AlphaCore Capital LLC | 83 280 | −0,12 | 5 091 | 6,55 | ||||
| 2025-07-28 | 13F | Private Wealth Asset Management, LLC | 1 143 | 7,12 | 70 | 13,11 | ||||
| 2025-07-17 | 13F | Coastline Trust Co | 9 929 | 0,00 | 607 | 6,69 | ||||
| 2025-07-18 | 13F | Truist Financial Corp | 48 117 | −85,93 | 2 941 | −84,99 | ||||
| 2025-08-14 | 13F | Royal Bank Of Canada | 1 497 555 | 0,96 | 91 546 | 7,71 | ||||
| 2025-08-08 | 13F | Intrua Financial, LLC | 0 | −100,00 | 0 | |||||
| 2025-07-22 | 13F | Mascoma Wealth Management LLC | 346 | 0,00 | 21 | 10,53 | ||||
| 2025-08-04 | 13F | Arkadios Wealth Advisors | 48 786 | 4,21 | 2 982 | 11,19 | ||||
| 2025-08-08 | 13F | Larson Financial Group LLC | 73 708 | −73,74 | 4 506 | −71,99 | ||||
| 2025-07-14 | 13F | Bank & Trust Co | 1 188 | 0,00 | 73 | 5,88 | ||||
| 2025-08-14 | 13F | Benjamin Edwards Inc | 18 800 | 11,90 | 1 149 | 19,44 | ||||
| 2025-08-29 | 13F | Evolution Wealth Management Inc. | 1 000 | 61 | ||||||
| 2025-08-13 | 13F | Flow Traders U.s. Llc | 0 | −100,00 | 0 | |||||
| 2025-07-18 | 13F | SigFig Wealth Management, LLC | 12 521 | −1,11 | 762 | 5,69 | ||||
| 2025-08-14 | 13F | Bank Of America Corp /de/ | 938 551 | 2,75 | 57 374 | 9,62 | ||||
| 2025-08-14 | 13F | Paragon Private Wealth Management, LLC | 33 872 | −7,35 | 2 071 | −1,15 | ||||
| 2025-08-05 | 13F | Plante Moran Financial Advisors, LLC | 0 | −100,00 | 0 | |||||
| 2025-04-29 | 13F | Resources Investment Advisors, LLC. | 0 | −100,00 | 0 | |||||
| 2025-08-14 | 13F | Synovus Financial Corp | 253 345 | −3,79 | 15 493 | 2,68 | ||||
| 2025-07-09 | 13F | WealthCare Investment Partners, LLC | 0 | −100,00 | 0 | |||||
| 2025-07-09 | 13F | VisionPoint Advisory Group, LLC | 3 722 | 228 | ||||||
| 2025-08-01 | 13F | Envestnet Asset Management Inc | 344 941 | −44,34 | 21 086 | −40,62 | ||||
| 2025-07-15 | 13F | Avaii Wealth Management, Llc | 21 411 | −2,40 | 1 309 | 4,06 | ||||
| 2025-08-06 | 13F | 360 Financial, Inc. | 5 206 | 0,00 | 318 | 6,71 | ||||
| 2025-08-05 | 13F | Gilbert & Cook, Inc. | 927 280 | 7,87 | 56 685 | 15,08 | ||||
| 2025-05-05 | 13F | PCA Investment Advisory Services Inc. | 0 | −100,00 | 0 | |||||
| 2025-08-04 | 13F | Assetmark, Inc | 7 697 | −5,63 | 471 | 0,64 | ||||
| 2025-07-07 | 13F | Investors Research Corp | 536 | 0,00 | 33 | 6,67 | ||||
| 2025-08-08 | 13F | Kingsview Wealth Management, LLC | 45 175 | 35,50 | 2 762 | 44,55 | ||||
| 2025-08-14 | 13F | TCG Advisory Services, LLC | 0 | −100,00 | 0 | |||||
| 2025-08-05 | 13F | GPS Wealth Strategies Group, LLC | 660 | −55,44 | 40 | −52,38 | ||||
| 2025-08-13 | 13F | Jones Financial Companies Lllp | 1 112 603 | 39,69 | 67 724 | 49,30 | ||||
| 2025-05-14 | 13F | WCG Wealth Advisors LLC | 0 | −100,00 | 0 | |||||
| 2025-08-05 | 13F | Westside Investment Management, Inc. | 107 | 0,00 | 7 | 0,00 | ||||
| 2025-07-08 | 13F | Baker Ellis Asset Management LLC | 205 511 | −1,46 | 12 563 | 5,12 | ||||
| 2025-07-30 | 13F/A | KPP Advisory Services LLC | 266 086 | 10,89 | 16 266 | 18,31 | ||||
| 2025-08-12 | 13F | Jpmorgan Chase & Co | 52 814 | 16,90 | 3 229 | 24,73 | ||||
| 2025-07-30 | 13F | D.a. Davidson & Co. | 32 850 | −3,74 | 2 008 | 2,71 | ||||
| 2025-08-11 | 13F | Forge Financial Services LLC | 95 417 | 2,15 | 5 841 | 9,12 | ||||
| 2025-07-31 | 13F/A | Interchange Capital Partners, LLC | 34 617 | 16,13 | 2 116 | 23,89 | ||||
| 2025-07-22 | 13F | Chung Wu Investment Group, LLC | 366 | 22 | ||||||
| 2025-08-06 | 13F | Hoxton Planning & Management, LLC | 3 748 | 0,00 | 229 | 7,01 | ||||
| 2025-08-05 | 13F | Frederick Financial Consultants, LLC | 54 862 | 7,01 | 3 354 | 14,16 | ||||
| 2025-05-02 | 13F | Transcendent Capital Group LLC | 0 | −100,00 | 0 | |||||
| 2025-07-16 | 13F | BankPlus Wealth Management LLC | 27 146 | 8,87 | 1 659 | 16,18 | ||||
| 2025-07-22 | 13F | DAVENPORT & Co LLC | 42 577 | 16,23 | 2 603 | 24,02 | ||||
| 2025-07-23 | 13F | Bellevue Asset Management, Llc | 729 | 0,00 | 45 | 7,32 | ||||
| 2025-07-15 | 13F | Fifth Third Bancorp | 1 525 | 0,00 | 93 | 6,90 | ||||
| 2025-08-11 | 13F | Private Advisor Group, LLC | 1 075 550 | −4,48 | 65 748 | 1,90 | ||||
| 2025-08-13 | 13F | Cresset Asset Management, LLC | 4 876 | 0,00 | 298 | 6,81 | ||||
| 2025-08-14 | 13F | Keystone Financial Services, LLC | 43 635 | −2,73 | 2 667 | 3,77 | ||||
| 2025-08-11 | 13F | Principal Securities, Inc. | 1 300 | 0,00 | 79 | 2,60 | ||||
| 2025-08-15 | 13F | Tower Research Capital LLC (TRC) | 12 233 | −8,80 | 748 | −2,73 | ||||
| 2025-08-05 | 13F | Atlas Wealth LLC | 59 467 | −9,28 | 3 669 | −2,34 | ||||
| 2025-07-16 | 13F | Stephenson National Bank & Trust | 466 | 13,11 | 28 | 21,74 | ||||
| 2025-07-30 | 13F | Crewe Advisors LLC | 965 | 0,00 | 59 | 5,45 | ||||
| 2025-08-13 | 13F | Renaissance Technologies Llc | 20 600 | −5,19 | 1 259 | 1,21 | ||||
| 2025-07-22 | 13F | Simplicity Wealth,LLC | 69 144 | 289,74 | 4 227 | 315,94 | ||||
| 2025-08-29 | NP | JAIYX - Managed Volatility Balanced Portfolio NAV | 1 039 862 | −3,63 | 63 567 | 2,81 | ||||
| 2025-07-30 | 13F | Eqis Capital Management, Inc. | 56 994 | −5,69 | 3 484 | 0,64 | ||||
| 2025-08-13 | 13F | MONECO Advisors, LLC | 26 422 | 0,09 | 1 615 | 6,81 | ||||
| 2025-08-12 | 13F | Private Management Group Inc | 3 404 | 208 | ||||||
| 2025-08-14 | 13F | Citadel Advisors Llc | 28 433 | 196,05 | 1 738 | 216,00 | ||||
| 2025-07-24 | 13F | Capital Advisors, Ltd. LLC | 57 885 | 0,01 | 4 | 0,00 | ||||
| 2025-05-02 | 13F | Graypoint LLC | 0 | −100,00 | 0 | −100,00 | ||||
| 2025-08-14 | 13F | Goodwin Investment Advisory | 7 154 | 437 | ||||||
| 2025-08-05 | 13F | Sigma Planning Corp | 4 362 | 267 | ||||||
| 2025-08-08 | 13F | Good Life Advisors, LLC | 35 267 | −25,20 | 2 156 | −20,21 | ||||
| 2025-09-04 | 13F/A | Advisor Group Holdings, Inc. | 245 736 | −2,60 | 15 025 | 3,91 | ||||
| 2025-08-14 | 13F | Fwl Investment Management, Llc | 0 | −100,00 | 0 | |||||
| 2025-07-18 | 13F | Foundry Financial Group, Inc. | 5 451 | −94,17 | 333 | −93,78 | ||||
| 2025-08-14 | 13F | Mercer Global Advisors Inc /adv | 20 730 | 3,41 | 1 267 | 10,37 | ||||
| 2025-04-23 | 13F | GHP Investment Advisors, Inc. | 0 | −100,00 | 0 | |||||
| 2025-08-11 | 13F | WPG Advisers, LLC | 58 047 | −2,97 | 3 548 | 3,53 | ||||
| 2025-07-25 | 13F | Priebe Wealth Holdings LLC | 3 353 | 205 | ||||||
| 2025-08-08 | 13F | Thoroughbred Financial Services, Llc | 0 | −100,00 | 0 | |||||
| 2025-07-08 | 13F | Zrc Wealth Management, Llc | 30 834 | 34,00 | 1 885 | 42,94 | ||||
| 2025-08-14 | 13F | Visionary Wealth Advisors | 8 770 | 31,70 | 536 | 40,68 | ||||
| 2025-08-14 | 13F | Graney & King, LLC | 65 944 | 9,35 | 4 031 | 16,67 | ||||
| 2025-07-15 | 13F | Signet Financial Management, Llc | 5 891 | −29,77 | 360 | −25,00 | ||||
| 2025-07-29 | 13F | Liberty Square Wealth Partners Llc | 18 013 | −3,28 | 1 101 | 3,19 | ||||
| 2025-08-12 | 13F | Weaver Consulting Group | 5 828 | 0,00 | 356 | 6,91 | ||||
| 2025-08-15 | 13F | Captrust Financial Advisors | 94 785 | −3,93 | 5 794 | 2,49 | ||||
| 2025-04-22 | 13F | Castleview Partners, Llc | 0 | −100,00 | 0 | |||||
| 2025-07-25 | 13F | Cwm, Llc | 7 666 | 1,78 | 0 | |||||
| 2025-08-06 | 13F | Golden State Wealth Management, LLC | 391 | −34,06 | 24 | −30,30 | ||||
| 2025-07-15 | 13F | Financial Management Professionals, Inc. | 870 301 | 4,73 | 53 200 | 11,73 | ||||
| 2025-08-19 | 13F | Advisory Services Network, LLC | 7 433 | 463 | ||||||
| 2025-08-12 | 13F | Waterloo Capital, L.P. | 18 067 | −24,48 | 1 104 | −19,42 | ||||
| 2025-07-02 | 13F | Dentgroup LLC | 0 | −100,00 | 0 | |||||
| 2025-07-18 | 13F | Cooper Financial Group | 32 247 | −3,02 | 1 971 | 3,46 | ||||
| 2025-07-23 | 13F | Valmark Advisers, Inc. | 38 474 | 2,17 | 2 352 | 8,99 | ||||
| 2025-07-09 | 13F | Fragasso Group Inc. | 100 717 | −6,70 | 6 157 | −0,47 | ||||
| 2025-07-21 | 13F | Future Financial Wealth Managment LLC | 333 | 0,00 | 20 | 5,26 | ||||
| 2025-08-05 | 13F | Tme Financial, Inc. | 29 572 | −71,73 | 1 808 | −69,85 | ||||
| 2025-07-17 | 13F | Elwood & Goetz Wealth Advisory Group, LLC | 4 745 | 290 | ||||||
| 2025-08-14 | 13F | Betterment LLC | 22 036 | 0,97 | 1 | 0,00 | ||||
| 2025-07-29 | 13F | Stratos Wealth Partners, LTD. | 225 739 | 2,16 | 13 799 | 8,99 | ||||
| 2025-08-06 | 13F | Rialto Wealth Management, LLC | 1 175 | 0,00 | 72 | 5,97 | ||||
| 2025-08-12 | 13F | Eldridge Investment Advisors, Inc. | 174 565 | −5,98 | 10 671 | 0,30 | ||||
| 2025-07-15 | 13F | SJS Investment Consulting Inc. | 1 402 | 0,00 | 86 | 6,25 | ||||
| 2025-08-13 | 13F | Russell Investments Group, Ltd. | 184 | 62,83 | 11 | 83,33 | ||||
| 2025-07-09 | 13F | Dynamic Advisor Solutions LLC | 422 933 | 2,14 | 25 854 | 8,96 | ||||
| 2025-08-05 | 13F | Huntington National Bank | 14 | −77,97 | ||||||
| 2025-07-17 | 13F | HB Wealth Management, LLC | 10 439 | −5,52 | 638 | 0,79 | ||||
| 2025-07-24 | 13F | Jfs Wealth Advisors, Llc | 818 | 0,49 | 50 | 6,52 | ||||
| 2025-05-12 | 13F | Independent Advisor Alliance | 0 | −100,00 | 0 | |||||
| 2025-07-15 | 13F | Well Done, LLC | 0 | −100,00 | 0 | |||||
| 2025-08-05 | 13F | Simplex Trading, Llc | 84 | 0 | ||||||
| 2025-05-05 | 13F | Csenge Advisory Group | 0 | −100,00 | 0 | |||||
| 2025-07-23 | 13F | BankPlus Trust Department | 126 051 | −0,03 | 7 705 | 6,66 | ||||
| 2025-07-16 | 13F | ORG Partners LLC | 3 365 | 300,12 | 208 | 331,25 | ||||
| 2025-04-29 | 13F | Lee Danner & Bass Inc | 0 | −100,00 | 0 | |||||
| 2025-05-15 | 13F | Human Investing LLC | 0 | −100,00 | 0 | |||||
| 2025-08-13 | 13F | Beacon Pointe Advisors, LLC | 13 067 | 31,74 | 799 | 40,49 | ||||
| 2025-08-12 | 13F | Cornerstone Wealth Management, LLC | 15 405 | −8,62 | 942 | −2,49 | ||||
| 2025-08-12 | 13F | Steward Partners Investment Advisory, Llc | 24 037 | −0,33 | 1 469 | 6,37 | ||||
| 2025-08-07 | 13F | PFG Advisors | 82 217 | 10,93 | 5 026 | 18,35 | ||||
| 2025-08-14 | 13F | GWM Advisors LLC | 136 398 | 99,67 | 8 338 | 113,03 | ||||
| 2025-07-17 | 13F | Nelson, Van Denburg & Campbell Wealth Management Group, LLC | 4 224 | −6,78 | 258 | −0,39 | ||||
| 2025-07-18 | 13F | Wetzel Investment Advisors, Inc. | 41 995 | 2 567 | ||||||
| 2025-08-11 | 13F | Perennial Investment Advisors, LLC | 5 411 | 0,00 | 331 | 6,45 | ||||
| 2025-08-14 | 13F | Palo Alto Wealth Advisors, Llc | 120 372 | −31,41 | 7 358 | −30,04 | ||||
| 2025-08-13 | 13F | Congress Wealth Management LLC / DE / | 15 971 | 113,57 | 976 | 127,51 | ||||
| 2025-08-12 | 13F | BlackRock, Inc. | 598 | 0,00 | 37 | 5,88 | ||||
| 2025-07-29 | 13F | Harbor Asset Planning, Inc. | 10 064 | 615 | ||||||
| 2025-08-29 | NP | JAIZX - Managed Volatility Growth Portfolio NAV | 1 889 229 | −5,43 | 115 489 | 0,89 | ||||
| 2025-08-13 | 13F | Summit Wealth Group Llc / Co | 30 775 | 1 881 | ||||||
| 2025-07-21 | 13F | Ameriflex Group, Inc. | 1 057 | −53,58 | 64 | −50,77 | ||||
| 2025-08-12 | 13F | MAI Capital Management | 200 | 0,00 | 12 | 9,09 | ||||
| 2025-08-11 | 13F | Advisor Resource Council | 0 | −100,00 | 0 | |||||
| 2025-08-26 | 13F/A | Thrivent Financial For Lutherans | 31 104 | −95,14 | 2 | −97,50 | ||||
| 2025-08-12 | 13F | Proequities, Inc. | 0 | 0 | ||||||
| 2025-07-17 | 13F | City Holding Co | 1 970 | 0,00 | 120 | 7,14 | ||||
| 2025-08-12 | 13F | FreeGulliver LLC | 19 751 | −11,79 | 1 207 | −5,85 | ||||
| 2025-07-29 | NP | EBI - Longview Advantage ETF | 0 | −100,00 | 0 | −100,00 | ||||
| 2025-08-04 | 13F | Bay Colony Advisory Group, Inc d/b/a Bay Colony Advisors | 16 179 | 7,54 | 989 | 15,42 | ||||
| 2025-08-14 | 13F | Ameriprise Financial Inc | 4 577 600 | −3,31 | 279 914 | 3,31 | ||||
| 2025-08-13 | 13F | IAG Wealth Partners, LLC | 48 648 | −31,38 | 2 974 | −26,81 | ||||
| 2025-05-01 | 13F | Bleakley Financial Group, LLC | 0 | −100,00 | 0 | |||||
| 2025-08-05 | 13F | Fourth Dimension Wealth, LLC | 702 | −12,47 | 43 | −6,67 | ||||
| 2025-08-14 | 13F | Integrated Wealth Concepts LLC | 190 115 | 1,76 | 11 622 | 8,56 | ||||
| 2025-08-12 | 13F | O'shaughnessy Asset Management, Llc | 7 799 | −5,08 | 477 | 1,28 | ||||
| 2025-07-17 | 13F | Janney Montgomery Scott LLC | 8 041 | 31,20 | 0 | |||||
| 2025-08-13 | 13F | Johnson Financial Group, Inc. | 67 | 0,00 | 4 | 33,33 | ||||
| 2025-08-14 | 13F | Wells Fargo & Company/mn | 3 560 730 | 1,07 | 217 667 | 7,82 | ||||
| 2025-08-04 | 13F | JDM Financial Group LLC | 213 | 0,00 | 13 | 8,33 | ||||
| 2025-08-18 | 13F | Geneos Wealth Management Inc. | 540 | 0,00 | 33 | 10,00 | ||||
| 2025-07-24 | 13F | Blair William & Co/il | 10 265 | 0,21 | 627 | 7,00 | ||||
| 2025-07-22 | 13F | D.B. Root & Company, LLC | 21 079 | −15,06 | 1 289 | −9,36 | ||||
| 2025-08-14 | 13F | UBS Group AG | 2 177 650 | 0,06 | 133 120 | 6,75 | ||||
| 2025-07-14 | 13F | Signature Securities Group Corporation | 45 950 | −3,27 | 2 809 | 3,20 | ||||
| 2025-05-06 | 13F | Greenwood Gearhart Inc | 0 | −100,00 | 0 | |||||
| 2025-07-30 | 13F | Onyx Bridge Wealth Group LLC | 38 533 | −18,41 | 2 356 | −12,97 | ||||
| 2025-08-06 | 13F | Prospera Financial Services Inc | 4 442 | 17,45 | 272 | 25,46 | ||||
| 2025-07-31 | 13F | Cambridge Investment Research Advisors, Inc. | 334 383 | −6,72 | 20 | 0,00 | ||||
| 2025-08-13 | 13F | Smith, Moore & Co. | 16 606 | 2,20 | 1 015 | 9,02 | ||||
| 2025-08-06 | 13F | Commonwealth Equity Services, Llc | 1 806 550 | −3,01 | 110 | 3,77 | ||||
| 2025-07-14 | 13F | Iams Wealth Management, Llc | 6 166 | −1,45 | 377 | 5,03 | ||||
| 2025-07-25 | 13F | Atria Wealth Solutions, Inc. | 87 275 | 33,61 | 5 432 | 45,16 | ||||
| 2025-05-16 | 13F | Coppell Advisory Solutions LLC | 0 | −100,00 | 0 | −100,00 | ||||
| 2025-08-07 | 13F | Allworth Financial LP | 7 683 | 0,09 | 470 | 9,58 | ||||
| 2025-07-17 | 13F | Raleigh Capital Management Inc. | 189 | 12 | ||||||
| 2025-07-24 | 13F | Ronald Blue Trust, Inc. | 459 | 0,44 | 28 | 7,69 | ||||
| 2025-08-14 | 13F | Stifel Financial Corp | 93 120 | −0,26 | 5 692 | 6,41 | ||||
| 2025-04-14 | 13F | NewSquare Capital LLC | 0 | 0 | ||||||
| 2025-08-14 | 13F | Mariner, LLC | 78 180 | −6,42 | 4 779 | −0,17 | ||||
| 2025-07-16 | 13F | Perigon Wealth Management, LLC | 24 382 | 5,74 | 1 490 | 12,79 | ||||
| 2025-08-14 | 13F | Two Sigma Securities, Llc | 6 517 | 2,15 | 398 | 9,04 | ||||
| 2025-07-24 | 13F | JNBA Financial Advisors | 32 694 | −0,39 | 1 999 | 6,28 | ||||
| 2025-08-04 | 13F | Amplius Wealth Advisors, LLC | 628 519 | 1,88 | 38 420 | 8,68 | ||||
| 2025-08-06 | 13F | Horan Securities, Inc. | 10 619 | 22,78 | 649 | 31,11 | ||||
| 2025-08-08 | 13F | Independence Financial Advisors, LLC | 7 960 | −2,13 | 487 | 4,29 | ||||
| 2025-07-14 | 13F | Enzi Wealth | 606 832 | −0,73 | 37 624 | 10,28 | ||||
| 2025-05-14 | 13F | Change Path, LLC | 0 | −100,00 | 0 | |||||
| 2025-08-14 | 13F | Sunbelt Securities, Inc. | 49 | 0,00 | 3 | 0,00 | ||||
| 2025-08-15 | 13F | Kestra Advisory Services, LLC | 124 613 | 15,57 | 7 618 | 23,29 | ||||
| 2025-07-29 | 13F | TFC Financial Management | 1 182 | 72 | ||||||
| 2025-08-13 | 13F | Cerity Partners LLC | 155 503 | 2 155,30 | 9 506 | 2 306,33 | ||||
| 2025-08-14 | 13F | Mml Investors Services, Llc | 5 422 | −15,44 | 0 | |||||
| 2025-07-28 | 13F | BRYN MAWR TRUST Co | 310 | 19 | ||||||
| 2025-07-16 | 13F | Magnus Financial Group LLC | 25 373 | −0,03 | 1 551 | 6,67 | ||||
| 2025-07-28 | 13F | Harbour Investments, Inc. | 2 331 | −21,22 | 142 | −15,98 | ||||
| 2025-07-31 | 13F/A | Avion Wealth | 58 | 0 | ||||||
| 2025-08-14 | 13F | CoreCap Advisors, LLC | 23 200 | 41,39 | 1 418 | 50,85 | ||||
| 2025-07-11 | 13F | Pinnacle Bancorp, Inc. | 2 456 | 0,00 | 150 | 7,14 | ||||
| 2025-08-18 | 13F | Tyler-Stone Wealth Management | 11 934 | 0,08 | 730 | 6,73 | ||||
| 2025-07-25 | 13F | Concurrent Investment Advisors, LLC | 33 690 | 30,03 | 2 059 | 38,75 | ||||
| 2025-07-25 | 13F | PrairieView Partners, LLC | 7 | 0 | ||||||
| 2025-08-04 | 13F | Creative Financial Designs Inc /adv | 32 582 | 1,20 | 1 992 | 7,97 | ||||
| 2025-07-22 | 13F | Valley National Advisers Inc | 400 | 0 | ||||||
| 2025-08-19 | 13F | Asset Dedication, LLC | 95 | 0,00 | 6 | 0,00 | ||||
| 2025-08-06 | 13F | AE Wealth Management LLC | 3 109 | 190 | ||||||
| 2025-08-14 | 13F | Susquehanna International Group, Llp | 15 716 | −46,15 | 961 | −42,58 | ||||
| 2025-08-06 | 13F | Wedbush Securities Inc | 3 580 | 0 | ||||||
| 2025-08-14 | 13F | Boston Private Wealth Llc | 0 | −100,00 | 0 | |||||
| 2025-08-12 | 13F | Garrett Wealth Advisory Group, LLC | 518 173 | 6,04 | 31 676 | 13,13 | ||||
| 2025-08-14 | 13F/A | Rockefeller Capital Management L.P. | 114 665 | −4,59 | 7 009 | 1,79 | ||||
| 2025-08-01 | 13F | Bessemer Group Inc | 5 354 | 0 | ||||||
| 2025-08-01 | 13F | Chilton Capital Management Llc | 125 118 | −5,03 | 7 648 | 1,32 | ||||
| 2025-08-14 | 13F | Wiley Bros.-aintree Capital, Llc | 126 322 | −19,32 | 7 719 | −13,43 | ||||
| 2025-07-21 | 13F | Patriot Financial Group Insurance Agency, LLC | 88 637 | −6,52 | 5 418 | −0,28 | ||||
| 2025-07-18 | 13F | Vicus Capital | 7 557 | 0,11 | 462 | 6,71 | ||||
| 2025-08-04 | 13F | Pensionmark Financial Group, Llc | 10 795 | 0,77 | 660 | 7,50 | ||||
| 2025-08-12 | 13F | Marshall & Sterling Wealth Advisors Inc. | 1 287 | 0,08 | 79 | 6,85 | ||||
| 2025-08-05 | 13F | Flynn Zito Capital Management, Llc | 61 709 | −3,79 | 3 772 | 2,64 | ||||
| 2025-08-08 | 13F | Symphony Financial Services, Inc. | 5 532 | 0,05 | 338 | 6,96 | ||||
| 2025-08-05 | 13F | EPG Wealth Management LLC | 8 676 | −12,28 | 530 | −6,36 | ||||
| 2025-08-12 | 13F | CIBC Private Wealth Group, LLC | 25 | 0,00 | 2 | 0,00 | ||||
| 2025-08-19 | 13F | MRP Capital Investments, LLC | 3 629 | 2,83 | 222 | 9,41 | ||||
| 2025-05-13 | 13F | Nations Financial Group Inc, /ia/ /adv | 0 | −100,00 | 0 | −100,00 | ||||
| 2025-08-14 | 13F | Sterling Wealth Management, Inc. | 5 440 | 0,00 | 333 | 2,47 | ||||
| 2025-08-08 | 13F | Adapt Wealth Advisors, Llc | 8 893 | −4,05 | 544 | 2,26 | ||||
| 2025-07-09 | 13F | Bank of New Hampshire | 368 | 0,00 | 22 | 4,76 | ||||
| 2025-08-01 | 13F | Transcend Wealth Collective, Llc | 0 | −100,00 | 0 | |||||
| 2025-08-14 | 13F | Great Valley Advisor Group, Inc. | 103 461 | −5,56 | 6 325 | 0,75 | ||||
| 2025-07-17 | 13F | Sound Income Strategies, LLC | 492 | 0,00 | 30 | 7,14 | ||||
| 2025-08-14 | 13F | Old Mission Capital Llc | 0 | −100,00 | 0 | |||||
| 2025-08-14 | 13F | Moneta Group Investment Advisors Llc | 9 708 | 24,25 | 593 | 32,66 | ||||
| 2025-05-01 | 13F | Smith Thornton Advisors LLC | 0 | −100,00 | 0 | |||||
| 2025-08-13 | 13F | Millstone Evans Group, LLC | 562 | 0,00 | 34 | 6,25 | ||||
| 2025-08-11 | 13F | HighTower Advisors, LLC | 20 411 | 326,74 | 1 248 | 355,11 | ||||
| 2025-07-22 | 13F | Grimes & Company, Inc. | 78 057 | −0,26 | 4 772 | 6,40 | ||||
| 2025-08-07 | 13F | Kestra Private Wealth Services, Llc | 102 866 | 18,63 | 6 288 | 26,57 | ||||
| 2025-08-13 | 13F | Legacy Capital Wealth Partners, LLC | 4 290 | 0,00 | 262 | 6,94 | ||||
| 2025-07-17 | 13F | ERn Financial, LLC | 57 401 | −73,70 | 3 509 | −71,94 | ||||
| 2025-07-09 | 13F | Key Client Fiduciary Advisors, LLC | 8 841 | −11,54 | 540 | −5,59 | ||||
| 2025-08-11 | 13F | Western Wealth Management, LLC | 10 757 | −1,45 | 658 | 5,12 | ||||
| 2025-07-21 | 13F | Ameritas Advisory Services, LLC | 177 | 11 | ||||||
| 2025-08-15 | 13F | Morgan Stanley | 2 988 204 | 5,00 | 182 669 | 12,02 | ||||
| 2025-08-04 | 13F | Linscomb & Williams, Inc. | 70 001 | 4,33 | 4 279 | 11,32 | ||||
| 2025-07-15 | 13F | FMA Wealth Management, LLC | 83 664 | 0,25 | 5 114 | 1,75 | ||||
| 2025-08-14 | 13F | Colony Group, LLC | 692 840 | 67,54 | 42 353 | 78,74 | ||||
| 2025-08-04 | 13F | Spire Wealth Management | 2 378 | −6,01 | 145 | 0,69 | ||||
| 2025-08-14 | 13F | Raymond James Financial Inc | 2 768 787 | 22,00 | 169 256 | 30,16 | ||||
| 2025-06-02 | 13F/A | Deutsche Bank Ag\ | 0 | −100,00 | 0 | |||||
| 2025-07-14 | 13F | AdvisorNet Financial, Inc | 371 | 267,33 | 23 | 340,00 | ||||
| 2025-07-18 | 13F | Parsons Capital Management Inc/ri | 32 150 | −1,64 | 1 965 | 4,97 | ||||
| 2025-07-31 | 13F | Hixon Zuercher, LLC | 134 085 | 9,34 | 8 197 | 16,65 | ||||
| 2025-08-07 | 13F | Sanchez Wealth Management Group | 229 543 | 0,95 | 14 032 | 7,69 | ||||
| 2025-07-28 | 13F | DORVAL Corp | 38 596 | 4,11 | 2 359 | 5,69 | ||||
| 2025-08-15 | 13F | Equitable Holdings, Inc. | 47 123 | −2,44 | 2 881 | 4,08 | ||||
| 2025-04-18 | 13F | Wolf Group Capital Advisors | 5 173 | 0,00 | 296 | 15,18 | ||||
| 2025-08-12 | 13F | LPL Financial LLC | 4 220 689 | −0,06 | 258 011 | 6,62 | ||||
| 2025-07-22 | 13F | Hill Island Financial Llc | 23 231 | −0,55 | 1 420 | 6,13 | ||||
| 2025-08-29 | NP | JAIUX - Managed Volatility Conservative Portfolio NAV | 111 259 | −1,45 | 6 801 | 5,13 | ||||
| 2025-08-27 | 13F/A | Brinker Capital Investments, LLC | 6 253 | 382 | ||||||
| 2025-07-25 | 13F | We Are One Seven, LLC | 22 454 | −48,05 | 1 373 | −44,59 | ||||
| 2025-08-05 | 13F | Strategic Financial Concepts, LLC | 20 165 | 1,61 | 1 233 | 8,36 | ||||
| 2025-07-18 | 13F | Newman Dignan & Sheerar, Inc. | 98 932 | 6 048 | ||||||
| 2025-08-08 | 13F | Avantax Advisory Services, Inc. | 579 175 | −2,13 | 35 405 | 4,42 | ||||
| 2025-08-14 | 13F | Marshall Investment Management, Llc | 11 073 | 282,49 | 677 | 309,70 | ||||
| 2025-08-29 | NP | JAIVX - Managed Volatility Moderate Portfolio NAV | 122 767 | −3,38 | 7 505 | 3,08 | ||||
| 2025-07-31 | 13F | Moloney Securities Asset Management, LLC | 37 833 | 32,18 | 2 313 | 40,98 | ||||
| 2025-07-11 | 13F | Quad-Cities Investment Group, LLC | 7 519 | −0,38 | 460 | 6,25 | ||||
| 2025-07-11 | 13F | Farther Finance Advisors, LLC | 35 213 | 77,52 | 2 153 | 88,94 | ||||
| 2025-08-13 | 13F | Northwestern Mutual Wealth Management Co | 1 657 127 | 0,46 | 101 300 | 7,18 | ||||
| 2025-07-29 | 13F | Private Trust Co Na | 4 282 | −2,39 | 262 | 3,98 | ||||
| 2025-07-08 | 13F | Granite Bay Wealth Management, LLC | 129 293 | 14,84 | 8 | 16,67 | ||||
| 2025-07-16 | 13F | Signaturefd, Llc | 0 | −100,00 | 0 | |||||
| 2025-08-14 | 13F | Fmr Llc | 7 608 | −2,71 | 465 | 3,79 | ||||
| 2025-08-11 | 13F | Citigroup Inc | 2 | −94,87 | 0 | −100,00 | ||||
| 2025-08-08 | 13F | Cetera Investment Advisers | 562 332 | −4,02 | 34 375 | 2,39 | ||||
| 2025-05-14 | 13F | Jane Street Group, Llc | 0 | −100,00 | 0 | |||||
| 2025-08-04 | 13F | Clear Investment Research, Llc | 1 669 | 0,24 | 102 | 7,37 | ||||
| 2025-08-08 | 13F | Comprehensive Financial Planning, Inc./PA | 1 470 | 0,48 | 90 | 7,23 | ||||
| 2025-07-17 | 13F | Venture Visionary Partners LLC | 4 055 | 0,00 | 248 | 6,47 | ||||
| 2025-07-24 | 13F | IFP Advisors, Inc | 739 | 46,34 | 45 | 60,71 | ||||
| 2025-07-17 | 13F | Smith Anglin Financial, LLC | 31 097 | −17,89 | 1 901 | −12,44 | ||||
| 2025-08-12 | 13F | Global Retirement Partners, LLC | 39 486 | −72,29 | 2 414 | −71,65 | ||||
| 2025-08-18 | 13F/A | National Bank Of Canada /fi/ | 4 811 | 0,00 | 294 | 6,55 | ||||
| 2025-07-29 | 13F | International Assets Investment Management, Llc | 33 923 | −9,35 | 2 074 | −3,31 | ||||
| 2025-08-08 | 13F | Creative Planning | 4 142 | −30,49 | 253 | −25,81 | ||||
| 2025-05-01 | 13F | Cutter & CO Brokerage, Inc. | 0 | −100,00 | 0 | |||||
| 2025-07-18 | 13F | Consolidated Portfolio Review Corp | 6 578 | −1,28 | 402 | 5,51 | ||||
| 2025-08-19 | 13F | Cape Investment Advisory, Inc. | 215 | 0,00 | 13 | 8,33 | ||||
| 2025-08-11 | 13F | Ritter Daniher Financial Advisory LLC / DE | 4 199 | 0,00 | 257 | 6,67 |