Grundläggande statistik
| Institutionella ägare | 281 total, 281 long only, 0 short only, 0 long/short - change of 2,17% MRQ |
| Genomsnittlig portföljallokering | 0.4951 % - change of −5,79% MRQ |
| Institutionella aktier (lång) | 100 107 505 (ex 13D/G) - change of −5,73MM shares −5,41% MRQ |
| Institutionellt värde (lång) | $ 3 985 262 USD ($1000) |
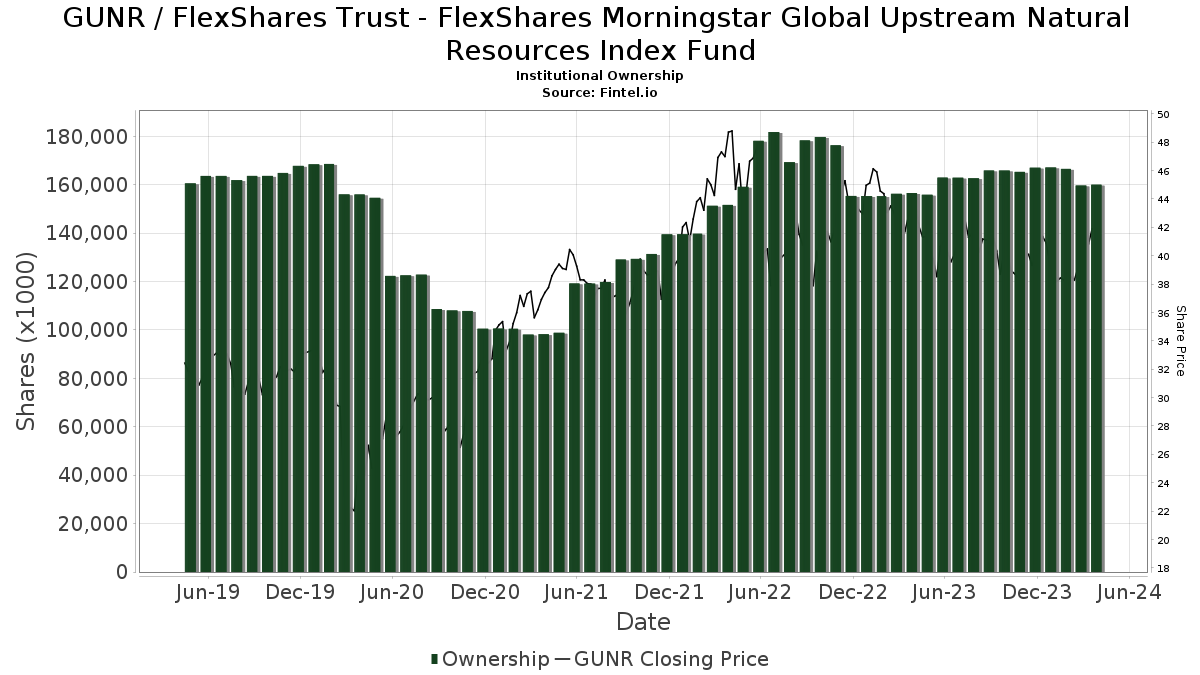
Institutionellt ägande och aktieägare
FlexShares Trust - FlexShares Morningstar Global Upstream Natural Resources Index Fund (US:GUNR) har 281 Institutionella ägare och aktieägare som har lämnat in 13D/G- eller 13F-formulär till Securities Exchange Commission (SEC). Dessa institut innehar totalt 100,107,505 aktier. Största aktieägare inkluderar Northern Trust Corp, Evoke Wealth, Llc, Valmark Advisers, Inc., Morgan Stanley, First Interstate Bank, Moller Financial Services, 1832 Asset Management L.P., Nbt Bank N A /ny, Connable Office Inc, and Aaron Wealth Advisors LLC .
FlexShares Trust - FlexShares Morningstar Global Upstream Natural Resources Index Fund (ARCA:GUNR) Institutionell ägarstruktur visar institutioners och fonders nuvarande positioner i företaget, samt de senaste förändringarna i positionernas storlek. Större aktieägare kan vara enskilda investerare, fonder, hedgefonder eller institutioner. Bilaga 13D visar att investeraren äger (eller ägde) mer än 5% av företaget och avser (eller avsåg) att aktivt eftersträva en förändring av affärsstrategin. Schedule 13G indikerar en passiv investering på över 5%.
The share price as of September 9, 2025 is 42,90 / share. Previously, on September 10, 2024, the share price was 38,55 / share. This represents an increase of 11,28% over that period.
Fondsentimentets poäng
Fondsentimentet poängen(fka Ägarackumulation-poäng) visar vilka aktier som är mest köpta av fonder. Det är resultatet av en sofistikerad kvantitativ flerfaktormodell som identifierar företag med de högsta nivåerna av institutionell ackumulering. Poängsättningsmodellen använder en kombination av den totala ökningen av redovisade ägare, förändringarna i portföljallokeringarna för dessa ägare och andra mått. Siffran sträcker sig från 0 till 100, där högre siffror indikerar en högre nivå av ackumulering i förhållande till sina konkurrenter, och 50 är genomsnittet.
Uppdateringsfrekvens: Dagligen
Se Ownership Explorer, som innehåller en lista över de högst rankade företagen.
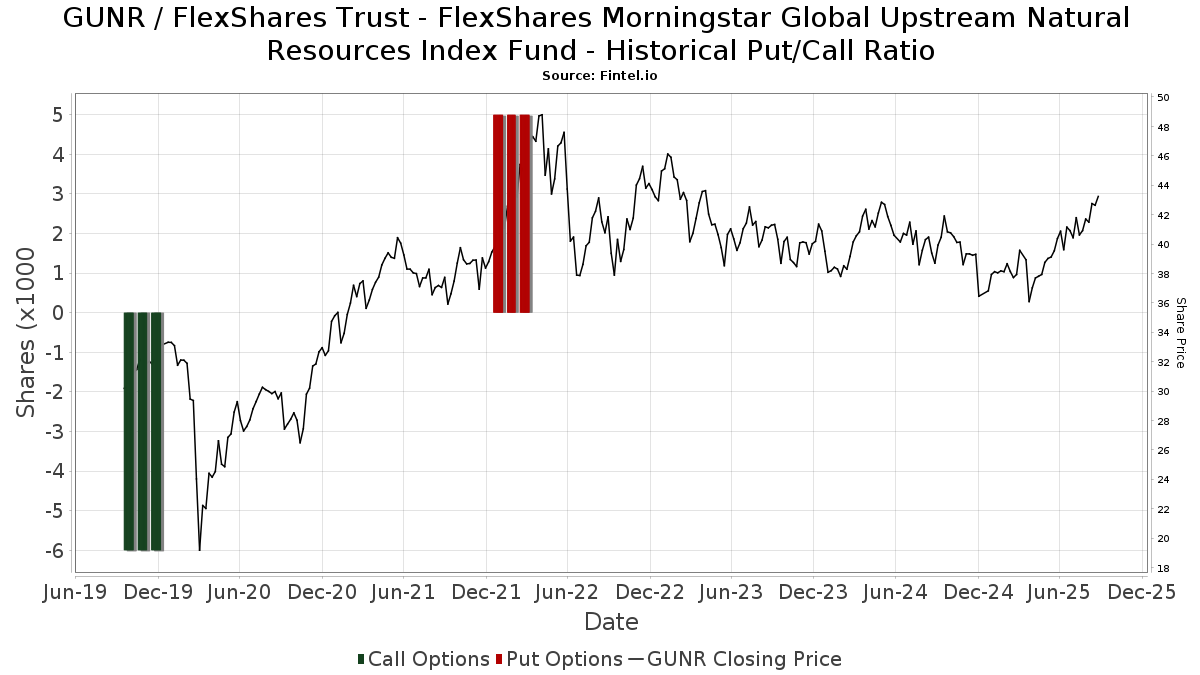
Institutionell sälj/köp-kvot
Förutom att rapportera vanliga eget kapital- och skuldemissioner måste institutioner med mer än 100MM tillgångar under förvaltning också avslöja sina innehav av sälj- och köpoptioner. Eftersom säljoptioner i allmänhet indikerar ett negativt sentiment och köpoptioner indikerar ett positivt sentiment, kan vi få en uppfattning om det övergripande institutionella sentimentet genom att plotta förhållandet mellan säljoptioner och köpoptioner. Diagrammet till höger visar det historiska förhållandet mellan sälj- och köpoptioner för detta instrument.
Genom att använda sälj/köp-kvoten som en indikator på aktieägarnas sentiment undviker man en av de största bristerna med att använda det totala institutionella ägandet, nämligen att en betydande del av de förvaltade tillgångarna investeras passivt för att följa index. Passivt förvaltade fonder köper vanligtvis inte optioner, så indikatorn för sälj/köp-kvoten ger en bättre bild av stämningen i aktivt förvaltade fonder.
13F- och NPORT-arkiveringar
Detaljer om 13F-arkiveringar är gratis. Detaljer om NP-arkiveringar kräver ett premiummedlemskap. Gröna rader indikerar nya positioner. Röda rader indikerar stängda positioner. Klicka på länk symbolen för att se hela transaktionshistoriken.
Uppgradera
för att låsa upp premiumdata och exportera till Excel ![]() .
.
| Fil Datum | Källa | Investerare | Typ | Genomsnittligt pris (beräknat) |
Aktier | Δ Aktier (%) |
Rapporterat värde (1000 USD) |
Δ Värde (%) |
Portföljallokering (%) |
|
|---|---|---|---|---|---|---|---|---|---|---|
| 2025-08-12 | 13F | Farmers National Bank | 270 702 | 2,02 | 10 858 | 5,44 | ||||
| 2025-05-15 | 13F | Alliancebernstein L.p. | 0 | −100,00 | 0 | −100,00 | ||||
| 2025-07-22 | 13F | Wealthcare Capital Management Llc | 6 925 | −9,43 | 278 | −6,42 | ||||
| 2025-07-30 | 13F | Granite Harbor Advisors, Inc. | 28 229 | −1,87 | 1 132 | 1,43 | ||||
| 2025-07-21 | 13F | DHJJ Financial Advisors, Ltd. | 105 | 0,00 | 4 | 0,00 | ||||
| 2025-07-17 | 13F | Sound Income Strategies, LLC | 348 | 0,00 | 14 | 0,00 | ||||
| 2025-08-14 | 13F | Monograph Wealth Advisors, Llc | 8 555 | 0,00 | 343 | 3,31 | ||||
| 2025-07-31 | 13F | Hanlon Investment Management, Inc. | 5 973 | −13,22 | 240 | −10,49 | ||||
| 2025-08-26 | NP | Northern Lights Variable Trust - TOPS Growth ETF Portfolio Class 2 shares | 257 627 | 9,90 | 10 333 | 13,57 | ||||
| 2025-07-25 | 13F | Concurrent Investment Advisors, LLC | 22 951 | 15,23 | 921 | 19,17 | ||||
| 2025-08-13 | 13F | Nicolet Advisory Services, Llc | 19 300 | −79,50 | 775 | −76,71 | ||||
| 2025-07-10 | 13F | Wealth Enhancement Advisory Services, Llc | 82 627 | −22,40 | 3 402 | −17,69 | ||||
| 2025-07-21 | 13F | Quent Capital, LLC | 0 | −100,00 | 0 | |||||
| 2025-08-07 | 13F | PFG Advisors | 5 161 | 207 | ||||||
| 2025-08-18 | 13F | Hollencrest Capital Management | 5 273 | 28,70 | 212 | 32,70 | ||||
| 2025-08-07 | 13F | Resources Investment Advisors, LLC. | 14 636 | 0,00 | 587 | 3,35 | ||||
| 2025-08-13 | 13F | Northwestern Mutual Wealth Management Co | 21 785 | −9,09 | 874 | −6,03 | ||||
| 2025-07-01 | 13F | Park National Corp /oh/ | 22 177 | −2,23 | 890 | 1,02 | ||||
| 2025-07-07 | 13F | Versant Capital Management, Inc | 512 086 | −9,40 | 20 540 | −6,37 | ||||
| 2025-08-05 | 13F | Hills Bank & Trust Co | 542 269 | −12,76 | 21 750 | −9,83 | ||||
| 2025-08-14 | 13F | Daiwa Securities Group Inc. | 5 600 | 0,00 | 0 | |||||
| 2025-07-31 | 13F/A | Avion Wealth | 144 | 0,00 | 0 | |||||
| 2025-08-12 | 13F | Waterloo Capital, L.P. | 6 700 | 8,17 | 269 | 11,67 | ||||
| 2025-07-16 | 13F | Stephenson National Bank & Trust | 216 296 | 4,05 | 8 676 | 7,54 | ||||
| 2025-08-12 | 13F | Stelac Advisory Services LLC | 31 038 | −18,50 | 1 244 | −15,66 | ||||
| 2025-07-30 | 13F | Cullen/frost Bankers, Inc. | 184 844 | −41,68 | 7 414 | −39,73 | ||||
| 2025-05-07 | 13F | Nemes Rush Group LLC | 0 | −100,00 | 0 | |||||
| 2025-05-12 | 13F | Operose Advisors LLC | 0 | −100,00 | 0 | |||||
| 2025-08-11 | 13F | Wealthspire Advisors, LLC | 5 070 | 203 | ||||||
| 2025-07-18 | 13F | Trust Co Of Vermont | 636 | 5,65 | 26 | 8,70 | ||||
| 2025-04-22 | 13F | Synergy Financial Management, LLC | 0 | −100,00 | 0 | |||||
| 2025-08-11 | 13F | HighTower Advisors, LLC | 10 100 | −66,68 | 405 | −65,56 | ||||
| 2025-04-09 | 13F | Advance Capital Management, Inc. | 0 | −100,00 | 0 | |||||
| 2025-07-28 | 13F | Harbour Investments, Inc. | 92 | −35,66 | 4 | −40,00 | ||||
| 2025-08-05 | 13F | Bank Of Montreal /can/ | 9 814 | −5,99 | 394 | −2,96 | ||||
| 2025-05-15 | 13F | Squarepoint Ops LLC | 0 | −100,00 | 0 | |||||
| 2025-08-07 | 13F | Brio Consultants, LLC | 168 488 | 1,96 | 6 758 | 5,38 | ||||
| 2025-07-21 | 13F | Sageworth Trust Co | 61 217 | 2 455 | ||||||
| 2025-07-22 | 13F | Awm Capital, Llc | 5 578 | 0,00 | 224 | 3,24 | ||||
| 2025-07-09 | 13F | Capital Wealth Management, Llc | 24 264 | 0,58 | 973 | 3,95 | ||||
| 2025-08-01 | 13F | Pasadena Private Wealth, LLC | 148 968 | 14,27 | 5 975 | 18,11 | ||||
| 2025-08-07 | 13F | CENTRAL TRUST Co | 368 063 | 0,86 | 14 763 | 4,24 | ||||
| 2025-08-14 | 13F | Comerica Bank | 26 714 | 7,18 | 1 071 | 10,75 | ||||
| 2025-05-15 | 13F | Plancorp, LLC | 0 | −100,00 | 0 | |||||
| 2025-07-15 | 13F | Well Done, LLC | 9 430 | 0,00 | 378 | 10,53 | ||||
| 2025-08-13 | 13F | Baird Financial Group, Inc. | 12 859 | −5,31 | 516 | −2,28 | ||||
| 2025-05-05 | 13F | Lindbrook Capital, Llc | 360 | 0,00 | 14 | 0,00 | ||||
| 2025-08-07 | 13F | Evoke Wealth, Llc | 3 971 272 | 7,59 | 159 288 | 11,20 | ||||
| 2025-08-14 | 13F | Ameriprise Financial Inc | 375 879 | −6,98 | 15 079 | −3,59 | ||||
| 2025-08-12 | 13F | TCTC Holdings, LLC | 1 418 | 57 | ||||||
| 2025-04-24 | 13F | Park Place Capital Corp | 0 | −100,00 | 0 | |||||
| 2025-08-06 | 13F | Pekin Hardy Strauss, Inc. | 15 820 | −3,51 | 635 | −0,31 | ||||
| 2025-07-28 | 13F | Frazier Financial Advisors, LLC | 0 | −100,00 | 0 | |||||
| 2025-08-14 | 13F | AllSquare Wealth Management LLC | 6 124 | 0,00 | 246 | 3,38 | ||||
| 2025-08-12 | 13F | Insigneo Advisory Services, Llc | 20 225 | −14,06 | 811 | −11,17 | ||||
| 2025-08-08 | 13F | Financial Gravity Companies, Inc. | 237 | 0,00 | 10 | 12,50 | ||||
| 2025-08-13 | 13F | SCS Capital Management LLC | 5 900 | 0,05 | 237 | 3,51 | ||||
| 2025-08-06 | 13F | AE Wealth Management LLC | 909 | −37,35 | 36 | −35,71 | ||||
| 2025-08-12 | 13F | Park Square Financial Group, LLC | 40 | 166,67 | 2 | |||||
| 2025-08-14 | 13F | Betterment LLC | 0 | −100,00 | 0 | |||||
| 2025-07-30 | 13F | First Interstate Bank | 1 421 346 | 82,67 | 57 010 | 88,79 | ||||
| 2025-07-24 | 13F | Etesian Wealth Advisors, Inc. | 52 955 | 1,83 | 2 124 | 5,25 | ||||
| 2025-07-29 | 13F | Madison Wealth Partners, Inc | 6 995 | 0,79 | 281 | 4,09 | ||||
| 2025-08-13 | 13F | MONECO Advisors, LLC | 45 881 | 5,36 | 1 840 | 8,88 | ||||
| 2025-07-17 | 13F | Beacon Capital Management, LLC | 160 | 4,58 | 6 | 20,00 | ||||
| 2025-08-05 | 13F | Plante Moran Financial Advisors, LLC | 402 | 16 | ||||||
| 2025-08-14 | 13F | Colony Group, LLC | 6 459 | 259 | ||||||
| 2025-07-25 | 13F | Pathway Financial Advisors LLC | 327 259 | 33,60 | 13 126 | 38,08 | ||||
| 2025-07-18 | 13F | Dogwood Wealth Management LLC | 103 | 0,00 | 4 | 33,33 | ||||
| 2025-08-04 | 13F | Simon Quick Advisors, Llc | 22 351 | 896 | ||||||
| 2025-08-14 | 13F | Bienville Capital Management, LLC | 6 285 | 0,54 | 252 | 4,13 | ||||
| 2025-08-11 | 13F | Cornerstone Planning Group LLC | 28 | 3,70 | 1 | 0,00 | ||||
| 2025-08-14 | 13F | Mml Investors Services, Llc | 43 494 | 3,18 | 2 | 0,00 | ||||
| 2025-07-16 | 13F | ORG Partners LLC | 0 | −100,00 | 0 | |||||
| 2025-08-26 | NP | Northern Lights Variable Trust - TOPS Managed Risk Growth ETF Portfolio Class 1 shares | 142 829 | −3,19 | 5 729 | 0,03 | ||||
| 2025-08-13 | 13F/A | StoneX Group Inc. | 0 | −100,00 | 0 | −100,00 | ||||
| 2025-07-23 | 13F | Fortis Advisors, LLC | 9 904 | −45,93 | 397 | −44,08 | ||||
| 2025-08-01 | 13F | Transcend Wealth Collective, Llc | 31 540 | 10,77 | 1 265 | 14,48 | ||||
| 2025-08-06 | 13F | Legacy Bridge, LLC | 1 182 | 0,00 | 47 | 4,44 | ||||
| 2025-04-21 | 13F | Citizens & Northern Corp | 0 | −100,00 | 0 | |||||
| 2025-07-11 | 13F | Busey Wealth Management | 17 510 | 0,00 | 702 | 3,39 | ||||
| 2025-08-14 | 13F | Royal Bank Of Canada | 206 874 | −8,95 | 8 298 | −5,90 | ||||
| 2025-07-15 | 13F | Fifth Third Bancorp | 240 | 0,00 | 10 | 0,00 | ||||
| 2025-08-11 | 13F | Citigroup Inc | 15 000 | 602 | ||||||
| 2025-08-14 | 13F | Herold Advisors, Inc. | 5 251 | −2,72 | 211 | 0,48 | ||||
| 2025-08-14 | 13F | Boston Private Wealth Llc | 67 149 | −51,74 | 2 693 | −50,13 | ||||
| 2025-07-31 | 13F | CVA Family Office, LLC | 53 592 | −0,15 | 2 150 | 3,22 | ||||
| 2025-08-04 | 13F | Creative Financial Designs Inc /adv | 7 | 0 | ||||||
| 2025-05-07 | 13F | Vista Private Wealth Partners. LLC | 0 | −100,00 | 0 | |||||
| 2025-07-23 | 13F | West Paces Advisors Inc. | 492 | 20 | ||||||
| 2025-07-30 | 13F | Gables Capital Management Inc. | 4 970 | 32,22 | 199 | 37,24 | ||||
| 2025-08-07 | 13F | King Luther Capital Management Corp | 923 | 271,77 | ||||||
| 2025-08-08 | 13F | Larson Financial Group LLC | 909 | 0,55 | 36 | 2,86 | ||||
| 2025-05-02 | 13F | Bogart Wealth, LLC | 0 | −100,00 | 0 | |||||
| 2025-05-16 | 13F | Empowered Funds, LLC | 0 | −100,00 | 0 | |||||
| 2025-07-23 | 13F | Colony Family Offices, LLC | 417 173 | −6,87 | 16 733 | −3,75 | ||||
| 2025-08-08 | 13F | Pnc Financial Services Group, Inc. | 25 524 | 56,79 | 1 024 | 62,12 | ||||
| 2025-04-10 | 13F | Sugar Maple Asset Management, LLC | 0 | −100,00 | 0 | |||||
| 2025-08-18 | 13F | N.E.W. Advisory Services LLC | 607 | 0,00 | 24 | 4,35 | ||||
| 2025-05-15 | 13F | D. E. Shaw & Co., Inc. | 0 | −100,00 | 0 | |||||
| 2025-08-12 | 13F | BlackRock, Inc. | 2 229 | −8,08 | 89 | −5,32 | ||||
| 2025-08-12 | 13F | Franklin Resources Inc | 92 848 | −18,41 | 3 724 | −15,67 | ||||
| 2025-07-25 | 13F | LRI Investments, LLC | 26 878 | 0,77 | 1 078 | 4,15 | ||||
| 2025-08-05 | 13F | Fourth Dimension Wealth, LLC | 13 | 0,00 | 1 | |||||
| 2025-08-08 | 13F | WASHINGTON TRUST Co | 7 885 | 0,00 | 316 | 3,27 | ||||
| 2025-07-22 | 13F | Wealthcare Capital Partners, LLC | 23 731 | 10,99 | 952 | 14,72 | ||||
| 2025-07-16 | 13F | St Germain D J Co Inc | 375 | −86,87 | 15 | −86,36 | ||||
| 2025-08-14 | 13F | Bnp Paribas Arbitrage, Sa | 22 | 1 | ||||||
| 2025-05-06 | 13F | Proficio Capital Partners LLC | 0 | −100,00 | 0 | −100,00 | ||||
| 2025-05-14 | 13F | Keeley-Teton Advisors, LLC | 18 591 | −2,23 | 722 | 4,34 | ||||
| 2025-07-14 | 13F | AdvisorNet Financial, Inc | 26 | 0,00 | 1 | 0,00 | ||||
| 2025-08-01 | 13F | Redwood Park Advisors LLC | 32 493 | 6,21 | 1 303 | 9,77 | ||||
| 2025-04-29 | 13F | Hm Payson & Co | 249 | 10 | ||||||
| 2025-07-11 | 13F | Essex Savings Bank | 6 011 | −0,15 | 241 | 3,43 | ||||
| 2025-07-21 | 13F | Custos Family Office, LLC | 17 870 | 0,00 | 717 | 3,32 | ||||
| 2025-08-13 | 13F | Cerity Partners LLC | 21 236 | 44,19 | 852 | 49,04 | ||||
| 2025-04-21 | 13F | Nelson, Van Denburg & Campbell Wealth Management Group, LLC | 0 | −100,00 | 0 | |||||
| 2025-07-18 | 13F | Pure Financial Advisors, Inc. | 550 052 | 9,80 | 22 063 | 13,48 | ||||
| 2025-07-15 | 13F | Mather Group, Llc. | 10 400 | 0,00 | 417 | 3,47 | ||||
| 2025-08-19 | 13F | Advisory Services Network, LLC | 30 400 | −3,96 | 1 226 | −0,16 | ||||
| 2025-08-01 | 13F | Y-Intercept (Hong Kong) Ltd | 21 293 | 83,29 | 854 | 89,78 | ||||
| 2025-08-11 | 13F | Principal Securities, Inc. | 7 130 | 19,95 | 286 | 31,94 | ||||
| 2025-08-13 | 13F | IAG Wealth Partners, LLC | 132 394 | 30,19 | 5 310 | 34,57 | ||||
| 2025-08-14 | 13F | Guardian Wealth Management, Inc. | 0 | −100,00 | 0 | |||||
| 2025-07-17 | 13F | Independence Bank of Kentucky | 5 450 | −72,91 | 219 | −72,05 | ||||
| 2025-08-04 | 13F | Pensionmark Financial Group, Llc | 5 699 | −1,57 | 229 | 1,79 | ||||
| 2025-07-22 | 13F | Verus Wealth Management, Llc | 5 015 | 201 | ||||||
| 2025-07-21 | 13F | Old Second National Bank Of Aurora | 0 | −100,00 | 0 | |||||
| 2025-04-25 | 13F | Tradewinds Capital Management, LLC | 0 | −100,00 | 0 | |||||
| 2025-08-12 | 13F | Latigo Investments, LLC | 0 | −100,00 | 0 | |||||
| 2025-08-14 | 13F | Stifel Financial Corp | 23 647 | −7,30 | 948 | −4,24 | ||||
| 2025-04-25 | 13F | Smallwood Wealth Investment Management, LLC | 54 482 | 2,71 | 2 114 | 9,65 | ||||
| 2025-08-12 | 13F | Bokf, Na | 1 182 | −72,77 | 47 | −72,02 | ||||
| 2025-08-06 | 13F | Commonwealth Equity Services, Llc | 38 599 | −13,73 | 2 | 0,00 | ||||
| 2025-08-06 | 13F | First Horizon Advisors, Inc. | 1 184 | −4,05 | 47 | 0,00 | ||||
| 2025-08-14 | 13F | Jane Street Group, Llc | 118 797 | 14,38 | 4 765 | 18,21 | ||||
| 2025-08-14 | 13F | Sunbelt Securities, Inc. | 69 | 3 | ||||||
| 2025-08-12 | 13F | LPL Financial LLC | 266 768 | −0,31 | 10 700 | 3,03 | ||||
| 2025-08-05 | 13F | Key FInancial Inc | 2 053 | −6,21 | 82 | −2,38 | ||||
| 2025-08-13 | 13F | Flow Traders U.s. Llc | 305 377 | 14,89 | 12 | 20,00 | ||||
| 2025-08-08 | 13F | VeraBank, N.A. | 67 853 | −20,60 | 2 722 | −17,94 | ||||
| 2025-08-05 | 13F | Dunhill Financial, LLC | 62 | 2 | ||||||
| 2025-08-26 | NP | Northern Lights Variable Trust - TOPS Managed Risk Balanced ETF Portfolio Class 2 shares | 38 784 | −3,27 | 1 556 | −0,06 | ||||
| 2025-07-02 | 13F | S. R. Schill & Associates | 116 558 | 2,78 | 4 675 | 6,23 | ||||
| 2025-08-13 | 13F | Townsquare Capital Llc | 0 | −100,00 | 0 | |||||
| 2025-08-26 | NP | Northern Lights Variable Trust - TOPS Aggressive Growth ETF Portfolio Class 2 shares | 230 613 | 8,60 | 9 250 | 12,23 | ||||
| 2025-08-13 | 13F | Rsm Us Wealth Management Llc | 13 483 | 0,00 | 541 | 3,25 | ||||
| 2025-08-05 | 13F | Sigma Planning Corp | 6 290 | −11,35 | 252 | −8,36 | ||||
| 2025-08-05 | 13F | Connable Office Inc | 937 063 | −2,65 | 37 586 | 0,61 | ||||
| 2025-07-24 | 13F | McKinley Carter Wealth Services, Inc. | 6 036 | 0,00 | 242 | 3,42 | ||||
| 2025-07-14 | 13F | Park Avenue Securities Llc | 9 265 | 0 | ||||||
| 2025-09-04 | 13F/A | Advisor Group Holdings, Inc. | 34 646 | 8,98 | 1 374 | 11,35 | ||||
| 2025-07-11 | 13F | Grove Bank & Trust | 10 443 | 9,79 | 419 | 13,28 | ||||
| 2025-07-11 | 13F/A | Umb Bank N A/mo | 9 106 | 17,18 | 365 | 21,26 | ||||
| 2025-04-17 | 13F | Columbus Macro, LLC | 0 | −100,00 | 0 | |||||
| 2025-05-15 | 13F | Integrated Wealth Concepts LLC | 0 | −100,00 | 0 | |||||
| 2025-07-15 | 13F | Missouri Trust & Investment Co | 71 222 | 0,53 | 2 857 | 3,89 | ||||
| 2025-08-06 | 13F | Entrewealth, Llc | 35 365 | 4,31 | 1 418 | 7,83 | ||||
| 2025-08-14 | 13F | Mercer Global Advisors Inc /adv | 413 561 | 191,31 | 16 588 | 201,11 | ||||
| 2025-07-17 | 13F | Greenleaf Trust | 81 489 | −60,06 | 3 269 | −58,73 | ||||
| 2025-08-13 | 13F | Valued Retirements, Inc. | 14 801 | 0,00 | 594 | 3,31 | ||||
| 2025-08-13 | 13F | Avos Capital Management, LLC | 138 853 | 26,19 | 5 569 | 30,42 | ||||
| 2025-08-14 | 13F | Aspen Grove Capital, LLC | 0 | −100,00 | 0 | |||||
| 2025-07-21 | 13F | Ameritas Advisory Services, LLC | 1 485 | 60 | ||||||
| 2025-08-14 | 13F | Headlands Technologies LLC | 1 422 | −20,78 | 57 | −17,39 | ||||
| 2025-04-14 | 13F | Black Point Wealth Management | 0 | −100,00 | 0 | |||||
| 2025-08-14 | 13F | Clark Capital Management Group, Inc. | 114 204 | −1,62 | 4 581 | 1,66 | ||||
| 2025-07-30 | 13F | Whittier Trust Co Of Nevada Inc | 68 | 0,00 | 3 | 0,00 | ||||
| 2025-08-14 | 13F/A | Rockefeller Capital Management L.P. | 32 662 | 23,42 | 1 310 | 27,56 | ||||
| 2025-08-12 | 13F | Calton & Associates, Inc. | 5 856 | 235 | ||||||
| 2025-08-14 | 13F | Marquette Associates, Inc. | 128 | −12,93 | 5 | 0,00 | ||||
| 2025-07-30 | 13F | Whittier Trust Co | 13 354 | 101,48 | 536 | 108,17 | ||||
| 2025-07-30 | 13F | Clune & Associates, Ltd. | 18 019 | 1,84 | 723 | 5,25 | ||||
| 2025-07-25 | 13F | Envestnet Portfolio Solutions, Inc. | 226 589 | −3,46 | 9 088 | −0,23 | ||||
| 2025-05-13 | 13F | Quadrature Capital Ltd | 0 | −100,00 | 0 | |||||
| 2025-08-13 | 13F | F/M Investments LLC | 6 831 | 0,00 | 274 | 3,02 | ||||
| 2025-07-16 | 13F | Arkansas Financial Group, Inc. | 196 973 | −4,50 | 8 035 | 10,28 | ||||
| 2025-07-24 | 13F | Robertson Stephens Wealth Management, LLC | 0 | −100,00 | 0 | |||||
| 2025-08-08 | 13F | Fortis Group Advisors, LLC | 184 | 0,00 | 7 | 0,00 | ||||
| 2025-08-05 | 13F | Bank of New York Mellon Corp | 0 | −100,00 | 0 | |||||
| 2025-08-15 | 13F | Tower Research Capital LLC (TRC) | 120 | 224,32 | 5 | 300,00 | ||||
| 2025-08-13 | 13F | Jones Financial Companies Lllp | 4 932 | −2,45 | 197 | 1,03 | ||||
| 2025-07-22 | 13F | Wealthcare Advisory Partners LLC | 179 538 | −4,95 | 7 201 | −1,77 | ||||
| 2025-08-12 | 13F | DiMeo Schneider & Associates, L.L.C. | 22 281 | 0,00 | 894 | 3,36 | ||||
| 2025-07-17 | 13F | Barry Investment Advisors, LLC | 395 851 | 16,64 | 15 878 | 20,55 | ||||
| 2025-08-04 | 13F | Ledyard National Bank | 178 401 | 7 156 | ||||||
| 2025-06-26 | NP | AMTAX - AB All Market Real Return Portfolio Class A | 254 380 | 39,82 | 9 618 | 39,35 | ||||
| 2025-06-24 | NP | ASET - FlexShares Real Assets Allocation Index Fund | 17 955 | 0,00 | 679 | −0,44 | ||||
| 2025-07-22 | 13F | Gsa Capital Partners Llp | 0 | −100,00 | 0 | |||||
| 2025-04-30 | 13F | Axxcess Wealth Management, Llc | 0 | −100,00 | 0 | |||||
| 2025-08-05 | 13F | Navalign, LLC | 365 709 | 3,56 | 14 669 | 7,03 | ||||
| 2025-07-18 | 13F | Warren Street Wealth Advisors, LLC | 11 592 | −2,40 | 465 | 0,87 | ||||
| 2025-08-12 | 13F | CIBC Private Wealth Group, LLC | 1 119 | −16,12 | 45 | −2,22 | ||||
| 2025-08-15 | 13F | Fft Wealth Management Llc | 5 851 | 0,00 | 240 | 5,29 | ||||
| 2025-08-01 | 13F | Envestnet Asset Management Inc | 250 958 | 5,56 | 10 066 | 9,09 | ||||
| 2025-05-02 | 13F | Kingsview Wealth Management, LLC | 0 | −100,00 | 0 | |||||
| 2025-05-15 | 13F | Lido Advisors, LLC | 0 | −100,00 | 0 | |||||
| 2025-07-16 | 13F | TOWER TRUST & INVESTMENT Co | 1 864 | 5,13 | 75 | 10,45 | ||||
| 2025-07-23 | 13F | Nbt Bank N A /ny | 950 745 | −5,56 | 38 134 | −2,40 | ||||
| 2025-07-31 | 13F | Resonant Capital Advisors, LLC | 8 467 | 0,00 | 340 | 3,35 | ||||
| 2025-08-12 | 13F | Jpmorgan Chase & Co | 33 560 | 94,21 | 1 346 | 100,90 | ||||
| 2025-04-29 | 13F | Truist Financial Corp | 0 | −100,00 | 0 | |||||
| 2025-08-07 | 13F | Commerce Bank | 9 861 | 0,00 | 396 | 3,40 | ||||
| 2025-07-09 | 13F | First Financial Corp /in/ | 1 485 | 0,00 | 60 | 3,51 | ||||
| 2025-08-13 | 13F | 1832 Asset Management L.P. | 960 003 | −61,51 | 38 506 | −60,22 | ||||
| 2025-07-31 | 13F | West Michigan Advisors, Llc | 5 795 | −4,92 | 232 | −1,69 | ||||
| 2025-08-14 | 13F | Barometer Capital Management Inc. | 11 300 | 453 | ||||||
| 2025-07-25 | 13F | Sequoia Financial Advisors, LLC | 8 088 | 0,26 | 324 | 3,51 | ||||
| 2025-08-12 | 13F | Vestor Capital, Llc | 2 883 | 2,56 | 1 | |||||
| 2025-08-13 | 13F | M&t Bank Corp | 0 | −100,00 | 0 | |||||
| 2025-08-13 | 13F | Beacon Pointe Advisors, LLC | 116 842 | −5,96 | 4 687 | −2,82 | ||||
| 2025-08-26 | NP | Northern Lights Variable Trust - TOPS Managed Risk Moderate Growth ETF Portfolio Class 1 shares | 90 185 | −4,59 | 3 617 | −1,39 | ||||
| 2025-08-12 | 13F | Steward Partners Investment Advisory, Llc | 350 | 0,00 | 14 | 7,69 | ||||
| 2025-08-14 | 13F | Trace Wealth Advisors, LLC | 15 169 | 0,00 | 608 | 3,40 | ||||
| 2025-07-18 | 13F | Provident Wealth Management, LLC | 12 791 | −5,17 | 513 | −1,91 | ||||
| 2025-08-14 | 13F | Fort Point Capital Partners LLC | 7 290 | −14,76 | 292 | −11,78 | ||||
| 2025-07-28 | 13F | Kiker Wealth Management, LLC | 503 | −16,58 | 20 | −13,04 | ||||
| 2025-07-15 | 13F | Td Private Client Wealth Llc | 10 647 | 5,82 | 427 | 9,49 | ||||
| 2025-08-07 | 13F | Allworth Financial LP | 3 735 | 0,51 | 150 | 4,93 | ||||
| 2025-07-29 | 13F | Activest Wealth Management | 183 | 1,10 | 7 | 0,00 | ||||
| 2025-04-22 | 13F | Brown, Lisle/cummings, Inc. | 0 | −100,00 | 0 | |||||
| 2025-05-01 | 13F | FDx Advisors, Inc. | 0 | −100,00 | 0 | −100,00 | ||||
| 2025-08-13 | 13F | Renaissance Technologies Llc | 0 | −100,00 | 0 | |||||
| 2025-08-14 | 13F | Two Sigma Securities, Llc | 0 | −100,00 | 0 | |||||
| 2025-08-04 | 13F | Hantz Financial Services, Inc. | 523 | 0 | ||||||
| 2025-08-15 | 13F | CI Private Wealth, LLC | 42 926 | −64,77 | 1 722 | −63,61 | ||||
| 2025-07-29 | 13F | Chicago Partners Investment Group LLC | 5 422 | 0,00 | 227 | 10,24 | ||||
| 2025-07-31 | 13F | Money Design Co.,Ltd. | 88 981 | 13,66 | 4 | 0,00 | ||||
| 2025-08-15 | 13F | Kestra Advisory Services, LLC | 26 490 | −40,26 | 1 063 | −38,26 | ||||
| 2025-05-14 | 13F | Brown Brothers Harriman & Co | 0 | −100,00 | 0 | |||||
| 2025-08-11 | 13F | Bradley Foster & Sargent Inc/ct | 15 800 | 634 | ||||||
| 2025-07-23 | 13F | Equitable Trust Co | 0 | −100,00 | 0 | |||||
| 2025-08-11 | 13F | Dorsey & Whitney Trust CO LLC | 10 613 | 0,00 | 426 | 3,41 | ||||
| 2025-07-25 | 13F | Cwm, Llc | 6 426 | 15,62 | 0 | |||||
| 2025-08-04 | 13F | L.m. Kohn & Company | 25 409 | −0,33 | 1 019 | 3,03 | ||||
| 2025-08-13 | 13F | Capital Analysts, Inc. | 3 616 | 33,98 | 0 | |||||
| 2025-04-09 | 13F | Enterprise Bank & Trust Co | 0 | −100,00 | 0 | −100,00 | ||||
| 2025-07-03 | 13F | Fiduciary Financial Group, Llc | 8 713 | 352 | ||||||
| 2025-08-14 | 13F | Harwood Advisory Group, LLC | 33 | 0,00 | 1 | 0,00 | ||||
| 2025-07-28 | 13F | BRYN MAWR TRUST Co | 527 | −18,42 | 21 | −16,00 | ||||
| 2025-04-01 | 13F | Oliver Lagore Vanvalin Investment Group | 0 | −100,00 | 0 | |||||
| 2025-08-01 | 13F | Schmidt P J Investment Management Inc | 0 | −100,00 | 0 | |||||
| 2025-08-14 | 13F | Citadel Advisors Llc | 122 054 | 847,55 | 4 896 | 880,96 | ||||
| 2025-08-14 | 13F | GWM Advisors LLC | 1 995 | 3,69 | 80 | 8,11 | ||||
| 2025-08-14 | 13F | VPR Management LLC | 528 203 | 0,00 | 21 186 | 3,35 | ||||
| 2025-08-04 | 13F | Spire Wealth Management | 34 856 | 89,65 | 1 398 | 96,07 | ||||
| 2025-07-09 | 13F | Aaron Wealth Advisors LLC | 599 090 | 2,92 | 24 030 | 6,37 | ||||
| 2025-08-12 | 13F | Argent Trust Co | 7 218 | 0,00 | 290 | 3,21 | ||||
| 2025-04-30 | 13F | Sofos Investments, Inc. | 237 | 9 | ||||||
| 2025-08-12 | 13F | Proequities, Inc. | 0 | 0 | ||||||
| 2025-07-16 | 13F | Kendall Capital Management | 22 150 | 4,13 | 888 | 7,64 | ||||
| 2025-04-16 | 13F | Noble Family Wealth, LLC | 0 | −100,00 | 0 | |||||
| 2025-07-24 | 13F | Blair William & Co/il | 8 696 | 32,60 | 349 | 37,01 | ||||
| 2025-08-06 | 13F | Walkner Condon Financial Advisors LLC | 68 524 | 5,79 | 2 747 | 9,31 | ||||
| 2025-04-30 | 13F | Arcadia Investment Management Corp/mi | 0 | −100,00 | 0 | |||||
| 2025-08-26 | NP | Northern Lights Variable Trust - TOPS Balanced ETF Portfolio Class 1 shares | 100 649 | 2,06 | 4 037 | 5,49 | ||||
| 2025-04-28 | NP | MVFG - Monarch Volume Factor Global Unconstrained Index ETF | 0 | −100,00 | 0 | −100,00 | ||||
| 2025-08-14 | 13F | Fmr Llc | 14 821 | −21,71 | 594 | −19,07 | ||||
| 2025-04-28 | 13F | Strategic Financial Concepts, LLC | 0 | −100,00 | 0 | −100,00 | ||||
| 2025-08-13 | 13F | Consultiva Wealth Management, Corp. | 1 000 | 0,00 | 40 | 5,26 | ||||
| 2025-03-12 | 13F/A | Private Capital Management Llc | 0 | −100,00 | 0 | |||||
| 2025-05-06 | 13F | Wedbush Securities Inc | 0 | −100,00 | 0 | |||||
| 2025-08-08 | 13F | Hartland & Co., LLC | 9 715 | −28,78 | 390 | −26,47 | ||||
| 2025-05-09 | 13F | Renasant Bank | 0 | −100,00 | 0 | |||||
| 2025-08-13 | 13F | Millstone Evans Group, LLC | 174 | 0,00 | 7 | 0,00 | ||||
| 2025-08-06 | 13F | Golden State Wealth Management, LLC | 784 | 0,90 | 31 | 3,33 | ||||
| 2025-08-14 | 13F | Seven Mile Advisory | 9 438 | 0,00 | 379 | 3,28 | ||||
| 2025-04-22 | 13F | First PREMIER Bank | 0 | −100,00 | 0 | |||||
| 2025-08-06 | 13F | Prospera Financial Services Inc | 7 729 | −10,22 | 310 | −7,19 | ||||
| 2025-08-14 | 13F | Prelude Capital Management, Llc | 0 | −100,00 | 0 | |||||
| 2025-07-21 | 13F | Mirae Asset Global Investments Co., Ltd. | 11 700 | 0,00 | 469 | 3,53 | ||||
| 2025-07-31 | 13F | Cambridge Investment Research Advisors, Inc. | 31 989 | 2,68 | 1 | 0,00 | ||||
| 2025-08-14 | 13F | Principia Wealth Advisory, LLC | 3 880 | −15,32 | 156 | −6,06 | ||||
| 2025-07-29 | 13F | United Bank | 172 393 | 7,80 | 6 915 | 11,41 | ||||
| 2025-08-14 | 13F | Aqr Capital Management Llc | 31 794 | 1 275 | ||||||
| 2025-07-11 | 13F | Quad-Cities Investment Group, LLC | 7 906 | −27,53 | 317 | −25,06 | ||||
| 2025-07-30 | 13F | First Citizens Bank & Trust Co | 0 | −100,00 | 0 | |||||
| 2025-08-08 | 13F | Cedar Wealth Management, LLC | 11 009 | −33,33 | 442 | −31,09 | ||||
| 2025-08-14 | 13F | EP Wealth Advisors, Inc. | 18 706 | −2,26 | 750 | 1,08 | ||||
| 2025-07-10 | 13F | Moller Financial Services | 1 117 302 | 4,17 | 44 815 | 7,65 | ||||
| 2025-08-12 | 13F | SRS Capital Advisors, Inc. | 137 | 0,00 | 5 | 0,00 | ||||
| 2025-08-14 | 13F | Qube Research & Technologies Ltd | 23 431 | 1 622,87 | 940 | 1 705,77 | ||||
| 2025-08-04 | 13F | Pinnacle Associates Ltd | 6 728 | −3,37 | 270 | −0,37 | ||||
| 2025-08-14 | 13F | UBS Group AG | 208 311 | −35,99 | 8 355 | −33,84 | ||||
| 2025-08-06 | 13F | North Capital, Inc. | 68 | 0,00 | 3 | 0,00 | ||||
| 2025-07-08 | 13F | Nbc Securities, Inc. | 135 | 0,00 | 0 | |||||
| 2025-05-15 | 13F | Tudor Investment Corp Et Al | 0 | −100,00 | 0 | |||||
| 2025-08-22 | 13F | Carter Financial Group, INC. | 4 993 | 200 | ||||||
| 2025-08-13 | 13F | Texas Capital Bank Wealth Management Services Inc | 8 305 | 0,00 | 333 | 3,42 | ||||
| 2025-05-08 | 13F | First Foundation Advisors | 0 | −100,00 | 0 | |||||
| 2025-04-15 | 13F | Total Wealth Planning, Llc | 0 | −100,00 | 0 | |||||
| 2025-08-14 | 13F | Raymond James Financial Inc | 399 182 | −10,68 | 16 011 | −7,69 | ||||
| 2025-05-14 | 13F | Wiser Advisor Group LLC | 0 | −100,00 | 0 | |||||
| 2025-08-14 | 13F | Susquehanna International Group, Llp | 14 201 | −69,33 | 570 | −68,32 | ||||
| 2025-07-30 | 13F | Eqis Capital Management, Inc. | 7 562 | −33,29 | 303 | −30,98 | ||||
| 2025-08-01 | 13F | Bessemer Group Inc | 125 667 | 7,38 | 5 | 25,00 | ||||
| 2025-08-14 | 13F | Bank Of America Corp /de/ | 302 320 | −6,42 | 12 126 | −3,28 | ||||
| 2025-07-08 | 13F | Boltwood Capital Management | 118 683 | −10,07 | 4 760 | −7,05 | ||||
| 2025-07-24 | 13F | Horizon Bancorp Inc /in/ | 64 171 | −6,03 | 3 | 0,00 | ||||
| 2025-07-16 | 13F | American National Bank | 648 | 0,00 | 26 | 0,00 | ||||
| 2025-07-21 | 13F | Sageworth Trust Co of South Dakota | 8 168 | 0,00 | 328 | 3,15 | ||||
| 2025-08-26 | NP | Northern Lights Variable Trust - TOPS Moderate Growth ETF Portfolio Class 1 shares | 204 997 | 4,78 | 8 222 | 8,30 | ||||
| 2025-08-14 | 13F | LaSalle St. Investment Advisors, LLC | 8 625 | −53,43 | 0 | |||||
| 2025-07-24 | 13F | Comprehensive Money Management Services LLC | 6 682 | 0,00 | 268 | 3,47 | ||||
| 2025-04-01 | 13F | Massmutual Trust Co Fsb/adv | 0 | −100,00 | 0 | |||||
| 2025-08-13 | 13F | Northern Trust Corp | 69 688 432 | −6,37 | 2 795 203 | −3,23 | ||||
| 2025-07-29 | 13F | Private Trust Co Na | 84 | −7,69 | 3 | 0,00 | ||||
| 2025-07-11 | 13F | Farther Finance Advisors, LLC | 1 491 | −2,36 | 60 | 0,00 | ||||
| 2025-07-31 | 13F | CNB Bank | 2 150 | 0,00 | 86 | 3,61 | ||||
| 2025-08-12 | 13F | MAI Capital Management | 164 892 | 2,13 | 6 614 | 5,55 | ||||
| 2025-07-24 | 13F | IFP Advisors, Inc | 1 064 | 0,76 | 43 | 5,00 | ||||
| 2025-07-07 | 13F | Thurston, Springer, Miller, Herd & Titak, Inc. | 378 | 56,85 | 15 | 66,67 | ||||
| 2025-07-31 | 13F | Wealthfront Advisers Llc | 61 706 | 85,51 | 2 475 | 91,86 | ||||
| 2025-08-26 | NP | Northern Lights Variable Trust - TOPS Managed Risk Flex ETF Portfolio | 94 947 | −4,99 | 3 808 | −1,81 | ||||
| 2025-05-15 | 13F | Gts Securities Llc | 0 | −100,00 | 0 | |||||
| 2025-08-14 | 13F | Old Mission Capital Llc | 23 813 | −95,12 | 955 | −94,95 | ||||
| 2025-08-15 | 13F | Morgan Stanley | 1 788 019 | 5,91 | 71 717 | 9,46 | ||||
| 2025-08-06 | 13F | Garrison Point Advisors, Llc | 18 990 | −0,44 | 762 | 2,84 | ||||
| 2025-04-04 | 13F | Webster Bank, N. A. | 0 | −100,00 | 0 | |||||
| 2025-08-12 | 13F | Global Retirement Partners, LLC | 1 196 | −16,89 | 48 | −9,62 | ||||
| 2025-08-26 | NP | Northern Lights Variable Trust - TOPS Conservative ETF Portfolio Class 1 shares | 20 956 | 1,47 | 841 | 4,87 | ||||
| 2025-05-02 | 13F | Napatree Capital Llc | 15 800 | 0,00 | 613 | 6,79 | ||||
| 2025-08-04 | 13F | Keybank National Association/oh | 25 041 | 0,00 | 1 004 | 3,40 | ||||
| 2025-07-25 | 13F | Hemington Wealth Management | 577 | 0 | ||||||
| 2025-07-30 | 13F | Studio Investment Management Llc | 28 370 | −3,38 | 1 138 | −0,18 | ||||
| 2025-07-31 | 13F | Brinker Capital Investments, LLC | 0 | −100,00 | 0 | −100,00 | ||||
| 2025-08-05 | 13F | BEAM Asset Management, LLC | 21 076 | 0,54 | 845 | 3,94 | ||||
| 2025-08-14 | 13F | CoreCap Advisors, LLC | 161 805 | 3,99 | 6 490 | 7,49 | ||||
| 2025-08-14 | 13F | Atomi Financial Group, Inc. | 5 175 | 0,00 | 208 | 3,50 | ||||
| 2025-07-31 | 13F | AlTi Global, Inc. | 55 290 | −0,47 | 2 218 | 2,88 | ||||
| 2025-05-14 | 13F | Van Hulzen Asset Management, LLC | 0 | −100,00 | 0 | −100,00 | ||||
| 2025-08-08 | 13F | Austin Wealth Management, LLC | 150 348 | 4,99 | 6 065 | 10,76 | ||||
| 2025-08-05 | 13F | Huntington National Bank | 313 | 3,31 | ||||||
| 2025-07-14 | 13F | Sowell Financial Services LLC | 0 | −100,00 | 0 | |||||
| 2025-04-23 | 13F | Security National Bank | 0 | −100,00 | 0 | |||||
| 2025-08-14 | 13F | Wells Fargo & Company/mn | 93 876 | −27,81 | 3 765 | −25,39 | ||||
| 2025-05-16 | 13F | Coppell Advisory Solutions LLC | 0 | −100,00 | 0 | |||||
| 2025-08-13 | 13F | Gamco Investors, Inc. Et Al | 17 612 | 706 | ||||||
| 2025-08-13 | 13F | Nicolet Bankshares Inc | 40 516 | 53,32 | 1 625 | 58,54 | ||||
| 2025-07-15 | 13F | Kentucky Trust Co | 670 | 0,00 | 27 | 0,00 | ||||
| 2025-08-14 | 13F/A | Skopos Labs, Inc. | 523 | 21 | ||||||
| 2025-07-28 | 13F | Lunt Capital Management, Inc. | 15 991 | −1,71 | 641 | 1,58 | ||||
| 2025-08-14 | 13F | Smartleaf Asset Management LLC | 3 358 | 134 | ||||||
| 2025-07-16 | 13F | Signaturefd, Llc | 1 | 0,00 | 0 | |||||
| 2025-07-23 | 13F | Valmark Advisers, Inc. | 3 489 258 | 0,96 | 139 954 | 4,34 | ||||
| 2025-08-01 | 13F | Purkiss Capital Advisors LLC | 52 115 | 0,00 | 2 090 | 3,36 | ||||
| 2025-07-08 | 13F | Parallel Advisors, LLC | 15 | −97,16 | 1 | −100,00 | ||||
| 2025-07-09 | 13F | Fermata Advisors, LLC | 113 507 | −1,20 | 4 553 | 2,11 | ||||
| 2025-07-18 | 13F | Forza Wealth Management, LLC | 11 238 | 0,00 | 451 | 3,21 | ||||
| 2025-07-21 | 13F | Verus Financial Partners, Inc. | 6 453 | 0,88 | 264 | 11,91 | ||||
| 2025-08-08 | 13F | Creative Planning | 32 137 | 62,09 | 1 289 | 67,62 | ||||
| 2025-07-25 | 13F | Community Bank, N.A. | 8 670 | −78,60 | 348 | −77,93 | ||||
| 2025-08-08 | 13F | Cetera Investment Advisers | 130 356 | 11,89 | 5 229 | 15,64 | ||||
| 2025-07-24 | 13F | Us Bancorp \de\ | 5 611 | −41,85 | 225 | −39,84 |