Grundläggande statistik
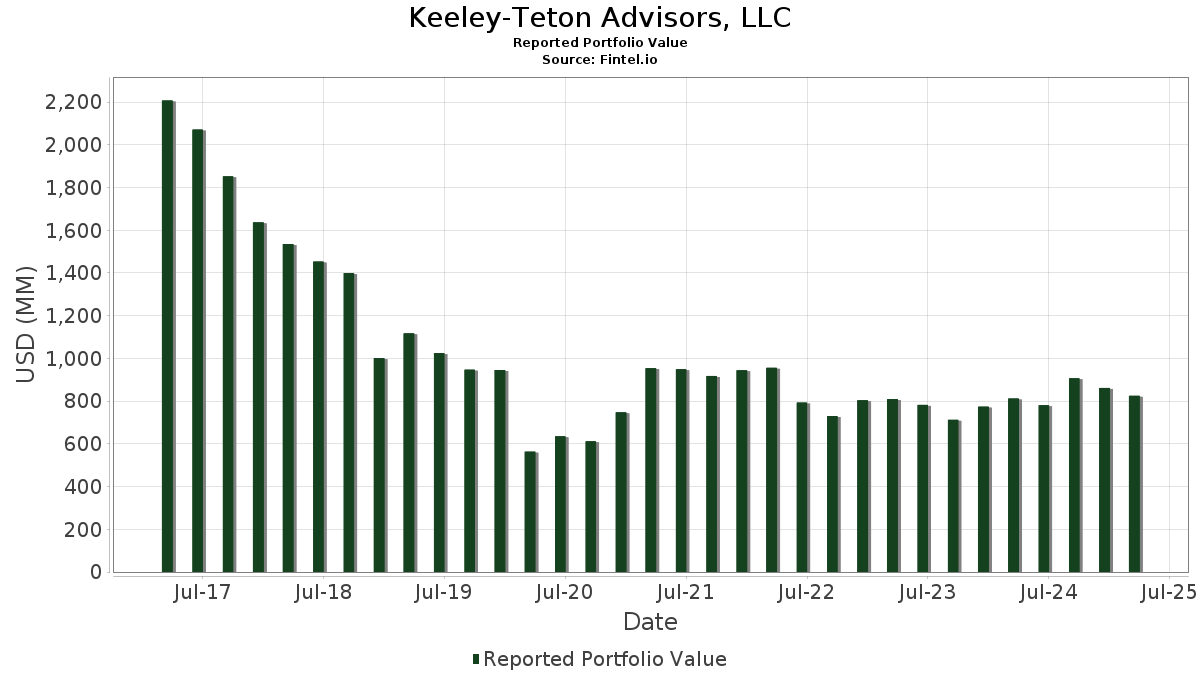
| Portföljvärde | $ 824 779 474 |
| Aktuella positioner | 362 |
Senaste innehav, resultat, förvaltat kapital (från 13F, 13D)
Keeley-Teton Advisors, LLC har redovisat 362 totala innehav i sina senaste SEC-arkiveringar. Det senaste portföljvärdet beräknas vara $ 824 779 474 USD. Faktiskt förvaltade tillgångar (AUM) är detta värde plus likvida medel (som inte redovisas). Keeley-Teton Advisors, LLCs största innehav är iShares Trust - iShares Core S&P 500 ETF (US:IVV) , Vanguard Index Funds - Vanguard Total Stock Market ETF (US:VTI) , Perrigo Company plc (US:PRGO) , The Ensign Group, Inc. (US:ENSG) , and WK Kellogg Co (US:KLG) . Keeley-Teton Advisors, LLCs nya positioner inkluderar Millrose Properties, Inc. (US:MRP) , OUTFRONT Media Inc. (US:OUT) , Tennant Company (US:TNC) , Solaris Oilfield Infrastructure, Inc. (US:SOI) , and Cboe Global Markets, Inc. (US:CBOE) .
Största ökningarna detta kvartal
Vi använder förändringen i portföljallokeringen eftersom det är det mest meningsfulla måttet. Förändringar kan bero på transaktioner eller förändringar i aktiekurser.
| Värdepapper | Aktier (MM) |
Värde (MM$) |
Portfölj % av | ΔPortfölj % av |
|---|---|---|---|---|
| 0,25 | 6,63 | 0,8043 | 0,8043 | |
| 0,31 | 5,05 | 0,6121 | 0,6121 | |
| 0,19 | 4,18 | 0,5070 | 0,2907 | |
| 0,13 | 2,33 | 0,2826 | 0,2393 | |
| 0,26 | 5,55 | 0,6723 | 0,2158 | |
| 0,02 | 1,64 | 0,1987 | 0,1987 | |
| 0,47 | 9,39 | 1,1384 | 0,1897 | |
| 0,07 | 3,59 | 0,4347 | 0,1867 | |
| 0,06 | 1,40 | 0,1695 | 0,1695 | |
| 0,38 | 10,53 | 1,2772 | 0,1662 |
Största minskningarna detta kvartal
Vi använder förändringen i portföljallokeringen eftersom det är det mest meningsfulla måttet. Förändringar kan bero på transaktioner eller förändringar i aktiepriser.
| Värdepapper | Aktier (MM) |
Värde (MM$) |
Portfölj % av | ΔPortfölj % av |
|---|---|---|---|---|
| 0,17 | 2,81 | 0,3410 | −0,3943 | |
| 0,26 | 8,36 | 1,0138 | −0,2569 | |
| 0,32 | 4,05 | 0,4908 | −0,2564 | |
| 0,03 | 3,45 | 0,4183 | −0,2436 | |
| 0,09 | 5,83 | 0,7068 | −0,2208 | |
| 0,10 | 5,69 | 0,6898 | −0,2141 | |
| 0,10 | 7,31 | 0,8867 | −0,2015 | |
| 0,15 | 3,84 | 0,4652 | −0,1775 | |
| 0,07 | 3,57 | 0,4334 | −0,1774 | |
| 0,16 | 5,11 | 0,6199 | −0,1702 |
13F- och fond arkiveringar
Denna blankett lämnades in den 2025-05-14 för rapporteringsperioden 2025-03-31. Klicka på länksymbolen för att se hela transaktionshistoriken.
Uppgradera för att låsa upp premiumdata och exportera till Excel![]() .
.
| Värdepapper | Typ | Genomsnittligt aktiepris | Aktier (MM) |
ΔAktier (%) |
ΔAktier (%) |
Värde ($MM) |
Portfölj (%) |
ΔPortfölj (%) |
|
|---|---|---|---|---|---|---|---|---|---|
| IVV / iShares Trust - iShares Core S&P 500 ETF | 0,08 | −0,18 | 43,69 | −4,72 | 5,2972 | −0,0249 | |||
| VTI / Vanguard Index Funds - Vanguard Total Stock Market ETF | 0,06 | 7,07 | 16,02 | 1,54 | 1,9423 | 0,1112 | |||
| PRGO / Perrigo Company plc | 0,38 | 0,90 | 10,53 | 10,05 | 1,2772 | 0,1662 | |||
| ENSG / The Ensign Group, Inc. | 0,07 | −2,56 | 9,64 | −5,09 | 1,1684 | −0,0101 | |||
| KLG / WK Kellogg Co | 0,47 | 3,69 | 9,39 | 14,87 | 1,1384 | 0,1897 | |||
| COLB / Columbia Banking System, Inc. | 0,37 | 2,89 | 9,17 | −5,00 | 1,1116 | −0,0084 | |||
| SSB / SouthState Corporation | 0,10 | 1,82 | 9,03 | −5,00 | 1,0951 | −0,0083 | |||
| SPY / SPDR S&P 500 ETF | 0,02 | −0,11 | 8,83 | −4,66 | 1,0701 | −0,0043 | |||
| CR / Crane Company | 0,17 | 3,63 | 8,66 | −8,52 | 1,0496 | −0,0486 | |||
| AL / Air Lease Corporation | 0,18 | 12,51 | 8,62 | 12,74 | 1,0454 | 0,1578 | |||
| FTI / TechnipFMC plc | 0,26 | −30,26 | 8,36 | −23,63 | 1,0138 | −0,2569 | |||
| CTRE / CareTrust REIT, Inc. | 0,29 | 1,62 | 8,36 | 7,36 | 1,0132 | 0,1099 | |||
| MDU / MDU Resources Group, Inc. | 0,49 | 15,85 | 8,24 | 8,72 | 0,9994 | 0,1195 | |||
| WTFC / Wintrust Financial Corporation | 0,07 | −2,76 | 7,53 | −12,31 | 0,9128 | −0,0837 | |||
| SWX / Southwest Gas Holdings, Inc. | 0,10 | −4,00 | 7,44 | −2,53 | 0,9018 | 0,0162 | |||
| SNV / Synovus Financial Corp. | 0,16 | −1,84 | 7,41 | −10,44 | 0,8983 | −0,0618 | |||
| SPB / Spectrum Brands Holdings, Inc. | 0,10 | −7,89 | 7,31 | −21,99 | 0,8867 | −0,2015 | |||
| VIRT / Virtu Financial, Inc. | 0,19 | −2,13 | 7,31 | 4,55 | 0,8862 | 0,0749 | |||
| VFH / Vanguard World Fund - Vanguard Financials ETF | 0,06 | −0,77 | 7,01 | 0,40 | 0,8497 | 0,0396 | |||
| ABM / ABM Industries Incorporated | 0,15 | 0,66 | 6,99 | −6,85 | 0,8473 | −0,0234 | |||
| STAG / STAG Industrial, Inc. | 0,19 | −6,99 | 6,70 | −0,67 | 0,8129 | 0,0295 | |||
| MRP / Millrose Properties, Inc. | 0,25 | 6,63 | 0,8043 | 0,8043 | |||||
| VCTR / Victory Capital Holdings, Inc. | 0,11 | −9,15 | 6,36 | −19,69 | 0,7716 | −0,1480 | |||
| NXST / Nexstar Media Group, Inc. | 0,03 | −1,82 | 6,13 | 11,38 | 0,7428 | 0,1045 | |||
| BKH / Black Hills Corporation | 0,10 | −1,49 | 6,06 | 2,09 | 0,7345 | 0,0458 | |||
| KTB / Kontoor Brands, Inc. | 0,09 | −2,86 | 5,83 | −27,06 | 0,7068 | −0,2208 | |||
| PRIM / Primoris Services Corporation | 0,10 | −2,79 | 5,69 | −26,96 | 0,6898 | −0,2141 | |||
| OR / OR Royalties Inc. | 0,26 | 20,82 | 5,55 | 40,99 | 0,6723 | 0,2158 | |||
| ECG / Everus Construction Group, Inc. | 0,15 | 78,13 | 5,52 | 0,49 | 0,6689 | 0,0317 | |||
| TAP / Molson Coors Beverage Company | 0,09 | 0,31 | 5,49 | 6,52 | 0,6656 | 0,0675 | |||
| UHALB / U-Haul Holding Company - Series N | 0,09 | −8,06 | 5,27 | −15,05 | 0,6388 | −0,0810 | |||
| EVTC / EVERTEC, Inc. | 0,14 | −2,80 | 5,24 | 3,50 | 0,6352 | 0,0477 | |||
| KBH / KB Home | 0,09 | −1,63 | 5,23 | −13,00 | 0,6335 | −0,0636 | |||
| CADE / Cadence Bank | 0,17 | −2,31 | 5,12 | −13,91 | 0,6205 | −0,0694 | |||
| HLIO / Helios Technologies, Inc. | 0,16 | 4,48 | 5,11 | −24,89 | 0,6199 | −0,1702 | |||
| SPFI / South Plains Financial, Inc. | 0,15 | −2,79 | 5,09 | −7,36 | 0,6167 | −0,0205 | |||
| OUT / OUTFRONT Media Inc. | 0,31 | 5,05 | 0,6121 | 0,6121 | |||||
| AMBP / Ardagh Metal Packaging S.A. | 1,60 | −0,61 | 4,83 | −0,29 | 0,5858 | 0,0235 | |||
| AQNB / Algonquin Power & Utilities Corp. - Corporate Bond/Note | 0,93 | −0,48 | 4,79 | 14,97 | 0,5802 | 0,0970 | |||
| REZ / iShares Trust - iShares Residential and Multisector Real Estate ETF | 0,06 | −1,79 | 4,78 | 4,75 | 0,5801 | 0,0500 | |||
| PINE / Alpine Income Property Trust, Inc. | 0,29 | −0,02 | 4,77 | −0,44 | 0,5789 | 0,0223 | |||
| DLB / Dolby Laboratories, Inc. | 0,06 | −1,63 | 4,66 | 1,15 | 0,5651 | 0,0303 | |||
| HTH / Hilltop Holdings Inc. | 0,15 | 0,00 | 4,62 | 6,35 | 0,5605 | 0,0560 | |||
| FHI / Federated Hermes, Inc. | 0,11 | −2,81 | 4,51 | −3,63 | 0,5472 | 0,0038 | |||
| KALU / Kaiser Aluminum Corporation | 0,07 | −0,48 | 4,46 | −14,15 | 0,5407 | −0,0622 | |||
| CHE / Chemed Corporation | 0,01 | −0,28 | 4,44 | 15,85 | 0,5380 | 0,0933 | |||
| PRMB / Primo Brands Corporation | 0,12 | −2,78 | 4,44 | 12,11 | 0,5378 | 0,0787 | |||
| FBNC / First Bancorp | 0,11 | −2,78 | 4,36 | −11,25 | 0,5288 | −0,0415 | |||
| FLS / Flowserve Corporation | 0,09 | 12,09 | 4,23 | −4,83 | 0,5133 | −0,0030 | |||
| ALRS / Alerus Financial Corporation | 0,23 | 34,26 | 4,20 | 28,81 | 0,5091 | 0,1308 | |||
| CON / Concentra Group Holdings Parent, Inc. | 0,19 | 104,49 | 4,18 | 124,30 | 0,5070 | 0,2907 | |||
| TSBK / Timberland Bancorp, Inc. | 0,14 | 1,93 | 4,16 | 0,73 | 0,5043 | 0,0251 | |||
| GMRE / Global Medical REIT Inc. | 0,47 | 0,00 | 4,13 | 13,34 | 0,5007 | 0,0778 | |||
| EQH / Equitable Holdings, Inc. | 0,08 | −2,47 | 4,12 | 7,70 | 0,5001 | 0,0556 | |||
| EMBC / Embecta Corp. | 0,32 | 1,84 | 4,05 | −37,13 | 0,4908 | −0,2564 | |||
| NRG / NRG Energy, Inc. | 0,04 | −0,57 | 4,00 | 5,19 | 0,4845 | 0,0436 | |||
| VB / Vanguard Index Funds - Vanguard Small-Cap ETF | 0,02 | 0,00 | 3,97 | −7,72 | 0,4813 | −0,0179 | |||
| NPO / Enpro Inc. | 0,02 | −20,87 | 3,95 | −25,76 | 0,4785 | −0,1385 | |||
| SILA / Sila Realty Trust, Inc. | 0,15 | 0,00 | 3,91 | 9,83 | 0,4744 | 0,0609 | |||
| NATL / NCR Atleos Corporation | 0,15 | −10,90 | 3,84 | −30,71 | 0,4652 | −0,1775 | |||
| ACT / Enact Holdings, Inc. | 0,11 | −9,58 | 3,82 | −2,97 | 0,4629 | 0,0063 | |||
| ONB / Old National Bancorp | 0,17 | 7,20 | 3,70 | 4,64 | 0,4483 | 0,0382 | |||
| MERC / Mercer International Inc. | 0,60 | 0,00 | 3,69 | −5,39 | 0,4471 | −0,0052 | |||
| AESI / Atlas Energy Solutions Inc. | 0,20 | −2,80 | 3,64 | −21,84 | 0,4414 | −0,0990 | |||
| BERY / Berry Global Group, Inc. | 0,05 | −22,59 | 3,61 | −16,45 | 0,4374 | −0,0636 | |||
| JPST / J.P. Morgan Exchange-Traded Fund Trust - JPMorgan Ultra-Short Income ETF | 0,07 | 66,91 | 3,59 | 67,76 | 0,4347 | 0,1867 | |||
| PRGS / Progress Software Corporation | 0,07 | −14,09 | 3,57 | −32,08 | 0,4334 | −0,1774 | |||
| UGI / UGI Corporation | 0,11 | 1,06 | 3,57 | 18,40 | 0,4332 | 0,0829 | |||
| MDY / SPDR S&P MidCap 400 ETF Trust | 0,01 | 8,46 | 3,55 | 1,60 | 0,4304 | 0,0248 | |||
| SAMG / Silvercrest Asset Management Group Inc. | 0,21 | −6,62 | 3,49 | −16,92 | 0,4232 | −0,0644 | |||
| CASS / Cass Information Systems, Inc. | 0,08 | 0,00 | 3,49 | 5,73 | 0,4228 | 0,0400 | |||
| OSK / Oshkosh Corporation | 0,04 | 40,77 | 3,48 | 39,32 | 0,4215 | 0,1319 | |||
| GEN / Gen Digital Inc. | 0,13 | 1,08 | 3,46 | −2,04 | 0,4193 | 0,0097 | |||
| JBL / Jabil Inc. | 0,03 | 0,25 | 3,46 | −5,21 | 0,4190 | −0,0041 | |||
| HRI / Herc Holdings Inc. | 0,03 | −14,69 | 3,45 | −39,49 | 0,4183 | −0,2436 | |||
| PLOW / Douglas Dynamics, Inc. | 0,15 | 55,65 | 3,45 | 53,00 | 0,4180 | 0,1565 | |||
| ESAB / ESAB Corporation | 0,03 | −25,05 | 3,44 | −27,20 | 0,4167 | −0,1312 | |||
| HTLD / Heartland Express, Inc. | 0,37 | 0,00 | 3,37 | −17,83 | 0,4085 | −0,0674 | |||
| INSW / International Seaways, Inc. | 0,10 | 49,30 | 3,36 | 37,94 | 0,4078 | 0,1247 | |||
| URI / United Rentals, Inc. | 0,01 | −3,63 | 3,33 | −14,25 | 0,4034 | −0,0470 | |||
| CHRD / Chord Energy Corporation | 0,03 | −2,71 | 3,32 | −6,21 | 0,4030 | −0,0083 | |||
| WHD / Cactus, Inc. | 0,07 | 10,58 | 3,31 | −13,19 | 0,4008 | −0,0410 | |||
| TTMI / TTM Technologies, Inc. | 0,16 | −5,85 | 3,30 | −21,98 | 0,3999 | −0,0908 | |||
| NSA / National Storage Affiliates Trust | 0,08 | −8,45 | 3,28 | −4,84 | 0,3978 | −0,0024 | |||
| IJH / iShares Trust - iShares Core S&P Mid-Cap ETF | 0,06 | 67,62 | 3,26 | 57,02 | 0,3947 | 0,1540 | |||
| PPBI / Pacific Premier Bancorp, Inc. | 0,15 | −2,81 | 3,25 | −16,85 | 0,3943 | −0,0596 | |||
| QQQ / Invesco QQQ Trust, Series 1 | 0,01 | −2,17 | 3,16 | −10,27 | 0,3836 | −0,0256 | |||
| LAMR / Lamar Advertising Company | 0,03 | 0,09 | 3,12 | −6,44 | 0,3786 | −0,0088 | |||
| FNV / Franco-Nevada Corporation | 0,02 | 1,03 | 3,12 | 35,35 | 0,3780 | 0,1107 | |||
| EXE / Expand Energy Corporation | 0,03 | 0,16 | 3,10 | 12,02 | 0,3753 | 0,0545 | |||
| ALE / ALLETE, Inc. | 0,05 | −25,64 | 3,09 | −24,60 | 0,3746 | −0,1010 | |||
| BC / Brunswick Corporation | 0,06 | 26,58 | 3,01 | 5,39 | 0,3654 | 0,0335 | |||
| EVRG / Evergy, Inc. | 0,04 | −6,40 | 3,01 | 4,88 | 0,3648 | 0,0318 | |||
| NFG / National Fuel Gas Company | 0,04 | 0,99 | 2,98 | 31,83 | 0,3611 | 0,0988 | |||
| MDYG / SPDR Series Trust - SPDR S&P 400 Mid Cap Growth ETF | 0,04 | −0,85 | 2,95 | −9,35 | 0,3576 | −0,0199 | |||
| STC / Stewart Information Services Corporation | 0,04 | 14,69 | 2,94 | 21,27 | 0,3567 | 0,0751 | |||
| OLN / Olin Corporation | 0,12 | −2,99 | 2,91 | −30,44 | 0,3533 | −0,1328 | |||
| EGY / VAALCO Energy, Inc. | 0,77 | −9,57 | 2,91 | −22,19 | 0,3528 | −0,0813 | |||
| JACK / Jack in the Box Inc. | 0,10 | 0,00 | 2,85 | −34,72 | 0,3455 | −0,1610 | |||
| CR / Crane Company | 0,02 | −12,36 | 2,84 | −11,52 | 0,3445 | −0,0282 | |||
| KNF / Knife River Corporation | 0,03 | −0,79 | 2,84 | −11,95 | 0,3441 | −0,0300 | |||
| AUB / Atlantic Union Bankshares Corporation | 0,09 | −6,48 | 2,82 | −23,13 | 0,3417 | −0,0838 | |||
| CMCO / Columbus McKinnon Corporation | 0,17 | −2,35 | 2,81 | −55,61 | 0,3410 | −0,3943 | |||
| RGA / Reinsurance Group of America, Incorporated | 0,01 | −0,50 | 2,77 | −8,27 | 0,3362 | −0,0147 | |||
| PLYM / Plymouth Industrial REIT, Inc. | 0,16 | −2,78 | 2,66 | −10,96 | 0,3230 | −0,0243 | |||
| BPOP / Popular, Inc. | 0,03 | 0,06 | 2,63 | −1,75 | 0,3195 | 0,0083 | |||
| DCO / Ducommun Incorporated | 0,04 | 11,32 | 2,57 | 1,46 | 0,3113 | 0,0177 | |||
| IMKTA / Ingles Markets, Incorporated | 0,04 | −1,25 | 2,57 | −0,19 | 0,3112 | 0,0127 | |||
| ITT / ITT Inc. | 0,02 | −0,32 | 2,56 | −9,88 | 0,3108 | −0,0194 | |||
| SMP / Standard Motor Products, Inc. | 0,10 | −0,51 | 2,44 | −19,93 | 0,2961 | −0,0579 | |||
| HEES / H&E Equipment Services, Inc. | 0,03 | −17,87 | 2,42 | 59,01 | 0,2931 | 0,1166 | |||
| ESNT / Essent Group Ltd. | 0,04 | −1,16 | 2,41 | 4,79 | 0,2918 | 0,0253 | |||
| COP / ConocoPhillips | 0,02 | 11,44 | 2,39 | 18,01 | 0,2901 | 0,0548 | |||
| EHC / Encompass Health Corporation | 0,02 | 1,07 | 2,37 | 10,83 | 0,2879 | 0,0393 | |||
| HAS / Hasbro, Inc. | 0,04 | −0,06 | 2,37 | 9,92 | 0,2876 | 0,0371 | |||
| SOC / Sable Offshore Corp. | 0,09 | −0,69 | 2,36 | 10,02 | 0,2862 | 0,0372 | |||
| AMTM / Amentum Holdings, Inc. | 0,13 | 621,30 | 2,33 | 524,93 | 0,2826 | 0,2393 | |||
| TCBI / Texas Capital Bancshares, Inc. | 0,03 | −1,08 | 2,32 | −5,50 | 0,2815 | −0,0037 | |||
| MTX / Minerals Technologies Inc. | 0,04 | 4,59 | 2,32 | −12,76 | 0,2810 | −0,0273 | |||
| NTCT / NetScout Systems, Inc. | 0,11 | 36,39 | 2,30 | 32,34 | 0,2794 | 0,0772 | |||
| ALSN / Allison Transmission Holdings, Inc. | 0,02 | −11,60 | 2,29 | −21,75 | 0,2775 | −0,0619 | |||
| VICI / VICI Properties Inc. | 0,07 | −0,80 | 2,28 | 10,77 | 0,2769 | 0,0376 | |||
| PB / Prosperity Bancshares, Inc. | 0,03 | 1,12 | 2,25 | −4,21 | 0,2732 | 0,0002 | |||
| BECN / Beacon Roofing Supply, Inc. | 0,02 | −45,62 | 2,25 | −33,78 | 0,2726 | −0,1215 | |||
| KFY / Korn Ferry | 0,03 | 29,67 | 2,23 | 30,39 | 0,2706 | 0,0720 | |||
| SCVL / Shoe Carnival, Inc. | 0,10 | −2,79 | 2,19 | −35,39 | 0,2658 | −0,1279 | |||
| EXC / Exelon Corporation | 0,05 | 7,05 | 2,19 | 31,13 | 0,2650 | 0,0715 | |||
| BRX / Brixmor Property Group Inc. | 0,08 | 1,09 | 2,18 | −3,62 | 0,2648 | 0,0019 | |||
| NVT / nVent Electric plc | 0,04 | 0,21 | 2,17 | −22,93 | 0,2633 | −0,0637 | |||
| R / Ryder System, Inc. | 0,01 | −1,18 | 2,16 | −9,38 | 0,2613 | −0,0148 | |||
| GEV / GE Vernova Inc. | 0,01 | −0,89 | 2,15 | −8,03 | 0,2610 | −0,0106 | |||
| K / Kellanova | 0,03 | −0,74 | 2,12 | 1,10 | 0,2575 | 0,0137 | |||
| EFA / iShares Trust - iShares MSCI EAFE ETF | 0,03 | 0,23 | 2,12 | 8,32 | 0,2575 | 0,0300 | |||
| PKOH / Park-Ohio Holdings Corp. | 0,10 | 0,12 | 2,07 | −17,68 | 0,2513 | −0,0409 | |||
| WH / Wyndham Hotels & Resorts, Inc. | 0,02 | −0,07 | 2,07 | −10,28 | 0,2508 | −0,0167 | |||
| EPR / EPR Properties | 0,04 | −1,22 | 2,07 | 17,38 | 0,2507 | 0,0462 | |||
| SNX / TD SYNNEX Corporation | 0,02 | 0,08 | 2,07 | −11,30 | 0,2505 | −0,0198 | |||
| VOYA / Voya Financial, Inc. | 0,03 | 0,27 | 2,01 | −1,28 | 0,2435 | 0,0074 | |||
| SANM / Sanmina Corporation | 0,03 | −1,13 | 2,00 | −0,45 | 0,2429 | 0,0093 | |||
| STRW / Strawberry Fields REIT, Inc. | 0,17 | 7,40 | 2,00 | 21,39 | 0,2429 | 0,0513 | |||
| IMAX / IMAX Corporation | 0,07 | 27,44 | 1,96 | 31,22 | 0,2381 | 0,0643 | |||
| FANG / Diamondback Energy, Inc. | 0,01 | 1,08 | 1,96 | −1,36 | 0,2374 | 0,0070 | |||
| BUSE / First Busey Corporation | 0,09 | −1,27 | 1,92 | −9,53 | 0,2326 | −0,0135 | |||
| KN / Knowles Corporation | 0,13 | 27,15 | 1,91 | −3,00 | 0,2316 | 0,0030 | |||
| UHS / Universal Health Services, Inc. | 0,01 | 1,07 | 1,90 | 5,85 | 0,2304 | 0,0220 | |||
| VMC / Vulcan Materials Company | 0,01 | 1,00 | 1,90 | −8,39 | 0,2303 | −0,0103 | |||
| CMA / Comerica Incorporated | 0,03 | 0,68 | 1,89 | −3,86 | 0,2297 | 0,0010 | |||
| UMBF / UMB Financial Corporation | 0,02 | −1,14 | 1,89 | −11,47 | 0,2294 | −0,0185 | |||
| MLAB / Mesa Laboratories, Inc. | 0,02 | −28,73 | 1,86 | −35,86 | 0,2256 | −0,1111 | |||
| VONG / Vanguard Scottsdale Funds - Vanguard Russell 1000 Growth ETF | 0,02 | 0,00 | 1,84 | −10,19 | 0,2235 | −0,0147 | |||
| CRDA / Crawford & Co. - Class A | 0,16 | −1,06 | 1,83 | −2,24 | 0,2224 | 0,0046 | |||
| ETD / Ethan Allen Interiors Inc. | 0,07 | 36,39 | 1,83 | 34,41 | 0,2217 | 0,0638 | |||
| VWO / Vanguard International Equity Index Funds - Vanguard FTSE Emerging Markets ETF | 0,04 | 0,00 | 1,81 | 2,79 | 0,2189 | 0,0150 | |||
| SKY / Champion Homes, Inc. | 0,02 | 36,38 | 1,79 | 46,73 | 0,2175 | 0,0756 | |||
| MWA / Mueller Water Products, Inc. | 0,07 | 22,84 | 1,79 | 38,77 | 0,2166 | 0,0672 | |||
| AMP / Ameriprise Financial, Inc. | 0,00 | 0,22 | 1,78 | −8,86 | 0,2157 | −0,0109 | |||
| CNH / CNH Industrial N.V. | 0,14 | 0,00 | 1,78 | 8,41 | 0,2156 | 0,0252 | |||
| CNO / CNO Financial Group, Inc. | 0,04 | −1,14 | 1,75 | 10,66 | 0,2128 | 0,0287 | |||
| AIR / AAR Corp. | 0,03 | 36,38 | 1,73 | 24,66 | 0,2102 | 0,0487 | |||
| ELS / Equity LifeStyle Properties, Inc. | 0,03 | 0,98 | 1,73 | 1,11 | 0,2096 | 0,0112 | |||
| AEIS / Advanced Energy Industries, Inc. | 0,02 | 36,38 | 1,73 | 12,43 | 0,2095 | 0,0311 | |||
| RPM / RPM International Inc. | 0,01 | 1,06 | 1,70 | −5,02 | 0,2066 | −0,0016 | |||
| LW / Lamb Weston Holdings, Inc. | 0,03 | −0,84 | 1,69 | −20,93 | 0,2049 | −0,0431 | |||
| CVCO / Cavco Industries, Inc. | 0,00 | −1,19 | 1,69 | 15,09 | 0,2044 | 0,0344 | |||
| PAG / Penske Automotive Group, Inc. | 0,01 | −20,45 | 1,68 | −24,89 | 0,2039 | −0,0559 | |||
| BRK.B / Berkshire Hathaway Inc. | 0,00 | 0,00 | 1,68 | 17,52 | 0,2034 | 0,0377 | |||
| TNC / Tennant Company | 0,02 | 1,64 | 0,1987 | 0,1987 | |||||
| VBTX / Veritex Holdings, Inc. | 0,07 | 36,39 | 1,64 | 25,44 | 0,1985 | 0,0470 | |||
| FBIN / Fortune Brands Innovations, Inc. | 0,03 | 0,11 | 1,63 | −10,81 | 0,1981 | −0,0145 | |||
| NOV / NOV Inc. | 0,11 | 1,06 | 1,63 | 5,35 | 0,1980 | 0,0181 | |||
| BATRK / Atlanta Braves Holdings, Inc. | 0,04 | −47,17 | 1,63 | −44,75 | 0,1973 | −0,1445 | |||
| PVH / PVH Corp. | 0,02 | −0,57 | 1,61 | −39,22 | 0,1955 | −0,1124 | |||
| BRK.A / Berkshire Hathaway Inc. | 0,00 | 0,00 | 1,60 | 17,27 | 0,1936 | 0,0356 | |||
| TKR / The Timken Company | 0,02 | 1,09 | 1,59 | 1,79 | 0,1929 | 0,0115 | |||
| RRX / Regal Rexnord Corporation | 0,01 | 1,01 | 1,58 | −25,88 | 0,1914 | −0,0557 | |||
| ALV / Autoliv, Inc. | 0,02 | 1,05 | 1,55 | −4,67 | 0,1880 | −0,0008 | |||
| RUSHA / Rush Enterprises, Inc. | 0,03 | 36,38 | 1,55 | 32,96 | 0,1879 | 0,0526 | |||
| ASH / Ashland Inc. | 0,03 | 0,15 | 1,54 | −16,93 | 0,1863 | −0,0283 | |||
| DVY / iShares Trust - iShares Select Dividend ETF | 0,01 | −4,25 | 1,51 | −2,07 | 0,1833 | 0,0041 | |||
| MAN / ManpowerGroup Inc. | 0,03 | −1,16 | 1,51 | −0,92 | 0,1829 | 0,0062 | |||
| BHE / Benchmark Electronics, Inc. | 0,04 | −1,14 | 1,50 | −17,19 | 0,1823 | −0,0284 | |||
| OMC / Omnicom Group Inc. | 0,02 | 1,09 | 1,50 | −2,53 | 0,1821 | 0,0032 | |||
| LSEA / Landsea Homes Corporation | 0,23 | 260,13 | 1,45 | 172,28 | 0,1764 | 0,1144 | |||
| KAR / OPENLANE, Inc. | 0,08 | −22,92 | 1,45 | −25,12 | 0,1754 | −0,0488 | |||
| AJG / Arthur J. Gallagher & Co. | 0,00 | 0,19 | 1,44 | 21,88 | 0,1743 | 0,0374 | |||
| BBWI / Bath & Body Works, Inc. | 0,05 | 0,01 | 1,44 | −21,80 | 0,1741 | −0,0390 | |||
| HSII / Heidrick & Struggles International, Inc. | 0,03 | 36,39 | 1,40 | 31,83 | 0,1702 | 0,0466 | |||
| SOI / Solaris Oilfield Infrastructure, Inc. | 0,06 | 1,40 | 0,1695 | 0,1695 | |||||
| CBT / Cabot Corporation | 0,02 | 1,05 | 1,39 | −7,99 | 0,1689 | −0,0068 | |||
| NGVT / Ingevity Corporation | 0,03 | −1,21 | 1,38 | −4,02 | 0,1678 | 0,0004 | |||
| OSIS / OSI Systems, Inc. | 0,01 | −41,20 | 1,38 | −31,74 | 0,1677 | −0,0675 | |||
| OFIX / Orthofix Medical Inc. | 0,08 | 36,39 | 1,36 | 27,48 | 0,1654 | 0,0411 | |||
| KOP / Koppers Holdings Inc. | 0,05 | 0,00 | 1,34 | −13,62 | 0,1623 | −0,0175 | |||
| AXGN / Axogen, Inc. | 0,07 | 22,68 | 1,29 | 37,70 | 0,1569 | 0,0478 | |||
| EMN / Eastman Chemical Company | 0,01 | −13,90 | 1,28 | −16,92 | 0,1555 | −0,0237 | |||
| SHYF / The Shyft Group, Inc. | 0,16 | −2,21 | 1,27 | −32,64 | 0,1542 | −0,0648 | |||
| KLIC / Kulicke and Soffa Industries, Inc. | 0,04 | −1,12 | 1,27 | −30,14 | 0,1538 | −0,0569 | |||
| SIMO / Silicon Motion Technology Corporation - Depositary Receipt (Common Stock) | 0,03 | −1,12 | 1,27 | −7,53 | 0,1534 | −0,0054 | |||
| QABA / First Trust Exchange-Traded Fund - First Trust NASDAQ ABA Community Bank Index Fund | 0,02 | −15,15 | 1,27 | −20,14 | 0,1534 | −0,0305 | |||
| AMWD / American Woodmark Corporation | 0,02 | −1,16 | 1,26 | −26,88 | 0,1531 | −0,0473 | |||
| VLTO / Veralto Corporation | 0,01 | 0,24 | 1,26 | −4,12 | 0,1524 | 0,0003 | |||
| IWN / iShares Trust - iShares Russell 2000 Value ETF | 0,01 | 53,90 | 1,25 | 41,56 | 0,1516 | 0,0491 | |||
| ACI / Albertsons Companies, Inc. | 0,06 | −10,44 | 1,24 | 0,24 | 0,1498 | 0,0068 | |||
| PSX / Phillips 66 | 0,01 | −2,30 | 1,22 | 5,91 | 0,1479 | 0,0142 | |||
| MGY / Magnolia Oil & Gas Corporation | 0,05 | 36,38 | 1,20 | 47,36 | 0,1456 | 0,0510 | |||
| TGI / Triumph Group, Inc. | 0,05 | −61,70 | 1,20 | −47,98 | 0,1454 | −0,1222 | |||
| WCC / WESCO International, Inc. | 0,01 | 0,18 | 1,20 | −14,02 | 0,1451 | −0,0164 | |||
| ACCO / ACCO Brands Corporation | 0,28 | −1,65 | 1,18 | −21,57 | 0,1434 | −0,0315 | |||
| RMBI / Richmond Mutual Bancorporation, Inc. | 0,09 | −4,87 | 1,18 | −14,00 | 0,1430 | −0,0161 | |||
| FLR / Fluor Corporation | 0,03 | 40,01 | 1,17 | 1,73 | 0,1422 | 0,0083 | |||
| AEO / American Eagle Outfitters, Inc. | 0,10 | 36,39 | 1,16 | −4,93 | 0,1403 | −0,0010 | |||
| WLK / Westlake Corporation | 0,01 | −14,90 | 1,16 | −25,80 | 0,1403 | −0,0406 | |||
| VMEO / Vimeo, Inc. | 0,21 | 36,39 | 1,12 | 12,18 | 0,1363 | 0,0199 | |||
| MYRG / MYR Group Inc. | 0,01 | 36,38 | 1,12 | 3,71 | 0,1355 | 0,0104 | |||
| CME / CME Group Inc. | 0,00 | 0,00 | 1,11 | 14,26 | 0,1351 | 0,0219 | |||
| AAP / Advance Auto Parts, Inc. | 0,03 | 71,12 | 1,10 | 41,96 | 0,1338 | 0,0435 | |||
| SWKS / Skyworks Solutions, Inc. | 0,02 | 1,06 | 1,10 | −26,41 | 0,1329 | −0,0398 | |||
| PLAY / Dave & Buster's Entertainment, Inc. | 0,06 | −1,27 | 1,09 | −40,58 | 0,1319 | −0,0806 | |||
| MAA / Mid-America Apartment Communities, Inc. | 0,01 | 2,12 | 1,08 | 10,64 | 0,1311 | 0,0178 | |||
| LHX / L3Harris Technologies, Inc. | 0,01 | 0,00 | 1,08 | −0,46 | 0,1305 | 0,0050 | |||
| TT / Trane Technologies plc | 0,00 | −3,40 | 1,03 | −11,95 | 0,1252 | −0,0108 | |||
| VLO / Valero Energy Corporation | 0,01 | 1,05 | 1,03 | 8,93 | 0,1243 | 0,0150 | |||
| AMRK / A-Mark Precious Metals, Inc. | 0,04 | −20,16 | 1,00 | −26,12 | 0,1218 | −0,0359 | |||
| OEC / Orion S.A. | 0,08 | −1,19 | 1,00 | −19,06 | 0,1215 | −0,0222 | |||
| LASR / nLIGHT, Inc. | 0,13 | 89,70 | 0,99 | 40,48 | 0,1200 | 0,0382 | |||
| PRG / PROG Holdings, Inc. | 0,04 | 0,00 | 0,99 | −37,06 | 0,1195 | −0,0622 | |||
| WTS / Watts Water Technologies, Inc. | 0,00 | −11,34 | 0,97 | −11,10 | 0,1175 | −0,0090 | |||
| IWM / iShares Trust - iShares Russell 2000 ETF | 0,00 | −0,82 | 0,96 | −10,49 | 0,1169 | −0,0081 | |||
| MPC / Marathon Petroleum Corporation | 0,01 | 0,00 | 0,96 | 4,46 | 0,1164 | 0,0097 | |||
| VIG / Vanguard Specialized Funds - Vanguard Dividend Appreciation ETF | 0,00 | 0,00 | 0,93 | −0,96 | 0,1131 | 0,0038 | |||
| URBN / Urban Outfitters, Inc. | 0,02 | 0,00 | 0,92 | −4,47 | 0,1113 | −0,0003 | |||
| OMCL / Omnicell, Inc. | 0,03 | 36,39 | 0,90 | 7,01 | 0,1093 | 0,0116 | |||
| LCII / LCI Industries | 0,01 | −28,79 | 0,90 | −39,81 | 0,1086 | −0,0640 | |||
| HIW / Highwoods Properties, Inc. | 0,03 | 1,10 | 0,89 | −2,09 | 0,1083 | 0,0025 | |||
| VTR / Ventas, Inc. | 0,01 | 0,10 | 0,89 | 16,91 | 0,1074 | 0,0194 | |||
| HLIT / Harmonic Inc. | 0,09 | 36,39 | 0,88 | −1,23 | 0,1072 | 0,0034 | |||
| EQR / Equity Residential | 0,01 | 2,45 | 0,88 | 2,21 | 0,1065 | 0,0067 | |||
| BANC / Banc of California, Inc. | 0,06 | 36,39 | 0,85 | 25,22 | 0,1036 | 0,0244 | |||
| AAPL / Apple Inc. | 0,00 | −0,80 | 0,83 | −11,97 | 0,1008 | −0,0088 | |||
| AMZN / Amazon.com, Inc. | 0,00 | 0,00 | 0,83 | −13,28 | 0,1006 | −0,0104 | |||
| WSFS / WSFS Financial Corporation | 0,02 | −1,16 | 0,83 | −3,51 | 0,1001 | 0,0008 | |||
| A / Agilent Technologies, Inc. | 0,01 | 1,04 | 0,82 | −12,04 | 0,0992 | −0,0087 | |||
| COHU / Cohu, Inc. | 0,06 | 79,05 | 0,82 | −1,33 | 0,0991 | 0,0029 | |||
| CNM / Core & Main, Inc. | 0,02 | −1,93 | 0,80 | −6,98 | 0,0969 | −0,0028 | |||
| NECB / Northeast Community Bancorp, Inc. | 0,03 | −22,73 | 0,80 | −26,02 | 0,0966 | −0,0283 | |||
| VO / Vanguard Index Funds - Vanguard Mid-Cap ETF | 0,00 | 0,00 | 0,79 | −2,11 | 0,0958 | 0,0021 | |||
| NBHC / National Bank Holdings Corporation | 0,02 | −1,16 | 0,77 | −12,24 | 0,0931 | −0,0083 | |||
| SOLV / Solventum Corporation | 0,01 | −3,45 | 0,76 | 11,05 | 0,0927 | 0,0129 | |||
| WOR / Worthington Enterprises, Inc. | 0,01 | 168,08 | 0,75 | 235,43 | 0,0908 | 0,0648 | |||
| GUNR / FlexShares Trust - FlexShares Morningstar Global Upstream Natural Resources Index Fund | 0,02 | −2,23 | 0,72 | 4,34 | 0,0875 | 0,0072 | |||
| HAE / Haemonetics Corporation | 0,01 | 105,72 | 0,72 | 67,52 | 0,0870 | 0,0373 | |||
| DIN / Dine Brands Global, Inc. | 0,03 | −1,25 | 0,71 | −23,64 | 0,0866 | −0,0220 | |||
| TPH / Tri Pointe Homes, Inc. | 0,02 | 20,97 | 0,71 | 6,45 | 0,0862 | 0,0087 | |||
| GTLS / Chart Industries, Inc. | 0,00 | −3,32 | 0,71 | −26,91 | 0,0860 | −0,0266 | |||
| OGN / Organon & Co. | 0,05 | −0,03 | 0,70 | −0,28 | 0,0854 | 0,0035 | |||
| FSBC / Five Star Bancorp | 0,03 | 36,38 | 0,70 | 25,99 | 0,0853 | 0,0205 | |||
| MKSI / MKS Inc. | 0,01 | 36,38 | 0,70 | 4,80 | 0,0847 | 0,0073 | |||
| HHH / Howard Hughes Holdings Inc. | 0,01 | −9,33 | 0,68 | −12,68 | 0,0828 | −0,0080 | |||
| WAFD / WaFd, Inc | 0,02 | 36,39 | 0,68 | 20,93 | 0,0820 | 0,0171 | |||
| OII / Oceaneering International, Inc. | 0,03 | 36,39 | 0,67 | 14,04 | 0,0808 | 0,0130 | |||
| DFS / Discover Financial Services | 0,00 | −46,95 | 0,66 | −47,72 | 0,0805 | −0,0669 | |||
| ATNI / ATN International, Inc. | 0,03 | 36,39 | 0,65 | 64,89 | 0,0787 | 0,0330 | |||
| HI / Hillenbrand, Inc. | 0,03 | 25,75 | 0,65 | −1,38 | 0,0783 | 0,0023 | |||
| USCB / USCB Financial Holdings, Inc. | 0,03 | 36,38 | 0,63 | 42,63 | 0,0763 | 0,0251 | |||
| BLMN / Bloomin' Brands, Inc. | 0,09 | −1,12 | 0,63 | −41,96 | 0,0762 | −0,0494 | |||
| HBNC / Horizon Bancorp, Inc. | 0,04 | 0,00 | 0,62 | −6,39 | 0,0746 | −0,0017 | |||
| SUPN / Supernus Pharmaceuticals, Inc. | 0,02 | 36,38 | 0,61 | 23,53 | 0,0738 | 0,0166 | |||
| GXO / GXO Logistics, Inc. | 0,02 | −6,10 | 0,60 | −15,69 | 0,0730 | −0,0098 | |||
| WGO / Winnebago Industries, Inc. | 0,02 | −1,26 | 0,60 | −28,83 | 0,0729 | −0,0251 | |||
| UHAL / U-Haul Holding Company | 0,01 | −6,03 | 0,59 | −11,14 | 0,0716 | −0,0055 | |||
| UVSP / Univest Financial Corporation | 0,02 | 36,38 | 0,59 | 31,03 | 0,0712 | 0,0192 | |||
| OCFC / OceanFirst Financial Corp. | 0,03 | 36,38 | 0,58 | 28,26 | 0,0705 | 0,0179 | |||
| EBC / Eastern Bankshares, Inc. | 0,04 | −22,22 | 0,57 | −26,03 | 0,0696 | −0,0205 | |||
| GLPI / Gaming and Leisure Properties, Inc. | 0,01 | −3,53 | 0,57 | 1,96 | 0,0694 | 0,0042 | |||
| IYF / iShares Trust - iShares U.S. Financials ETF | 0,00 | −22,83 | 0,56 | −21,29 | 0,0682 | −0,0147 | |||
| BWXT / BWX Technologies, Inc. | 0,01 | 0,18 | 0,56 | −11,27 | 0,0679 | −0,0054 | |||
| AVNT / Avient Corporation | 0,01 | 36,38 | 0,56 | 24,16 | 0,0673 | 0,0154 | |||
| CARR / Carrier Global Corporation | 0,01 | 0,00 | 0,55 | −7,14 | 0,0663 | −0,0020 | |||
| VSCO / Victoria's Secret & Co. | 0,03 | 26,64 | 0,54 | −43,17 | 0,0651 | −0,0446 | |||
| TDC / Teradata Corporation | 0,02 | 36,19 | 0,54 | −1,65 | 0,0649 | 0,0017 | |||
| DAR / Darling Ingredients Inc. | 0,02 | 36,39 | 0,53 | 26,51 | 0,0637 | 0,0155 | |||
| PNTG / The Pennant Group, Inc. | 0,02 | −3,42 | 0,52 | −8,39 | 0,0635 | −0,0029 | |||
| PTEN / Patterson-UTI Energy, Inc. | 0,06 | 36,39 | 0,52 | 35,86 | 0,0630 | 0,0186 | |||
| LOCO / El Pollo Loco Holdings, Inc. | 0,05 | 36,39 | 0,51 | 21,62 | 0,0622 | 0,0133 | |||
| NVDD / Direxion Shares ETF Trust - Direxion Daily NVDA Bear 1X Shares | 0,00 | 0,00 | 0,51 | −19,24 | 0,0621 | −0,0116 | |||
| VNT / Vontier Corporation | 0,02 | −3,52 | 0,51 | −13,06 | 0,0614 | −0,0062 | |||
| APOG / Apogee Enterprises, Inc. | 0,01 | 36,37 | 0,50 | −11,50 | 0,0607 | −0,0050 | |||
| KMT / Kennametal Inc. | 0,02 | 36,38 | 0,49 | 21,13 | 0,0598 | 0,0125 | |||
| PDLB / Ponce Financial Group, Inc. | 0,04 | 0,00 | 0,49 | −2,58 | 0,0595 | 0,0011 | |||
| HFWA / Heritage Financial Corporation | 0,02 | 36,39 | 0,48 | 35,49 | 0,0584 | 0,0171 | |||
| FIBK / First Interstate BancSystem, Inc. | 0,02 | 36,38 | 0,48 | 20,25 | 0,0577 | 0,0118 | |||
| DIS / The Walt Disney Company | 0,00 | −8,61 | 0,47 | −19,04 | 0,0573 | −0,0104 | |||
| REPX / Riley Exploration Permian, Inc. | 0,02 | 36,38 | 0,47 | 24,87 | 0,0572 | 0,0133 | |||
| VLY / Valley National Bancorp | 0,05 | 18,52 | 0,47 | 16,34 | 0,0570 | 0,0101 | |||
| IGSB / iShares Trust - iShares 1-5 Year Investment Grade Corporate Bond ETF | 0,01 | −5,33 | 0,47 | −4,12 | 0,0564 | 0,0001 | |||
| IJR / iShares Trust - iShares Core S&P Small-Cap ETF | 0,00 | 4,73 | 0,46 | −4,94 | 0,0561 | −0,0004 | |||
| ASGI / Abrdn Global Infrastructure Income Fund | 0,03 | 0,00 | 0,46 | 5,02 | 0,0558 | 0,0049 | |||
| CTLP / Cantaloupe, Inc. | 0,06 | 187,08 | 0,46 | 138,54 | 0,0555 | 0,0332 | |||
| SXI / Standex International Corporation | 0,00 | −6,62 | 0,46 | −19,47 | 0,0552 | −0,0104 | |||
| IXN / iShares Trust - iShares Global Tech ETF | 0,01 | 0,00 | 0,45 | −10,63 | 0,0551 | −0,0039 | |||
| BXC / BlueLinx Holdings Inc. | 0,01 | −1,65 | 0,45 | −27,83 | 0,0541 | −0,0176 | |||
| AIN / Albany International Corp. | 0,01 | 36,38 | 0,44 | 17,79 | 0,0530 | 0,0099 | |||
| MSFT / Microsoft Corporation | 0,00 | −17,77 | 0,43 | −26,81 | 0,0527 | −0,0162 | |||
| ETV / Eaton Vance Tax-Managed Buy-Write Opportunities Fund | 0,03 | 0,00 | 0,43 | −8,26 | 0,0526 | −0,0023 | |||
| SONO / Sonos, Inc. | 0,04 | 36,38 | 0,43 | −3,17 | 0,0519 | 0,0006 | |||
| EGP / EastGroup Properties, Inc. | 0,00 | 4,66 | 0,43 | 14,78 | 0,0518 | 0,0086 | |||
| EPAC / Enerpac Tool Group Corp. | 0,01 | 36,38 | 0,42 | 48,94 | 0,0513 | 0,0183 | |||
| EEM / iShares, Inc. - iShares MSCI Emerging Markets ETF | 0,01 | 0,00 | 0,42 | 4,50 | 0,0507 | 0,0043 | |||
| HMN / Horace Mann Educators Corporation | 0,01 | 36,38 | 0,42 | 48,57 | 0,0505 | 0,0180 | |||
| ENOV / Enovis Corporation | 0,01 | −8,98 | 0,41 | −20,84 | 0,0503 | −0,0104 | |||
| ABBV / AbbVie Inc. | 0,00 | 0,00 | 0,41 | 17,87 | 0,0497 | 0,0093 | |||
| WEX / WEX Inc. | 0,00 | −24,26 | 0,41 | −32,27 | 0,0492 | −0,0202 | |||
| FARO / FARO Technologies, Inc. | 0,01 | −25,58 | 0,40 | −19,88 | 0,0489 | −0,0095 | |||
| INDB / Independent Bank Corp. | 0,01 | 0,00 | 0,40 | −2,45 | 0,0484 | 0,0009 | |||
| WASH / Washington Trust Bancorp, Inc. | 0,01 | 36,38 | 0,40 | 34,46 | 0,0483 | 0,0139 | |||
| GFF / Griffon Corporation | 0,01 | 0,00 | 0,39 | 0,51 | 0,0477 | 0,0022 | |||
| GBX / The Greenbrier Companies, Inc. | 0,01 | 36,37 | 0,39 | 14,41 | 0,0472 | 0,0078 | |||
| BLDR / Builders FirstSource, Inc. | 0,00 | 0,00 | 0,39 | −12,64 | 0,0470 | −0,0045 | |||
| UCTT / Ultra Clean Holdings, Inc. | 0,02 | 62,53 | 0,38 | −3,32 | 0,0460 | 0,0005 | |||
| ATKR / Atkore Inc. | 0,01 | −0,80 | 0,37 | −28,82 | 0,0453 | −0,0155 | |||
| GBCI / Glacier Bancorp, Inc. | 0,01 | 36,37 | 0,36 | 20,13 | 0,0442 | 0,0090 | |||
| TV / Grupo Televisa, S.A.B. - Depositary Receipt (Common Stock) | 0,20 | 36,39 | 0,35 | 41,80 | 0,0421 | 0,0137 | |||
| RXO / RXO, Inc. | 0,02 | −5,87 | 0,34 | −24,67 | 0,0415 | −0,0112 | |||
| CBOE / Cboe Global Markets, Inc. | 0,00 | 0,34 | 0,0412 | 0,0412 | |||||
| WTTR / Select Water Solutions, Inc. | 0,03 | 141,17 | 0,34 | 91,53 | 0,0411 | 0,0205 | |||
| ZD / Ziff Davis, Inc. | 0,01 | −16,53 | 0,34 | −42,37 | 0,0408 | −0,0269 | |||
| MO / Altria Group, Inc. | 0,01 | −8,50 | 0,34 | 5,00 | 0,0408 | 0,0036 | |||
| XRAY / DENTSPLY SIRONA Inc. | 0,02 | 0,34 | 0,0407 | 0,0407 | |||||
| AMGN / Amgen Inc. | 0,00 | 0,00 | 0,33 | 19,29 | 0,0406 | 0,0081 | |||
| IR / Ingersoll Rand Inc. | 0,00 | −7,31 | 0,32 | −18,11 | 0,0390 | −0,0065 | |||
| VVV / Valvoline Inc. | 0,01 | −3,37 | 0,32 | −7,02 | 0,0386 | −0,0011 | |||
| ETN / Eaton Corporation plc | 0,00 | −23,04 | 0,32 | −37,10 | 0,0385 | −0,0200 | |||
| WY / Weyerhaeuser Company | 0,01 | 6,30 | 0,31 | 10,60 | 0,0380 | 0,0051 | |||
| PFE / Pfizer Inc. | 0,01 | −7,43 | 0,31 | −11,58 | 0,0380 | −0,0031 | |||
| CODI / Compass Diversified | 0,02 | 0,00 | 0,31 | −19,32 | 0,0376 | −0,0069 | |||
| LH / Labcorp Holdings Inc. | 0,00 | −2,94 | 0,31 | −1,29 | 0,0372 | 0,0011 | |||
| SPYG / SPDR Series Trust - SPDR Portfolio S&P 500 Growth ETF | 0,00 | 0,00 | 0,30 | −8,51 | 0,0365 | −0,0017 | |||
| ZIMV / ZimVie Inc. | 0,03 | −5,54 | 0,30 | −27,03 | 0,0361 | −0,0112 | |||
| SPR / Spirit AeroSystems Holdings, Inc. | 0,01 | −1,12 | 0,29 | 0,00 | 0,0357 | 0,0015 | |||
| GOOG / Alphabet Inc. | 0,00 | 0,00 | 0,29 | −18,31 | 0,0352 | −0,0060 | |||
| DXPE / DXP Enterprises, Inc. | 0,00 | −10,53 | 0,28 | −10,86 | 0,0339 | −0,0025 | |||
| UL / Unilever PLC - Depositary Receipt (Common Stock) | 0,00 | 0,00 | 0,27 | 4,71 | 0,0325 | 0,0029 | |||
| VGK / Vanguard International Equity Index Funds - Vanguard FTSE Europe ETF | 0,00 | 0,00 | 0,27 | 10,37 | 0,0323 | 0,0044 | |||
| IDU / iShares Trust - iShares U.S. Utilities ETF | 0,00 | 0,00 | 0,26 | 5,67 | 0,0317 | 0,0029 | |||
| NABL / N-able, Inc. | 0,04 | 100,00 | 0,26 | 52,07 | 0,0312 | 0,0115 | |||
| LMT / Lockheed Martin Corporation | 0,00 | 0,00 | 0,26 | −7,89 | 0,0312 | −0,0013 | |||
| ETW / Eaton Vance Tax-Managed Global Buy-Write Opportunities Fund | 0,03 | 0,00 | 0,26 | −1,92 | 0,0310 | 0,0007 | |||
| AMTB / Amerant Bancorp Inc. | 0,01 | −3,31 | 0,25 | −10,99 | 0,0305 | −0,0023 | |||
| C / Citigroup Inc. | 0,00 | 0,00 | 0,23 | 0,86 | 0,0284 | 0,0014 | |||
| VYX / NCR Voyix Corporation | 0,02 | −10,42 | 0,23 | −36,86 | 0,0283 | −0,0146 | |||
| HP / Helmerich & Payne, Inc. | 0,01 | 0,22 | 0,0269 | 0,0269 | |||||
| VSTS / Vestis Corporation | 0,02 | −10,57 | 0,22 | −41,99 | 0,0269 | −0,0174 | |||
| BMY / Bristol-Myers Squibb Company | 0,00 | 0,00 | 0,22 | 7,96 | 0,0264 | 0,0030 | |||
| SD / SandRidge Energy, Inc. | 0,02 | 0,21 | 0,0257 | 0,0257 | |||||
| DIA / SPDR Dow Jones Industrial Average ETF Trust | 0,00 | −44,44 | 0,21 | −45,29 | 0,0255 | −0,0190 | |||
| VOO / Vanguard Index Funds - Vanguard S&P 500 ETF | 0,00 | 0,00 | 0,21 | −4,59 | 0,0252 | −0,0001 | |||
| IJT / iShares Trust - iShares S&P Small-Cap 600 Growth ETF | 0,00 | 0,00 | 0,21 | −8,07 | 0,0249 | −0,0010 | |||
| ALLE / Allegion plc | 0,00 | −13,09 | 0,20 | −13,36 | 0,0245 | −0,0025 | |||
| BTT / Blackrock Municipal 2030 Target Term Trust | 0,01 | 0,20 | 0,0243 | 0,0243 | |||||
| PPIH / Perma-Pipe International Holdings, Inc. | 0,01 | 0,00 | 0,15 | −16,85 | 0,0186 | −0,0028 | |||
| SHLS / Shoals Technologies Group, Inc. | 0,04 | 36,39 | 0,15 | −18,44 | 0,0178 | −0,0030 | |||
| WSBF / Waterstone Financial, Inc. | 0,01 | 0,00 | 0,13 | 0,00 | 0,0163 | 0,0007 | |||
| BCOW / 1895 Bancorp of Wisconsin, Inc. | 0,00 | −100,00 | 0,00 | −100,00 | −0,0139 | ||||
| LAND / Gladstone Land Corporation | 0,00 | −100,00 | 0,00 | 0,0000 | |||||
| PBFS / Pioneer Bancorp, Inc. | 0,00 | −100,00 | 0,00 | −100,00 | −0,0201 | ||||
| FTAI / FTAI Aviation Ltd. | 0,00 | −100,00 | 0,00 | 0,0000 | |||||
| FSK / FS KKR Capital Corp. | 0,00 | −100,00 | 0,00 | 0,0000 | |||||
| SUM / Summit Materials, Inc. | 0,00 | −100,00 | 0,00 | 0,0000 | |||||
| GWW / W.W. Grainger, Inc. | 0,00 | −100,00 | 0,00 | 0,0000 | |||||
| HES / Hess Corporation | 0,00 | −100,00 | 0,00 | 0,0000 | |||||
| HUN / Huntsman Corporation | 0,00 | −100,00 | 0,00 | 0,0000 | |||||
| GRAL / GRAIL, Inc. | 0,00 | −100,00 | 0,00 | 0,0000 | |||||
| EXR / Extra Space Storage Inc. | 0,00 | −100,00 | 0,00 | 0,0000 | |||||
| CAG / Conagra Brands, Inc. | 0,00 | −100,00 | 0,00 | 0,0000 | |||||
| VSEC / VSE Corporation | 0,00 | −100,00 | 0,00 | 0,0000 | |||||
| UFPI / UFP Industries, Inc. | 0,00 | −100,00 | 0,00 | 0,0000 | |||||
| MCY / Mercury General Corporation | 0,00 | −100,00 | 0,00 | 0,0000 | |||||
| FORM / FormFactor, Inc. | 0,00 | −100,00 | 0,00 | 0,0000 | |||||
| PDCO / Patterson Companies, Inc. | 0,00 | −100,00 | 0,00 | 0,0000 | |||||
| DGICA / Donegal Group Inc. | 0,00 | −100,00 | 0,00 | 0,0000 |