Grundläggande statistik
| Institutionella ägare | 325 total, 325 long only, 0 short only, 0 long/short - change of 5,50% MRQ |
| Genomsnittlig portföljallokering | 0.6153 % - change of −0,24% MRQ |
| Institutionella aktier (lång) | 146 630 593 (ex 13D/G) - change of 13,18MM shares 9,87% MRQ |
| Institutionellt värde (lång) | $ 4 275 688 USD ($1000) |
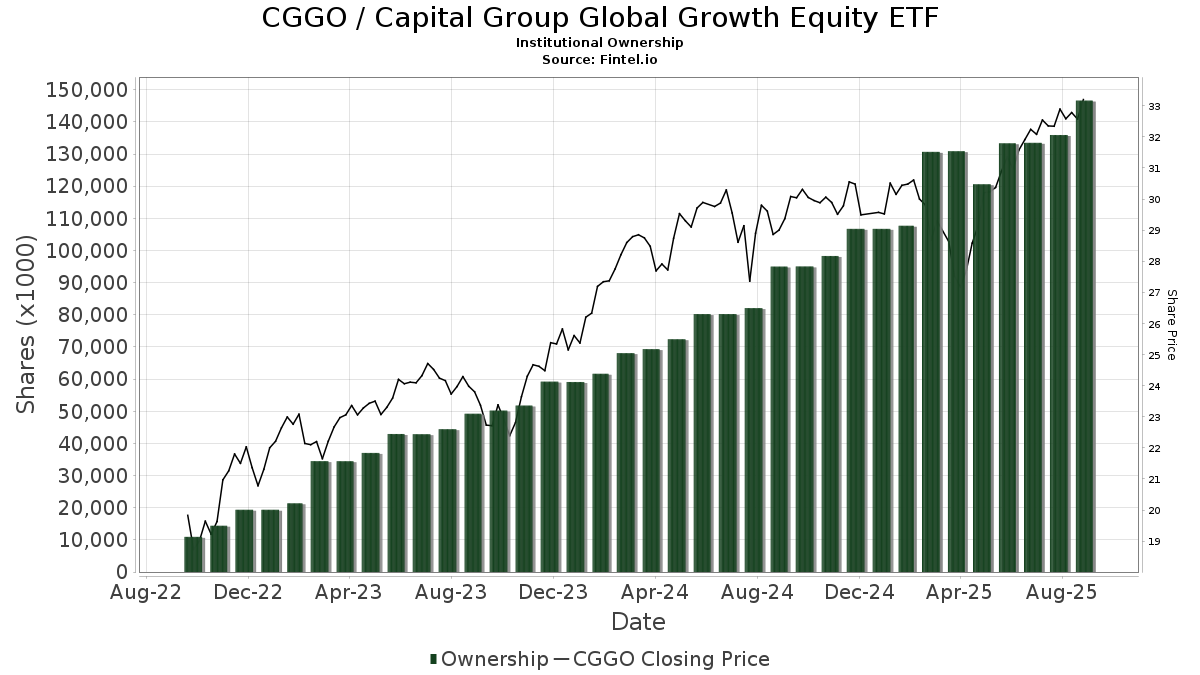
Institutionellt ägande och aktieägare
Capital Group Global Growth Equity ETF (US:CGGO) har 325 Institutionella ägare och aktieägare som har lämnat in 13D/G- eller 13F-formulär till Securities Exchange Commission (SEC). Dessa institut innehar totalt 146,630,593 aktier. Största aktieägare inkluderar Capital Group Private Client Services, Inc., Raymond James Financial Inc, LPL Financial LLC, Northwestern Mutual Wealth Management Co, Morgan Stanley, Envestnet Asset Management Inc, Cetera Investment Advisers, Commonwealth Equity Services, Llc, Advisor Group Holdings, Inc., and UBS Group AG .
Capital Group Global Growth Equity ETF (ARCA:CGGO) Institutionell ägarstruktur visar institutioners och fonders nuvarande positioner i företaget, samt de senaste förändringarna i positionernas storlek. Större aktieägare kan vara enskilda investerare, fonder, hedgefonder eller institutioner. Bilaga 13D visar att investeraren äger (eller ägde) mer än 5% av företaget och avser (eller avsåg) att aktivt eftersträva en förändring av affärsstrategin. Schedule 13G indikerar en passiv investering på över 5%.
The share price as of September 19, 2025 is 33,99 / share. Previously, on September 20, 2024, the share price was 29,85 / share. This represents an increase of 13,87% over that period.
Fondsentimentets poäng
Fondsentimentet poängen(fka Ägarackumulation-poäng) visar vilka aktier som är mest köpta av fonder. Det är resultatet av en sofistikerad kvantitativ flerfaktormodell som identifierar företag med de högsta nivåerna av institutionell ackumulering. Poängsättningsmodellen använder en kombination av den totala ökningen av redovisade ägare, förändringarna i portföljallokeringarna för dessa ägare och andra mått. Siffran sträcker sig från 0 till 100, där högre siffror indikerar en högre nivå av ackumulering i förhållande till sina konkurrenter, och 50 är genomsnittet.
Uppdateringsfrekvens: Dagligen
Se Ownership Explorer, som innehåller en lista över de högst rankade företagen.
AI+ Ask Fintel’s AI assistant about Capital Group Global Growth Equity ETF.
Thinking of good questions…
Institutionell sälj/köp-kvot
Förutom att rapportera vanliga eget kapital- och skuldemissioner måste institutioner med mer än 100MM tillgångar under förvaltning också avslöja sina innehav av sälj- och köpoptioner. Eftersom säljoptioner i allmänhet indikerar ett negativt sentiment och köpoptioner indikerar ett positivt sentiment, kan vi få en uppfattning om det övergripande institutionella sentimentet genom att plotta förhållandet mellan säljoptioner och köpoptioner. Diagrammet till höger visar det historiska förhållandet mellan sälj- och köpoptioner för detta instrument.
Genom att använda sälj/köp-kvoten som en indikator på aktieägarnas sentiment undviker man en av de största bristerna med att använda det totala institutionella ägandet, nämligen att en betydande del av de förvaltade tillgångarna investeras passivt för att följa index. Passivt förvaltade fonder köper vanligtvis inte optioner, så indikatorn för sälj/köp-kvoten ger en bättre bild av stämningen i aktivt förvaltade fonder.
13F- och NPORT-arkiveringar
Detaljer om 13F-arkiveringar är gratis. Detaljer om NP-arkiveringar kräver ett premiummedlemskap. Gröna rader indikerar nya positioner. Röda rader indikerar stängda positioner. Klicka på länk symbolen för att se hela transaktionshistoriken.
Uppgradera
för att låsa upp premiumdata och exportera till Excel ![]() .
.
| Fil Datum | Källa | Investerare | Typ | Genomsnittligt pris (beräknat) |
Aktier | Δ Aktier (%) |
Rapporterat värde (1000 USD) |
Δ Värde (%) |
Portföljallokering (%) |
|
|---|---|---|---|---|---|---|---|---|---|---|
| 2025-08-12 | 13F | Rather & Kittrell, Inc. | 12 013 | 0,00 | 384 | 12,94 | ||||
| 2025-08-13 | 13F | Quadrature Capital Ltd | 0 | −100,00 | 0 | |||||
| 2025-08-15 | 13F | First Heartland Consultants, Inc. | 30 193 | 7,14 | 965 | 20,93 | ||||
| 2025-07-29 | 13F | Stratos Wealth Advisors, LLC | 14 272 | −15,57 | 456 | −4,60 | ||||
| 2025-05-15 | 13F | Gts Securities Llc | 0 | −100,00 | 0 | |||||
| 2025-07-25 | 13F | McNamara Financial Services, Inc. | 11 738 | −44,77 | 375 | −37,71 | ||||
| 2025-07-17 | 13F | LVW Advisors, LLC | 946 565 | 23,13 | 30 262 | 38,96 | ||||
| 2025-08-12 | 13F | Financial Advocates Investment Management | 43 471 | −1,87 | 1 390 | 10,68 | ||||
| 2025-08-14 | 13F | Catalyst Financial Partners Llc | 42 096 | 75,11 | 1 346 | 97,50 | ||||
| 2025-07-22 | 13F | Merit Financial Group, LLC | 124 033 | 12,09 | 3 965 | 26,52 | ||||
| 2025-07-16 | 13F | Novem Group | 196 325 | 6 277 | ||||||
| 2025-08-13 | 13F | Certior Financial Group, Llc | 17 892 | 0,00 | 572 | 13,04 | ||||
| 2025-08-14 | 13F | TCG Advisory Services, LLC | 12 359 | 1,27 | 395 | 14,49 | ||||
| 2025-08-12 | 13F | Reliant Wealth Planning | 672 450 | 5,46 | 21 498 | 19,02 | ||||
| 2025-07-22 | 13F | Belpointe Asset Management LLC | 32 612 | 0,00 | 1 043 | 12,89 | ||||
| 2025-08-14 | 13F | UBS Group AG | 3 735 352 | −13,03 | 119 419 | −1,85 | ||||
| 2025-08-08 | 13F | Larson Financial Group LLC | 3 250 | 0,00 | 104 | 11,96 | ||||
| 2025-07-14 | 13F | Sweeney & Michel, Llc | 43 419 | 2,28 | 1 392 | 29,61 | ||||
| 2025-08-06 | NP | LINCOLN VARIABLE INSURANCE PRODUCTS TRUST - LVIP American Funds Vanguard Active Passive Growth Fund Standard Class | 1 739 | 56 | ||||||
| 2025-07-24 | 13F | Ridgeline Wealth Planning, LLC | 451 727 | 6,55 | 14 442 | 20,24 | ||||
| 2025-07-29 | 13F | Signature Estate & Investment Advisors Llc | 223 648 | 3,97 | 7 150 | 17,35 | ||||
| 2025-08-11 | 13F | Greykasell Wealth Strategies, Inc. | 102 186 | 19,44 | 3 267 | 34,79 | ||||
| 2025-07-29 | 13F | Balboa Wealth Partners | 10 337 | 330 | ||||||
| 2025-07-29 | 13F | Burford Brothers, Inc. | 150 584 | −0,48 | 4 814 | 12,32 | ||||
| 2025-08-11 | 13F | Private Advisor Group, LLC | 1 057 514 | −11,32 | 33 809 | 0,07 | ||||
| 2025-05-14 | 13F | Huntington National Bank | 3 | −84,21 | ||||||
| 2025-08-13 | 13F | Vertex Planning Partners, LLC | 6 443 | 206 | ||||||
| 2025-08-07 | 13F | Cvfg Llc | 92 918 | 9,93 | 2 971 | 24,06 | ||||
| 2025-08-14 | 13F | Peapack Gladstone Financial Corp | 204 931 | 0,15 | 7 | 20,00 | ||||
| 2025-07-22 | 13F | Woodmont Investment Counsel Llc | 38 648 | 12,31 | 1 236 | 26,80 | ||||
| 2025-07-07 | 13F | Thurston, Springer, Miller, Herd & Titak, Inc. | 6 845 | 135,95 | 219 | 165,85 | ||||
| 2025-07-22 | 13F | Gutierrez Wealth Advisory, LLC | 207 434 | −0,37 | 6 632 | 12,43 | ||||
| 2025-07-28 | 13F | Sagespring Wealth Partners, Llc | 173 768 | 10,65 | 3 315 | 34,12 | ||||
| 2025-08-14 | 13F | Wells Fargo & Company/mn | 3 710 825 | −1,71 | 118 635 | 10,92 | ||||
| 2025-08-06 | 13F | Mascagni Wealth Management, Inc. | 36 646 | 22,87 | 1 172 | 38,74 | ||||
| 2025-08-13 | 13F | Beacon Pointe Advisors, LLC | 168 374 | 5 383 | ||||||
| 2025-08-12 | 13F | Jpmorgan Chase & Co | 211 635 | 1 057,49 | 6 766 | 1 205,98 | ||||
| 2025-08-11 | 13F | Principal Securities, Inc. | 213 252 | 39,88 | 6 818 | 53,05 | ||||
| 2025-08-12 | 13F | Lodestone Wealth Management LLC | 22 732 | 11,53 | 727 | 25,82 | ||||
| 2025-07-29 | 13F | Koshinski Asset Management, Inc. | 168 991 | 9,30 | 5 403 | 23,33 | ||||
| 2025-07-10 | 13F | Financial Management Network Inc | 183 759 | 2,10 | 5 893 | 27,86 | ||||
| 2025-08-11 | 13F | Perennial Investment Advisors, LLC | 110 014 | 59,56 | 3 517 | 80,08 | ||||
| 2025-08-12 | 13F | Summit Global Investments | 7 914 | 0 | ||||||
| 2025-08-13 | 13F | Capital Group Private Client Services, Inc. | 18 220 559 | 2,99 | 582 511 | 16,23 | ||||
| 2025-05-13 | 13F | Francis Financial, Inc. | 0 | −100,00 | 0 | |||||
| 2025-07-17 | 13F | KWB Wealth | 176 010 | 44,82 | 4 986 | 40,41 | ||||
| 2025-08-14 | 13F | Wiley Bros.-aintree Capital, Llc | 1 285 162 | 520,33 | 41 094 | 612,18 | ||||
| 2025-07-22 | 13F | DAVENPORT & Co LLC | 113 017 | 6,12 | 3 613 | 19,75 | ||||
| 2025-08-14 | 13F | GWM Advisors LLC | 1 366 646 | 49,78 | 43 692 | 69,02 | ||||
| 2025-07-31 | 13F | West Michigan Advisors, Llc | 230 900 | 2,79 | 7 382 | 16,01 | ||||
| 2025-08-14 | 13F | Summit Trail Advisors, Llc | 9 190 | 294 | ||||||
| 2025-07-24 | 13F | Financial Security Advisor, Inc. | 16 791 | 10,01 | 542 | 25,23 | ||||
| 2025-07-29 | 13F | International Assets Investment Management, Llc | 14 509 | −9,53 | 464 | 1,98 | ||||
| 2025-08-14 | 13F | IHT Wealth Management, LLC | 7 100 | 227 | ||||||
| 2025-07-25 | 13F | Atria Wealth Solutions, Inc. | 68 714 | −58,80 | 2 216 | −53,09 | ||||
| 2025-05-13 | 13F | BlackDiamond Wealth Management Inc. | 0 | −100,00 | 0 | |||||
| 2025-08-11 | 13F | Forge Financial Services LLC | 774 169 | 4,84 | 24 774 | 18,42 | ||||
| 2025-08-14 | 13F | Susquehanna International Group, Llp | 0 | −100,00 | 0 | |||||
| 2025-07-10 | 13F | Kmg Fiduciary Partners, Llc | 19 743 | −22,93 | 631 | −12,97 | ||||
| 2025-08-04 | 13F | Bay Colony Advisory Group, Inc d/b/a Bay Colony Advisors | 7 593 | 0,00 | 243 | 12,56 | ||||
| 2025-08-12 | 13F | AlphaCore Capital LLC | 120 222 | −0,73 | 3 880 | 13,09 | ||||
| 2025-08-14 | 13F | Clg Llc | 149 568 | 96,83 | 4 782 | 122,17 | ||||
| 2025-08-14 | 13F | Tudor Financial Inc. | 12 399 | 17,93 | 396 | 33,33 | ||||
| 2025-08-15 | 13F | High Falls Advisors, Inc | 8 429 | 0,00 | 269 | 13,03 | ||||
| 2025-07-15 | 13F | Mather Group, Llc. | 0 | −100,00 | 0 | |||||
| 2025-08-08 | 13F | Kingsview Wealth Management, LLC | 23 057 | 18,51 | 737 | 33,76 | ||||
| 2025-08-14 | 13F | Royal Bank Of Canada | 2 741 590 | 4,22 | 87 649 | 17,61 | ||||
| 2025-07-21 | 13F | Investment Planning Advisors, Inc. | 18 549 | −94,12 | 593 | −93,37 | ||||
| 2025-08-11 | 13F | Synergy Investment Management, LLC | 0 | −100,00 | 0 | |||||
| 2025-04-14 | 13F | LexAurum Advisors, LLC | 0 | −100,00 | 0 | |||||
| 2025-08-18 | 13F/A | Kestra Investment Management, LLC | 254 661 | 28,48 | 8 142 | 44,99 | ||||
| 2025-08-14 | 13F | Goldman Sachs Group Inc | 46 256 | −41,92 | 1 479 | −34,49 | ||||
| 2025-06-04 | 13F | Legacy Capital Wealth Management, Llc | 142 965 | 4 177 | ||||||
| 2025-08-13 | 13F | Baird Financial Group, Inc. | 1 395 393 | 2,79 | 44 611 | 15,99 | ||||
| 2025-07-16 | 13F | St Germain D J Co Inc | 903 279 | 0,27 | 28 878 | 13,15 | ||||
| 2025-08-14 | 13F | Benjamin Edwards Inc | 542 214 | 11,96 | 17 335 | 26,35 | ||||
| 2025-07-11 | 13F | Weatherly Asset Management L. P. | 33 333 | 0,00 | 1 067 | 13,03 | ||||
| 2025-07-31 | 13F | 180 Wealth Advisors, Llc | 20 572 | −13,79 | 658 | −2,81 | ||||
| 2025-07-21 | 13F | Patriot Financial Group Insurance Agency, LLC | 24 865 | 2,96 | 795 | 16,08 | ||||
| 2025-08-14 | 13F | Sunbelt Securities, Inc. | 740 | 0,00 | 22 | 5,00 | ||||
| 2025-08-04 | 13F | Arkadios Wealth Advisors | 35 746 | 8,12 | 1 143 | 22,01 | ||||
| 2025-08-11 | 13F | Western Wealth Management, LLC | 11 544 | −1,02 | 369 | 11,82 | ||||
| 2025-08-04 | 13F | Saxony Capital Management, LLC | 27 179 | 0,15 | 869 | 13,02 | ||||
| 2025-07-08 | 13F | Advance Capital Management, Inc. | 29 774 | −1,90 | 952 | 10,71 | ||||
| 2025-08-13 | 13F | Continuum Advisory, LLC | 0 | −100,00 | 0 | |||||
| 2025-07-24 | 13F | IFP Advisors, Inc | 5 293 | 123,62 | 169 | 152,24 | ||||
| 2025-08-12 | 13F | Steward Partners Investment Advisory, Llc | 297 309 | 12,02 | 9 505 | 26,40 | ||||
| 2025-07-29 | 13F | Latitude Advisors, LLC | 23 505 | 19,35 | 751 | 34,83 | ||||
| 2025-05-14 | 13F | Oarsman Capital, Inc. | 0 | −100,00 | 0 | |||||
| 2025-07-30 | 13F | Strategic Blueprint, LLC | 500 131 | 100,87 | 15 989 | 126,70 | ||||
| 2025-08-12 | 13F | Change Path, LLC | 17 603 | 563 | ||||||
| 2025-08-15 | 13F | 44 Wealth Management Llc | 42 253 | 9,09 | 1 351 | 23,06 | ||||
| 2025-08-13 | 13F | Summit Wealth Group Llc / Co | 19 006 | 612 | ||||||
| 2025-08-14 | 13F | Raymond James Financial Inc | 12 059 891 | 0,60 | 385 555 | 13,53 | ||||
| 2025-08-08 | 13F | Security Financial Services, INC. | 9 748 | 312 | ||||||
| 2025-07-28 | 13F | Arlington Financial Advisors, LLC | 1 271 734 | 6,53 | 40 657 | 20,21 | ||||
| 2025-07-10 | 13F | Wealth Enhancement Advisory Services, Llc | 1 872 601 | −8,44 | 60 054 | 3,64 | ||||
| 2025-07-14 | 13F | AdvisorNet Financial, Inc | 539 | −47,57 | 17 | −41,38 | ||||
| 2025-07-24 | 13F | MSH Capital Advisors LLC | 15 386 | −10,27 | 492 | 1,24 | ||||
| 2025-07-30 | 13F | Financial Perspectives, Inc | 56 498 | 10,00 | 1 806 | 24,12 | ||||
| 2025-08-14 | 13F | CIBC World Markets Inc. | 7 374 | 236 | ||||||
| 2025-07-16 | 13F | Embree Financial Group | 14 620 | 13,10 | 467 | 27,60 | ||||
| 2025-08-12 | 13F | J.w. Cole Advisors, Inc. | 82 374 | 10,64 | 2 634 | 24,85 | ||||
| 2025-07-15 | 13F | Colonial River Wealth Management, LLC | 6 544 | −31,19 | 211 | −21,93 | ||||
| 2025-08-14 | 13F | Mariner, LLC | 240 542 | 3,75 | 7 690 | 17,08 | ||||
| 2025-07-11 | 13F | Farther Finance Advisors, LLC | 25 412 | 812 | ||||||
| 2025-07-21 | 13F | Financial Council Asset Management Inc | 1 386 850 | 4,28 | 44 338 | 17,68 | ||||
| 2025-08-04 | 13F | Spire Wealth Management | 0 | −100,00 | 0 | |||||
| 2025-08-08 | 13F | Cetera Investment Advisers | 5 855 934 | 81,92 | 187 214 | 105,29 | ||||
| 2025-07-09 | 13F | Christopher J. Hasenberg, Inc | 264 | 8 | ||||||
| 2025-07-23 | 13F | Richardson Capital Management LLC | 188 | 25,33 | 6 | 50,00 | ||||
| 2025-08-25 | 13F | Silverlake Wealth Management Llc | 69 164 | 0,85 | 2 211 | 13,85 | ||||
| 2025-08-12 | 13F | Archer Investment Corp | 6 | 0,00 | 0 | |||||
| 2025-07-11 | 13F | Lincoln Capital LLC | 20 786 | 4,11 | 665 | 21,83 | ||||
| 2025-08-07 | 13F | Allworth Financial LP | 1 373 | −36,79 | 44 | −29,51 | ||||
| 2025-07-17 | 13F | Janney Montgomery Scott LLC | 1 171 450 | 26,43 | 37 | 42,31 | ||||
| 2025-07-25 | 13F | Bill Few Associates, Inc. | 90 618 | 27,72 | 2 897 | 44,20 | ||||
| 2025-07-21 | 13F | Ameritas Advisory Services, LLC | 128 577 | −24,59 | 4 111 | −15,85 | ||||
| 2025-08-14 | 13F | Sei Investments Co | 1 023 234 | 29,28 | 32 713 | 45,89 | ||||
| 2025-07-17 | 13F | Oakworth Capital, Inc. | 0 | −100,00 | 0 | |||||
| 2025-04-25 | 13F | Smallwood Wealth Investment Management, LLC | 111 941 | 4,11 | 3 171 | 0,96 | ||||
| 2025-08-12 | 13F | Calton & Associates, Inc. | 41 661 | −0,68 | 1 332 | 12,04 | ||||
| 2025-08-29 | 13F | Centaurus Financial, Inc. | 0 | −100,00 | 0 | |||||
| 2025-07-22 | 13F | Berger Financial Group, Inc | 7 654 | 4,82 | 245 | 18,45 | ||||
| 2025-07-23 | 13F | Indiana Trust & Investment Management CO | 605 | 0,00 | 19 | 11,76 | ||||
| 2025-07-30 | 13F | Smith Thornton Advisors LLC | 123 809 | −1,53 | 3 958 | 11,12 | ||||
| 2025-08-04 | 13F | Creative Financial Designs Inc /adv | 2 638 | 85,64 | 84 | 110,00 | ||||
| 2025-08-06 | 13F | Prospera Financial Services Inc | 615 571 | 5,24 | 19 686 | 18,76 | ||||
| 2025-08-14 | 13F | Old Mission Capital Llc | 70 712 | 637,89 | 2 261 | 733,95 | ||||
| 2025-04-21 | 13F | United Advisor Group, LLC | 0 | −100,00 | 0 | |||||
| 2025-07-30 | 13F | Principle Wealth Partners Llc | 0 | −100,00 | 0 | |||||
| 2025-07-22 | 13F | Brown Miller Wealth Management, LLC | 23 603 | 0,00 | 755 | 12,87 | ||||
| 2025-07-14 | 13F | Ai Financial Services Llc | 72 217 | 3,88 | 2 309 | 17,22 | ||||
| 2025-07-17 | 13F | San Luis Wealth Advisors LLC | 0 | −100,00 | 0 | |||||
| 2025-08-13 | 13F | Capital Analysts, Inc. | 17 866 | 1,99 | 1 | |||||
| 2025-07-31 | 13F | Cambridge Investment Research Advisors, Inc. | 2 562 374 | 12,98 | 82 | 26,56 | ||||
| 2025-07-28 | 13F | Axxcess Wealth Management, Llc | 100 663 | −30,09 | 3 218 | −21,11 | ||||
| 2025-05-02 | 13F | Capital A Wealth Management, LLC | 609 | −9,24 | 17 | −10,53 | ||||
| 2025-07-28 | 13F | Eq Wealth Advisors, Llc | 85 540 | 14,60 | 2 735 | 29,33 | ||||
| 2025-07-17 | 13F | LifeGoal Wealth Advisors | 295 093 | −4,80 | 9 434 | 7,52 | ||||
| 2025-07-14 | 13F | Leonard Rickey Investment Advisors P.L.L.C. | 114 540 | −0,37 | 3 662 | 15,60 | ||||
| 2025-07-22 | 13F | Iron Horse Wealth Management, LLC | 67 | 2 | ||||||
| 2025-08-11 | 13F | Brown Brothers Harriman & Co | 79 321 | 0,00 | 2 536 | 12,82 | ||||
| 2025-08-13 | 13F | Aspire Growth Partners LLC | 8 012 | 0,00 | 256 | 9,87 | ||||
| 2025-08-15 | 13F | Equitable Holdings, Inc. | 161 918 | 419,68 | 5 177 | 486,85 | ||||
| 2025-07-14 | 13F | U.S. Capital Wealth Advisors, LLC | 230 223 | 6,22 | 7 360 | 19,87 | ||||
| 2025-08-13 | 13F | Cary Street Partners Financial Llc | 244 803 | −19,11 | 7 826 | −8,72 | ||||
| 2025-07-21 | 13F | Barrett & Company, Inc. | 8 209 | 0,00 | 262 | 12,93 | ||||
| 2025-07-23 | 13F | Trueblood Wealth Management, LLC | 74 664 | 10,23 | 2 387 | 24,45 | ||||
| 2025-08-06 | 13F | Vestmark Advisory Solutions, Inc. | 264 126 | 107,50 | 8 444 | 134,17 | ||||
| 2025-08-14 | 13F | Gerber Kawasaki Wealth & Investment Management | 232 156 | −1,02 | 7 422 | 11,71 | ||||
| 2025-08-12 | 13F | LPL Financial LLC | 11 152 596 | 23,43 | 356 548 | 39,29 | ||||
| 2025-08-14 | 13F | Integrated Wealth Concepts LLC | 263 118 | 34,72 | 8 412 | 52,02 | ||||
| 2025-08-13 | 13F | Smith, Moore & Co. | 162 617 | −0,22 | 5 199 | 12,58 | ||||
| 2025-07-25 | 13F | Concurrent Investment Advisors, LLC | 71 495 | 65,60 | 2 286 | 86,84 | ||||
| 2025-08-01 | 13F | Rossby Financial, LCC | 23 | 0,00 | 1 | |||||
| 2025-08-06 | 13F | ORBA Wealth Advisors, L.L.C. | 104 026 | −39,78 | 3 326 | −32,05 | ||||
| 2025-08-04 | 13F | HBK Sorce Advisory LLC | 7 239 | 0,00 | 231 | 12,68 | ||||
| 2025-07-10 | 13F | American Financial Advisors, LLC | 7 344 | −1,90 | 235 | 10,38 | ||||
| 2025-08-14 | 13F | Jane Street Group, Llc | 138 847 | −28,80 | 4 439 | −19,66 | ||||
| 2025-07-29 | 13F | Stephens Inc /ar/ | 208 055 | −61,33 | 6 652 | −56,37 | ||||
| 2025-08-12 | 13F | Proequities, Inc. | 0 | 0 | ||||||
| 2025-07-09 | 13F | Procyon Private Wealth Partners, LLC | 33 775 | 7,77 | 1 080 | 21,65 | ||||
| 2025-08-13 | 13F | Jones Financial Companies Lllp | 2 946 022 | 50,04 | 94 771 | 69,83 | ||||
| 2025-08-14 | 13F | Modern Wealth Management, LLC | 51 262 | 2,92 | 1 639 | 16,09 | ||||
| 2025-08-06 | 13F | Moors & Cabot, Inc. | 22 947 | 4,93 | 734 | 18,42 | ||||
| 2025-07-16 | 13F | ORG Partners LLC | 9 125 | 1 739,72 | 289 | 1 964,29 | ||||
| 2025-08-04 | 13F | IFG Advisory, LLC | 21 002 | 11,72 | 671 | 26,13 | ||||
| 2025-07-24 | 13F | Moseley Investment Management Inc | 72 356 | 7,41 | 2 313 | 21,23 | ||||
| 2025-08-04 | 13F | Northwest Financial Advisors | 60 277 | 19,02 | 1 927 | 34,38 | ||||
| 2025-07-11 | 13F | AA Financial Advisors, LLC | 294 686 | 2,47 | 9 421 | 15,64 | ||||
| 2025-08-01 | 13F | SYM FINANCIAL Corp | 14 002 | 72,84 | 448 | 95,20 | ||||
| 2025-08-13 | 13F | EverSource Wealth Advisors, LLC | 33 582 | −0,23 | 1 074 | 12,59 | ||||
| 2025-08-13 | 13F | Rsm Us Wealth Management Llc | 18 061 | −10,68 | 583 | 1,75 | ||||
| 2025-07-31 | 13F | Moloney Securities Asset Management, LLC | 35 866 | 21,62 | 1 147 | 37,25 | ||||
| 2025-07-30 | 13F | Cullen/frost Bankers, Inc. | 71 835 | 38,31 | 2 297 | 56,08 | ||||
| 2025-08-06 | 13F | Souders Financial Advisors | 330 947 | 6,02 | 10 580 | 19,64 | ||||
| 2025-07-17 | 13F | HB Wealth Management, LLC | 11 593 | 15,35 | 371 | 30,28 | ||||
| 2025-08-14 | 13F | Ruggaard & Associates LLC | 264 331 | 712,58 | 8 451 | 817,48 | ||||
| 2025-07-31 | 13F | FSM Wealth Advisors, LLC | 160 785 | 2,97 | 5 134 | 16,05 | ||||
| 2025-07-23 | 13F | Seamount Financial Group Inc | 31 146 | 42,78 | 996 | 61,26 | ||||
| 2025-05-15 | 13F | Advisory Services Network, LLC | 0 | −100,00 | 0 | |||||
| 2025-09-04 | 13F/A | Advisor Group Holdings, Inc. | 4 365 979 | 11,07 | 139 464 | 25,21 | ||||
| 2025-07-17 | 13F | Presper Financial Architects, LLC | 150 026 | 5 | ||||||
| 2025-07-17 | 13F | Venture Visionary Partners LLC | 17 890 | 130,10 | 572 | 159,55 | ||||
| 2025-07-31 | 13F | Aspen Capital Management, LLC | 9 974 | 0,00 | 319 | 12,77 | ||||
| 2025-08-06 | 13F | Walkner Condon Financial Advisors LLC | 18 880 | −30,02 | 604 | −21,07 | ||||
| 2025-07-24 | 13F | Us Bancorp \de\ | 4 117 | 172,29 | 132 | 211,90 | ||||
| 2025-07-23 | 13F | Prime Capital Investment Advisors, LLC | 8 177 | −7,89 | 261 | 3,98 | ||||
| 2025-08-11 | 13F | Advisor Resource Council | 0 | −100,00 | 0 | |||||
| 2025-08-12 | 13F | MAI Capital Management | 222 513 | 2,40 | 7 114 | 15,55 | ||||
| 2025-08-12 | 13F | Coldstream Capital Management Inc | 0 | −100,00 | 0 | |||||
| 2025-08-14 | 13F | Mercer Global Advisors Inc /adv | 11 805 | 377 | ||||||
| 2025-07-25 | 13F | Apollon Wealth Management, LLC | 210 325 | 181,04 | 6 724 | 217,17 | ||||
| 2025-08-08 | 13F | Thoroughbred Financial Services, Llc | 50 284 | −16,85 | 2 | 0,00 | ||||
| 2025-08-12 | 13F | O'shaughnessy Asset Management, Llc | 8 485 | −45,03 | 271 | −37,99 | ||||
| 2025-08-13 | 13F | M Holdings Securities, Inc. | 11 472 | 0 | ||||||
| 2025-07-16 | 13F | Signature Resources Capital Management, LLC | 19 898 | 16,34 | 636 | 31,40 | ||||
| 2025-08-14 | 13F | Colony Group, LLC | 884 445 | −8,34 | 28 276 | 3,44 | ||||
| 2025-08-07 | 13F | Vise Technologies, Inc. | 46 121 | −30,92 | 1 474 | −24,41 | ||||
| 2025-08-06 | 13F | Founders Financial Securities Llc | 89 515 | 11,03 | 2 862 | 24,83 | ||||
| 2025-08-14 | 13F | Main Street Financial Solutions, LLC | 280 030 | 4,86 | 8 953 | 18,33 | ||||
| 2025-07-09 | 13F | Massmutual Trust Co Fsb/adv | 2 | 0,00 | 0 | |||||
| 2025-08-15 | 13F | Kestra Advisory Services, LLC | 868 346 | 8,34 | 27 761 | 22,26 | ||||
| 2025-08-13 | 13F | Flow Traders U.s. Llc | 203 798 | 12,97 | 7 | 20,00 | ||||
| 2025-07-31 | 13F | Richards, Merrill & Peterson, Inc. | 0 | −100,00 | 0 | |||||
| 2025-08-06 | 13F | First Horizon Advisors, Inc. | 1 029 | −36,52 | 33 | −28,89 | ||||
| 2025-08-06 | 13F | Convergence Financial, LLC | 29 169 | −3,57 | 933 | 8,88 | ||||
| 2025-08-11 | 13F | TD Waterhouse Canada Inc. | 981 | 0,00 | 31 | 14,81 | ||||
| 2025-08-12 | 13F | BlackRock, Inc. | 50 279 | −2,09 | 1 607 | 10,52 | ||||
| 2025-08-14 | 13F | Citadel Advisors Llc | 231 127 | 7 389 | ||||||
| 2025-07-30 | 13F | Bleakley Financial Group, LLC | 457 085 | 2,51 | 14 613 | 15,69 | ||||
| 2025-07-02 | 13F | HBW Advisory Services LLC | 107 700 | 1,10 | 3 443 | 14,12 | ||||
| 2025-07-24 | 13F | Stonebridge Financial Group, LLC | 100 069 | 50,22 | 3 199 | 69,53 | ||||
| 2025-08-15 | 13F | Lantern Wealth Advisors, LLC | 6 906 | 221 | ||||||
| 2025-07-14 | 13F | GAMMA Investing LLC | 827 | 0,00 | 26 | 13,04 | ||||
| 2025-07-24 | 13F | NavPoint Financial, Inc. | 237 806 | −8,65 | 7 603 | 3,09 | ||||
| 2025-08-13 | 13F | RPg Family Wealth Advisory, LLC | 154 551 | −1,81 | 4 941 | 10,79 | ||||
| 2025-07-21 | 13F | Ameriflex Group, Inc. | 7 142 | 13,35 | 228 | 27,53 | ||||
| 2025-08-12 | 13F | Martin Worley Group | 8 300 | 0,00 | 265 | 12,77 | ||||
| 2025-07-29 | 13F | Salomon & Ludwin, LLC | 680 | 0,00 | 22 | 10,53 | ||||
| 2025-07-09 | 13F | Dynamic Advisor Solutions LLC | 41 586 | −13,28 | 1 329 | −2,14 | ||||
| 2025-08-15 | 13F | Captrust Financial Advisors | 915 875 | 15,17 | 29 281 | 29,97 | ||||
| 2025-07-21 | 13F | Capital Planning LLC | 14 632 | −6,52 | 472 | 6,55 | ||||
| 2025-07-10 | 13F | Professional Financial Advisors, LLC | 38 922 | 9,26 | 1 244 | 23,29 | ||||
| 2025-08-07 | 13F | Clarity Wealth Advisors, LLC | 285 432 | 2,70 | 9 125 | 15,89 | ||||
| 2025-07-16 | 13F | American National Bank | 630 | 20 | ||||||
| 2025-08-08 | 13F | Royal Harbor Partners, LLC | 282 410 | −45,41 | 9 029 | −38,40 | ||||
| 2025-07-11 | 13F | LongView Wealth Management | 71 473 | 6,76 | 2 285 | 20,46 | ||||
| 2025-07-17 | 13F | Johnson Bixby & Associates, LLC | 212 662 | −2,66 | 6 799 | 9,84 | ||||
| 2025-08-13 | 13F | Renaissance Technologies Llc | 80 200 | 2 564 | ||||||
| 2025-07-17 | 13F | Tempus Wealth Planning, LLC | 39 243 | 5,23 | 1 255 | 18,75 | ||||
| 2025-08-04 | 13F | WNY Asset Management, LLC | 636 693 | −4,06 | 20 355 | 8,27 | ||||
| 2025-08-13 | 13F | Cerity Partners LLC | 31 002 | 3,31 | 992 | 16,59 | ||||
| 2025-08-19 | 13F | Asset Dedication, LLC | 175 | 6 | ||||||
| 2025-07-23 | 13F | Valmark Advisers, Inc. | 552 929 | 8,94 | 17 677 | 22,94 | ||||
| 2025-07-22 | 13F | Beacon Financial Advisory LLC | 52 198 | 16,28 | 1 669 | 31,24 | ||||
| 2025-08-07 | 13F | Kestra Private Wealth Services, Llc | 33 295 | 23,00 | 1 064 | 38,90 | ||||
| 2025-08-07 | 13F | PFG Advisors | 76 413 | −11,72 | 2 443 | −0,41 | ||||
| 2025-07-28 | 13F | RFG Advisory, LLC | 32 299 | 264,71 | 1 033 | 312,80 | ||||
| 2025-08-13 | 13F | Strategic Family Wealth Counselors, L.L.C. | 43 945 | 1,28 | 1 405 | 14,24 | ||||
| 2025-08-13 | 13F | Russell Investments Group, Ltd. | 817 | −50,96 | 26 | −44,68 | ||||
| 2025-07-11 | 13F | Lantz Financial LLC | 9 404 | −11,72 | 301 | −0,33 | ||||
| 2025-07-22 | 13F | Silvia Mccoll Wealth Management, Llc | 112 991 | −4,08 | 3 612 | 8,24 | ||||
| 2025-07-28 | 13F | Frazier Financial Advisors, LLC | 121 164 | 41,77 | 3 874 | 59,98 | ||||
| 2025-08-05 | 13F | Carson Advisory Inc. | 226 189 | 0,03 | 7 231 | 12,90 | ||||
| 2025-07-28 | 13F | Harbour Investments, Inc. | 191 051 | −13,29 | 6 108 | −2,15 | ||||
| 2025-08-12 | 13F | Tradition Wealth Management, LLC | 77 881 | 0,00 | 2 490 | 12,83 | ||||
| 2025-08-14 | 13F | Harmony Asset Management Llc | 8 078 | 258 | ||||||
| 2025-08-11 | 13F | HighTower Advisors, LLC | 248 985 | 19,39 | 7 960 | 34,73 | ||||
| 2025-08-08 | 13F | Sittner & Nelson, Llc | 29 625 | 5,75 | 947 | 19,42 | ||||
| 2025-08-14 | 13F | EP Wealth Advisors, Inc. | 47 471 | 0,21 | 1 518 | 13,12 | ||||
| 2025-07-23 | 13F | Kingswood Wealth Advisors, Llc | 13 130 | −26,88 | 420 | −17,52 | ||||
| 2025-07-16 | 13F/A | CX Institutional | 1 184 | 30,11 | 0 | |||||
| 2025-08-14 | 13F | Visionary Wealth Advisors | 9 864 | 3,12 | 315 | 16,24 | ||||
| 2025-07-16 | 13F | Perigon Wealth Management, LLC | 6 682 | 214 | ||||||
| 2025-08-04 | 13F | Kovack Advisors, Inc. | 8 270 | −2,23 | 264 | 10,46 | ||||
| 2025-08-13 | 13F | Capital International Investors | 22 341 | −0,02 | 714 | 12,80 | ||||
| 2025-07-08 | 13F | Adamsbrown Wealth Consultants Llc | 12 064 | 46,62 | 386 | 65,24 | ||||
| 2025-07-17 | 13F | Willow Creek Wealth Management Inc. | 9 842 | 0,00 | 315 | 12,95 | ||||
| 2025-08-14 | 13F | Smartleaf Asset Management LLC | 161 598 | 15,93 | 5 199 | 31,23 | ||||
| 2025-08-11 | 13F | Nations Financial Group Inc, /ia/ /adv | 22 949 | 10,87 | 734 | 25,09 | ||||
| 2025-08-12 | 13F | Founders Financial Alliance, LLC | 10 260 | −33,64 | 328 | −24,94 | ||||
| 2025-08-14 | 13F | Comerica Bank | 24 658 | −3,17 | 788 | 9,29 | ||||
| 2025-08-05 | 13F | GPS Wealth Strategies Group, LLC | 580 | 0,00 | 19 | 12,50 | ||||
| 2025-08-11 | 13F | Rothschild Investment Llc | 151 548 | 108,41 | 4 845 | 135,15 | ||||
| 2025-07-10 | 13F | Sovran Advisors, LLC | 97 887 | 317,84 | 3 128 | 391,82 | ||||
| 2025-07-18 | 13F | Trust Co Of Vermont | 354 | 11 | ||||||
| 2025-08-01 | 13F | Envestnet Asset Management Inc | 7 140 661 | 25,07 | 228 287 | 41,14 | ||||
| 2025-08-12 | 13F | OneAscent Financial Services LLC | 163 914 | −16,11 | 5 | 0,00 | ||||
| 2025-07-22 | 13F | Olistico Wealth, LLC | 22 597 | 0,00 | 722 | 12,81 | ||||
| 2025-07-31 | 13F | Whipplewood Advisors, LLC | 614 | 1 016,36 | 20 | −17,39 | ||||
| 2025-07-31 | 13F | Oppenheimer & Co Inc | 26 071 | 54,92 | 833 | 75,00 | ||||
| 2025-05-02 | 13F | Transcendent Capital Group LLC | 0 | −100,00 | 0 | |||||
| 2025-05-14 | 13F | Paces Ferry Wealth Advisors, Llc | 0 | −100,00 | 0 | −100,00 | ||||
| 2025-08-14 | 13F | Bank Of America Corp /de/ | 2 285 289 | 19,67 | 73 061 | 35,04 | ||||
| 2025-08-12 | 13F | Cravens & Co Advisors, LLC | 6 271 | −11,39 | 200 | 0,00 | ||||
| 2025-08-18 | 13F | Geneos Wealth Management Inc. | 82 947 | 423,16 | 2 652 | 490,42 | ||||
| 2025-08-04 | 13F | Pensionmark Financial Group, Llc | 21 954 | 4,30 | 702 | 17,62 | ||||
| 2025-08-27 | 13F/A | Brinker Capital Investments, LLC | 110 281 | −4,53 | 3 526 | 7,73 | ||||
| 2025-07-08 | 13F | Nbc Securities, Inc. | 68 935 | 10,49 | 2 | 100,00 | ||||
| 2025-08-08 | 13F | Hartland & Co., LLC | 18 354 | 1 882,07 | 587 | 2 153,85 | ||||
| 2025-07-08 | 13F | Zrc Wealth Management, Llc | 894 | 0,00 | 29 | 12,00 | ||||
| 2025-07-30 | 13F | Gimbal Financial | 8 980 | −19,96 | 287 | −9,46 | ||||
| 2025-07-24 | 13F | FinDec Wealth Services, Inc. | 10 126 | −63,80 | 324 | −59,22 | ||||
| 2025-08-12 | 13F | Global Retirement Partners, LLC | 7 623 | 42,67 | 244 | 55,77 | ||||
| 2025-08-14 | 13F | Mml Investors Services, Llc | 2 753 304 | 7,65 | 88 | 22,22 | ||||
| 2025-07-25 | 13F | Cwm, Llc | 202 279 | 68,42 | 6 | 100,00 | ||||
| 2025-08-01 | 13F | Signature Wealth Management Group | 19 192 | 4,11 | 614 | 17,43 | ||||
| 2025-07-14 | 13F | S.A. Mason LLC | 1 900 | 0,00 | 61 | 13,21 | ||||
| 2025-08-14 | 13F | Kmt Wealth Management, Llc | 10 286 | 0,00 | 329 | 12,71 | ||||
| 2025-04-24 | 13F | CNB Bank | 0 | −100,00 | 0 | |||||
| 2025-05-15 | 13F/A | Orion Portfolio Solutions, LLC | 115 511 | 14,80 | 3 272 | 11,29 | ||||
| 2025-08-01 | 13F | Gwn Securities Inc. | 6 329 | −68,12 | 202 | −64,06 | ||||
| 2025-07-16 | 13F | Signaturefd, Llc | 84 | 0,00 | 3 | 0,00 | ||||
| 2025-08-06 | 13F | Commonwealth Equity Services, Llc | 5 013 064 | 3,30 | 160 | 16,79 | ||||
| 2025-08-04 | 13F | Assetmark, Inc | 272 105 | 13,76 | 8 699 | 28,38 | ||||
| 2025-08-14 | 13F | Herold Advisors, Inc. | 6 906 | 221 | ||||||
| 2025-07-29 | 13F | Uhlmann Price Securities, Llc | 19 348 | 1,44 | 619 | 14,44 | ||||
| 2025-07-03 | 13F | Arvest Investments, Inc. | 442 | 0,00 | 14 | 16,67 | ||||
| 2025-07-25 | 13F | M.e. Allison & Co., Inc. | 24 318 | 0,00 | 777 | 12,94 | ||||
| 2025-08-15 | 13F | CI Private Wealth, LLC | 707 316 | −2,35 | 22 613 | 10,20 | ||||
| 2025-07-22 | 13F | Confluence Wealth Services, Inc. | 168 127 | 3,68 | 5 375 | 19,68 | ||||
| 2025-08-13 | 13F | VestGen Advisors, LLC | 222 791 | 5,78 | 7 123 | 19,38 | ||||
| 2025-07-18 | 13F | Truist Financial Corp | 79 622 | 10,43 | 2 546 | 24,63 | ||||
| 2025-07-22 | 13F | BridgePort Financial Solutions, LLC | 25 156 | 6,94 | 804 | 20,72 | ||||
| 2025-07-30 | 13F/A | KPP Advisory Services LLC | 103 836 | 3 320 | ||||||
| 2025-07-14 | 13F | Park Avenue Securities Llc | 0 | −100,00 | 0 | |||||
| 2025-08-11 | 13F | Landaas & Co /wi /adv | 11 906 | 0,00 | 381 | 13,06 | ||||
| 2025-08-14 | 13F | Stifel Financial Corp | 717 645 | 19,86 | 22 943 | 35,26 | ||||
| 2025-07-28 | 13F | Mutual Advisors, LLC | 180 782 | 4,56 | 5 910 | 20,35 | ||||
| 2025-08-12 | 13F | Insigneo Advisory Services, Llc | 20 693 | 0,00 | 662 | 12,80 | ||||
| 2025-07-22 | 13F | Ergawealth Advisors, Inc. | 57 355 | 183,53 | 1 834 | 219,90 | ||||
| 2025-08-12 | 13F | Entruity Wealth, LLC | 139 552 | 6,05 | 4 461 | 19,66 | ||||
| 2025-07-29 | 13F | Private Trust Co Na | 12 343 | −9,58 | 395 | 2,07 | ||||
| 2025-08-13 | 13F | Gateway Wealth Partners, LLC | 18 880 | 12,39 | 604 | 26,95 | ||||
| 2025-08-13 | 13F | Natixis Advisors, L.p. | 207 103 | 4,48 | 7 | 20,00 | ||||
| 2025-08-04 | 13F | Balentine LLC | 185 607 | 16,04 | 5 934 | 30,94 | ||||
| 2025-08-04 | 13F | Daymark Wealth Partners, Llc | 9 905 | 317 | ||||||
| 2025-08-13 | 13F | Marshall Wace, Llp | 56 364 | 1 802 | ||||||
| 2025-07-29 | 13F | Stratos Wealth Partners, LTD. | 290 351 | 9,19 | 9 283 | 23,22 | ||||
| 2025-07-30 | 13F | D.a. Davidson & Co. | 794 813 | 18,95 | 25 410 | 34,24 | ||||
| 2025-08-15 | 13F | Morgan Stanley | 7 498 646 | 2,44 | 239 732 | 15,60 | ||||
| 2025-08-04 | 13F | Mayflower Financial Advisors, LLC | 9 715 | 0,00 | 311 | 12,73 | ||||
| 2025-08-12 | 13F | SRS Capital Advisors, Inc. | 1 505 | 203,43 | 48 | 242,86 | ||||
| 2025-07-25 | 13F | Envestnet Portfolio Solutions, Inc. | 86 246 | −52,35 | 2 757 | −46,23 | ||||
| 2025-08-13 | 13F | Vermillion & White Wealth Management Group, LLC | 3 286 | 3,17 | 105 | 16,67 | ||||
| 2025-07-11 | 13F | Pinnacle Bancorp, Inc. | 5 500 | 22,22 | 176 | 37,80 | ||||
| 2025-07-01 | 13F | Kera Capital Partners, Inc. | 145 683 | −1,12 | 4 657 | 11,60 | ||||
| 2025-08-01 | 13F | Bessemer Group Inc | 9 750 | 0,00 | 0 | |||||
| 2025-07-16 | 13F | Howard Capital Management Group, LLC | 18 566 | 0,00 | 594 | 12,95 | ||||
| 2025-08-14 | 13F | Money Concepts Capital Corp | 10 762 | 344 | ||||||
| 2025-07-25 | 13F | Total Clarity Wealth Management, Inc. | 43 621 | −2,88 | 1 395 | 6,25 | ||||
| 2025-05-12 | 13F | Fmr Llc | 0 | −100,00 | 0 | |||||
| 2025-08-08 | 13F | Avantax Advisory Services, Inc. | 382 478 | 70,92 | 12 228 | 92,89 | ||||
| 2025-05-12 | 13F | Independent Advisor Alliance | 0 | −100,00 | 0 | |||||
| 2025-07-31 | 13F | Brighton Jones Llc | 8 790 | 5,48 | 281 | 19,07 | ||||
| 2025-07-24 | 13F | Endeavor Private Wealth, Inc. | 71 803 | 21,37 | 2 317 | 38,33 | ||||
| 2025-08-14 | 13F | Ameriprise Financial Inc | 8 747 | 280 | ||||||
| 2025-08-14 | 13F | D. E. Shaw & Co., Inc. | 16 791 | 537 | ||||||
| 2025-08-05 | 13F | Sigma Planning Corp | 11 341 | −6,53 | 363 | 5,54 | ||||
| 2025-07-28 | 13F | Nvest Financial, LLC | 8 386 | −25,53 | 268 | −15,99 | ||||
| 2025-07-30 | 13F | Paragon Advisors, LLC | 153 948 | 8,64 | 4 922 | 22,60 | ||||
| 2025-08-13 | 13F | Northwestern Mutual Wealth Management Co | 10 760 763 | 0,13 | 344 022 | 13,00 | ||||
| 2025-07-16 | 13F | Octavia Wealth Advisors, LLC | 10 156 | 1,72 | 328 | 15,96 | ||||
| 2025-08-08 | 13F | Meridian Wealth Management, LLC | 48 471 | 0,31 | 1 550 | 13,23 | ||||
| 2025-08-14 | 13F/A | Rockefeller Capital Management L.P. | 22 470 | 16,66 | 718 | 31,74 | ||||
| 2025-08-14 | 13F | CoreCap Advisors, LLC | 1 911 | −49,60 | 61 | −42,99 | ||||
| 2025-08-12 | 13F | Waterloo Capital, L.P. | 13 112 | −2,92 | 419 | 9,69 | ||||
| 2025-08-05 | 13F | Plante Moran Financial Advisors, LLC | 0 | −100,00 | 0 | |||||
| 2025-07-23 | 13F | Armstrong, Fleming & Moore, Inc | 43 657 | 1 396 | ||||||
| 2025-08-14 | 13F | McIlrath & Eck, LLC | 523 | 0,00 | 17 | 14,29 | ||||
| 2025-08-08 | 13F | Creative Planning | 38 732 | 2,02 | 1 238 | 15,16 | ||||
| 2025-08-14 | 13F/A | Skopos Labs, Inc. | 190 | 6 |