Grundläggande statistik
| Institutionella ägare | 189 total, 186 long only, 1 short only, 2 long/short - change of 0,53% MRQ |
| Genomsnittlig portföljallokering | 0.2127 % - change of −14,93% MRQ |
| Institutionella aktier (lång) | 49 034 093 (ex 13D/G) - change of 13,53MM shares 38,12% MRQ |
| Institutionellt värde (lång) | $ 398 403 USD ($1000) |
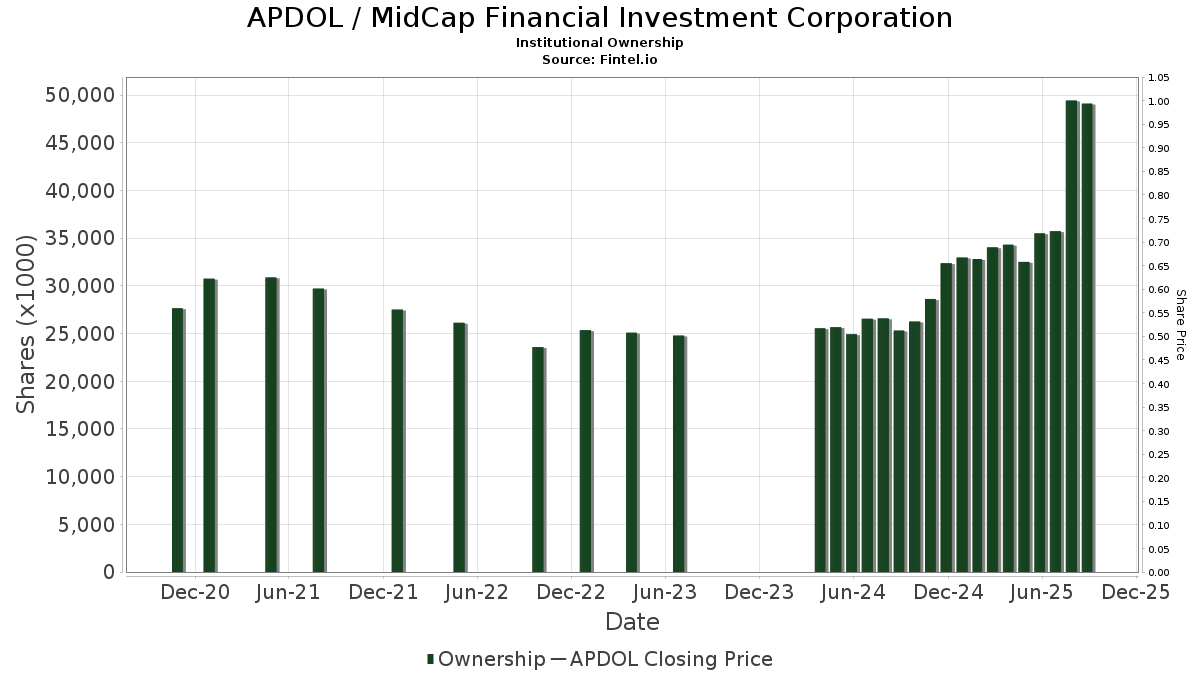
Institutionellt ägande och aktieägare
MidCap Financial Investment Corporation (US:APDOL) har 189 Institutionella ägare och aktieägare som har lämnat in 13D/G- eller 13F-formulär till Securities Exchange Commission (SEC). Dessa institut innehar totalt 49,034,093 aktier. Största aktieägare inkluderar Kingstone Capital Partners Texas, LLC, Thornburg Investment Management Inc, TIBAX - Thornburg Investment Income Builder Fund - Class A, Van Eck Associates Corp, Apollo Management Holdings, L.P., BIZD - VanEck Vectors BDC Income ETF, Morgan Stanley, UBS Group AG, KBWD - Invesco KBW High Dividend Yield Financial ETF, and Franklin Resources Inc .
MidCap Financial Investment Corporation (OTCPK:APDOL) Institutionell ägarstruktur visar institutioners och fonders nuvarande positioner i företaget, samt de senaste förändringarna i positionernas storlek. Större aktieägare kan vara enskilda investerare, fonder, hedgefonder eller institutioner. Bilaga 13D visar att investeraren äger (eller ägde) mer än 5% av företaget och avser (eller avsåg) att aktivt eftersträva en förändring av affärsstrategin. Schedule 13G indikerar en passiv investering på över 5%.
Fondsentimentets poäng
Fondsentimentet poängen(fka Ägarackumulation-poäng) visar vilka aktier som är mest köpta av fonder. Det är resultatet av en sofistikerad kvantitativ flerfaktormodell som identifierar företag med de högsta nivåerna av institutionell ackumulering. Poängsättningsmodellen använder en kombination av den totala ökningen av redovisade ägare, förändringarna i portföljallokeringarna för dessa ägare och andra mått. Siffran sträcker sig från 0 till 100, där högre siffror indikerar en högre nivå av ackumulering i förhållande till sina konkurrenter, och 50 är genomsnittet.
Uppdateringsfrekvens: Dagligen
Se Ownership Explorer, som innehåller en lista över de högst rankade företagen.
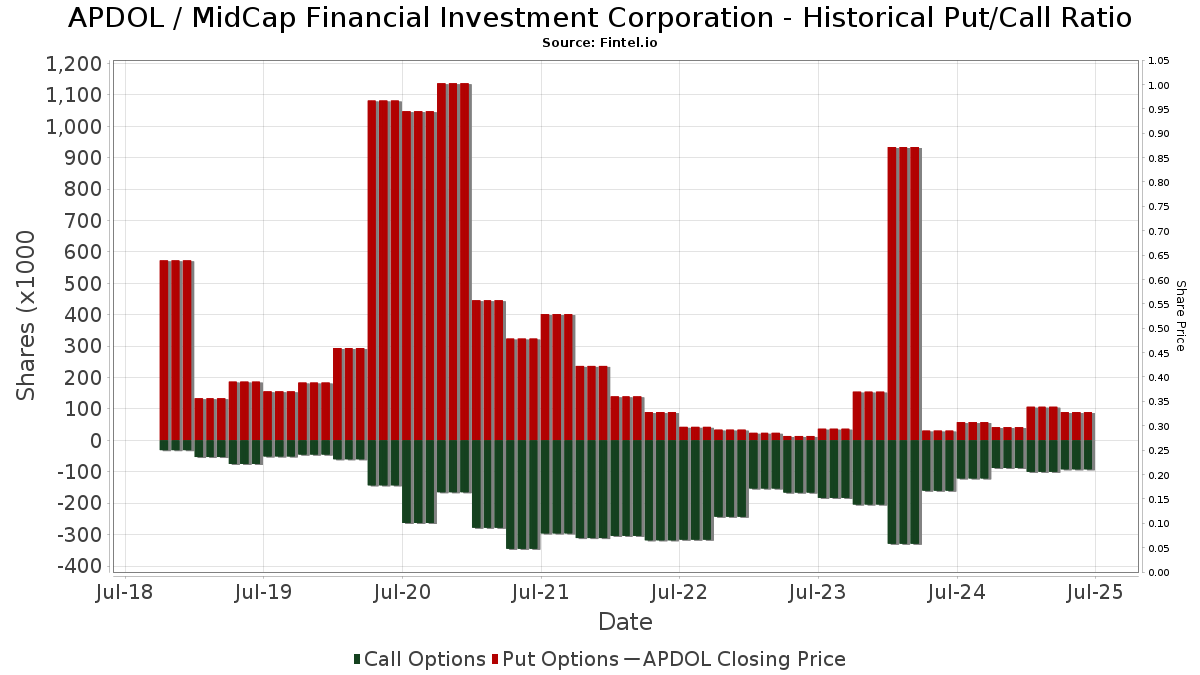
Institutionell sälj/köp-kvot
Förutom att rapportera vanliga eget kapital- och skuldemissioner måste institutioner med mer än 100MM tillgångar under förvaltning också avslöja sina innehav av sälj- och köpoptioner. Eftersom säljoptioner i allmänhet indikerar ett negativt sentiment och köpoptioner indikerar ett positivt sentiment, kan vi få en uppfattning om det övergripande institutionella sentimentet genom att plotta förhållandet mellan säljoptioner och köpoptioner. Diagrammet till höger visar det historiska förhållandet mellan sälj- och köpoptioner för detta instrument.
Genom att använda sälj/köp-kvoten som en indikator på aktieägarnas sentiment undviker man en av de största bristerna med att använda det totala institutionella ägandet, nämligen att en betydande del av de förvaltade tillgångarna investeras passivt för att följa index. Passivt förvaltade fonder köper vanligtvis inte optioner, så indikatorn för sälj/köp-kvoten ger en bättre bild av stämningen i aktivt förvaltade fonder.
13F- och NPORT-arkiveringar
Detaljer om 13F-arkiveringar är gratis. Detaljer om NP-arkiveringar kräver ett premiummedlemskap. Gröna rader indikerar nya positioner. Röda rader indikerar stängda positioner. Klicka på länk symbolen för att se hela transaktionshistoriken.
Uppgradera
för att låsa upp premiumdata och exportera till Excel ![]() .
.
| Fil Datum | Källa | Investerare | Typ | Genomsnittligt pris (beräknat) |
Aktier | Δ Aktier (%) |
Rapporterat värde (1000 USD) |
Δ Värde (%) |
Portföljallokering (%) |
|
|---|---|---|---|---|---|---|---|---|---|---|
| 2025-08-14 | 13F | Group One Trading, L.p. | 699 | 9 | ||||||
| 2025-08-14 | 13F | Crawford Fund Management, LLC | Put | 62 400 | −23,81 | 787 | −25,26 | |||
| 2025-07-31 | 13F | Sumitomo Mitsui Trust Holdings, Inc. | 334 994 | 44,03 | 4 228 | 41,32 | ||||
| 2025-08-19 | 13F | Newbridge Financial Services Group, Inc. | 276 | 3 | ||||||
| 2025-07-16 | 13F | Essex Financial Services, Inc. | 10 621 | 0,18 | 134 | −1,47 | ||||
| 2025-08-25 | 13F/A | Neuberger Berman Group LLC | 472 254 | 0,10 | 5 960 | −1,78 | ||||
| 2025-07-29 | NP | SLPAX - Siit Small Cap Fund - Class A | 21 366 | 0,00 | 280 | −4,76 | ||||
| 2025-07-25 | 13F | Cwm, Llc | 1 050 | 0 | ||||||
| 2025-08-14 | 13F | Jane Street Group, Llc | 15 105 | 191 | ||||||
| 2025-08-18 | 13F | N.E.W. Advisory Services LLC | 48 | 0,00 | 1 | |||||
| 2025-08-06 | 13F | Ethos Financial Group, LLC | 421 901 | 1,43 | 5 324 | −0,69 | ||||
| 2025-08-14 | 13F | Kovitz Investment Group Partners, LLC | 109 666 | 0,00 | 1 384 | −1,91 | ||||
| 2025-06-18 | NP | Putnam ETF Trust - Putnam BDC ETF - | 709 025 | 28,11 | 8 409 | 8,53 | ||||
| 2025-08-14 | 13F | CF Capital LLC | 0 | −100,00 | 0 | |||||
| 2025-08-14 | 13F | Bnp Paribas Arbitrage, Sa | 0 | −100,00 | 0 | |||||
| 2025-08-14 | 13F | UBS Group AG | 1 667 288 | 32,19 | 21 041 | 29,72 | ||||
| 2025-08-04 | 13F | Muzinich & Co., Inc. | 401 393 | 68,35 | 5 066 | 65,20 | ||||
| 2025-08-14 | 13F | First Commonwealth Financial Corp /pa/ | 24 175 | 0,00 | 305 | −1,61 | ||||
| 2025-07-21 | 13F | Ameritas Advisory Services, LLC | 2 518 | 32 | ||||||
| 2025-07-29 | 13F | International Assets Investment Management, Llc | 25 996 | 1,57 | 328 | −0,30 | ||||
| 2025-08-12 | 13F | AlphaCore Capital LLC | 11 529 | −36,97 | 145 | −38,30 | ||||
| 2025-05-13 | 13F | Sterling Capital Management LLC | 0 | −100,00 | 0 | |||||
| 2025-05-15 | 13F | Tudor Investment Corp Et Al | 0 | −100,00 | 0 | |||||
| 2025-07-08 | 13F | Parallel Advisors, LLC | 7 680 | −8,08 | 97 | −10,28 | ||||
| 2025-08-01 | 13F | Bessemer Group Inc | 3 304 | 0,00 | 0 | |||||
| 2025-08-05 | 13F | Access Investment Management LLC | 4 000 | 0,00 | 50 | −5,66 | ||||
| 2025-08-14 | 13F | CoreCap Advisors, LLC | 1 132 | 0,00 | 14 | 0,00 | ||||
| 2025-07-10 | 13F | Security National Bank | 6 044 | 6,11 | 76 | 4,11 | ||||
| 2025-08-13 | 13F | Congress Wealth Management LLC / DE / | 76 278 | 158,23 | 963 | 153,83 | ||||
| 2025-08-15 | 13F | Tower Research Capital LLC (TRC) | 9 513 | 20 580,43 | 120 | |||||
| 2025-08-26 | NP | WCERX - WCM Alternatives: Event-Driven Fund - Investor Class Shares | 7 702 | 0,00 | 97 | −2,02 | ||||
| 2025-08-13 | 13F | Northwestern Mutual Wealth Management Co | 563 | −25,73 | 7 | −22,22 | ||||
| 2025-06-26 | NP | DVDN - Kingsbarn Dividend Opportunity ETF | 0 | −100,00 | 0 | −100,00 | ||||
| 2025-08-13 | 13F | Lansforsakringar Fondforvaltning AB (publ) | 0 | −100,00 | 0 | |||||
| 2025-07-29 | 13F | Stephens Inc /ar/ | 84 191 | 0,00 | 1 062 | −1,85 | ||||
| 2025-08-13 | 13F | Quantbot Technologies LP | 18 246 | 230 | ||||||
| 2025-08-14 | 13F | Lazard Asset Management Llc | 112 935 | 44,54 | 1 | 0,00 | ||||
| 2025-08-12 | 13F | Legal & General Group Plc | 616 852 | −1,30 | 7 791 | −3,11 | ||||
| 2025-05-14 | 13F | Virtus ETF Advisers LLC | 0 | −100,00 | 0 | |||||
| 2025-07-15 | 13F | Graypoint LLC | 186 797 | 3,06 | 2 357 | 1,16 | ||||
| 2025-07-18 | 13F | Generali Investments CEE, investicni spolecnost, a.s. | 24 139 | 6,25 | 305 | 4,11 | ||||
| 2025-08-12 | 13F | Private Management Group Inc | 10 317 | 130 | ||||||
| 2025-08-13 | 13F | Thornburg Investment Management Inc | 2 937 783 | 0,00 | 37 075 | −90,19 | ||||
| 2025-08-07 | 13F | ProShare Advisors LLC | 18 546 | −4,36 | 234 | −6,02 | ||||
| 2025-08-14 | 13F | Comerica Bank | 91 955 | 10,91 | 1 160 | 8,82 | ||||
| 2025-05-12 | 13F | Entropy Technologies, LP | 0 | −100,00 | 0 | |||||
| 2025-08-14 | 13F | Van Eck Associates Corp | 2 390 155 | 6,81 | 30 | 7,14 | ||||
| 2025-08-14 | 13F | Ameriprise Financial Inc | 402 636 | 16,63 | 5 081 | 14,44 | ||||
| 2025-07-10 | 13F | Capital Advisory Group Advisory Services, LLC | 34 677 | 0,00 | 438 | −1,80 | ||||
| 2025-08-07 | 13F | Allworth Financial LP | 3 224 | 26,04 | 41 | 33,33 | ||||
| 2025-07-28 | 13F | Frazier Financial Advisors, LLC | 0 | 0 | ||||||
| 2025-08-07 | 13F | Panoramic Investment Advisors, Llc | 53 630 | 0,00 | 677 | −1,89 | ||||
| 2025-05-14 | 13F | CIBC World Markets Inc. | 0 | −100,00 | 0 | |||||
| 2025-07-28 | 13F | Harbour Investments, Inc. | 6 409 | 0,00 | 81 | −2,44 | ||||
| 2025-08-08 | 13F | Creative Planning | 14 539 | 5,62 | 183 | 3,39 | ||||
| 2025-08-14 | 13F | Susquehanna International Group, Llp | 0 | −100,00 | 0 | |||||
| 2025-08-11 | 13F | United Advisor Group, LLC | 256 852 | 0,24 | 3 241 | −1,64 | ||||
| 2025-07-14 | 13F | GAMMA Investing LLC | 0 | −100,00 | 0 | |||||
| 2025-08-11 | 13F | Shufro Rose & Co Llc | 41 834 | −5,23 | 538 | −5,29 | ||||
| 2025-09-04 | 13F/A | Advisor Group Holdings, Inc. | 95 698 | 1,59 | 1 208 | −0,25 | ||||
| 2025-08-18 | 13F/A | Apollo Management Holdings, L.P. | 2 388 857 | 0,00 | 30 147 | −1,87 | ||||
| 2025-07-30 | 13F | Denali Advisors Llc | 87 681 | −2,58 | 1 107 | −4,41 | ||||
| 2025-08-05 | 13F | Key FInancial Inc | 150 | 0,00 | 2 | 0,00 | ||||
| 2025-04-11 | 13F | Stablepoint Partners, LLC | 0 | −100,00 | 0 | |||||
| 2025-08-13 | 13F | Virtus Investment Advisers, Inc. | 69 513 | −2,23 | 877 | −4,05 | ||||
| 2025-08-08 | 13F | Cetera Investment Advisers | 30 384 | 2,09 | 383 | 0,26 | ||||
| 2025-07-25 | NP | First Trust Specialty Finance & Financial Opportunities Fund This fund is a listed as child fund of First Trust Advisors Lp and if that institution has disclosed ownership in this security, then these positions will not be double counted when calculating total shares and total value | 140 000 | 115,38 | 1 838 | 105,25 | ||||
| 2025-07-30 | 13F | D.a. Davidson & Co. | 328 055 | 4,84 | 4 140 | 2,88 | ||||
| 2025-07-09 | 13F | Westbourne Investments, Inc. | 18 930 | −72,49 | 239 | −73,08 | ||||
| 2025-08-06 | 13F | Axim Planning & Wealth | 11 780 | 149 | ||||||
| 2025-08-05 | 13F | Castlekeep Investment Advisors Llc | 388 911 | 0,02 | 4 908 | −1,84 | ||||
| 2025-08-14 | 13F | Susquehanna International Group, Llp | Put | 10 500 | −40,68 | 133 | −41,85 | |||
| 2025-08-14 | 13F | Citadel Advisors Llc | Call | 52 000 | −19,25 | 656 | −20,77 | |||
| 2025-08-14 | 13F | Citadel Advisors Llc | 24 371 | 308 | ||||||
| 2025-08-14 | 13F | Susquehanna International Group, Llp | Call | 26 400 | −26,05 | 333 | −27,45 | |||
| 2025-08-14 | 13F | Citadel Advisors Llc | Put | 17 800 | 140,54 | 225 | 135,79 | |||
| 2025-08-08 | 13F | Pnc Financial Services Group, Inc. | 14 142 | 0,00 | 178 | −1,66 | ||||
| 2025-08-13 | 13F | Cheviot Value Management, LLC | 333 | 0,00 | 4 | 33,33 | ||||
| 2025-06-25 | NP | VPC - Virtus Private Credit Strategy ETF | 64 946 | −5,82 | 770 | −20,21 | ||||
| 2025-08-12 | 13F | CIBC Private Wealth Group, LLC | 3 675 | 0,00 | 46 | 21,05 | ||||
| 2025-08-14 | 13F | Stifel Financial Corp | 334 446 | −0,20 | 4 221 | −2,07 | ||||
| 2025-08-12 | 13F | Advisors Asset Management, Inc. | 362 391 | −23,53 | 4 573 | −24,96 | ||||
| 2025-08-12 | 13F | Jpmorgan Chase & Co | 58 763 | −49,81 | 742 | −50,76 | ||||
| 2025-08-14 | 13F | Ausdal Financial Partners, Inc. | 10 999 | −10,95 | 139 | −12,66 | ||||
| 2025-07-28 | NP | PEX - ProShares Global Listed Private Equity ETF | 19 829 | 1,22 | 260 | −3,35 | ||||
| 2025-08-11 | 13F | HighTower Advisors, LLC | 89 492 | 4,59 | 1 129 | 2,64 | ||||
| 2025-08-12 | 13F | Walled Lake Planning & Wealth Management, Llc | 22 271 | 0,00 | 281 | −1,75 | ||||
| 2025-08-14 | 13F | Bank Of America Corp /de/ | 194 265 | −48,38 | 2 452 | −49,35 | ||||
| 2025-08-14 | 13F | Two Sigma Advisers, Lp | 223 220 | −0,34 | 2 817 | −2,19 | ||||
| 2025-08-05 | 13F | Sigma Planning Corp | 73 046 | 3,08 | 922 | 1,10 | ||||
| 2025-08-14 | 13F | Arete Wealth Advisors, LLC | 15 938 | 3,24 | 0 | |||||
| 2025-04-28 | 13F | Redmont Wealth Advisors Llc | 13 054 | 0,00 | 168 | −5,11 | ||||
| 2025-08-13 | 13F | Everstar Asset Management, LLC | 20 850 | −12,58 | 263 | −14,05 | ||||
| 2025-07-31 | 13F | Oppenheimer & Co Inc | 15 743 | 1,94 | 199 | 0,00 | ||||
| 2025-08-12 | 13F | BlackRock, Inc. | 611 877 | 32,91 | 7 722 | 30,42 | ||||
| 2025-08-12 | 13F | SRS Capital Advisors, Inc. | 660 | 8 | ||||||
| 2025-05-27 | NP | Brighthouse Funds Trust I - Brighthouse Small Cap Value Portfolio Class A | 131 542 | 0,00 | 1 692 | −4,68 | ||||
| 2025-07-28 | 13F | Naviter Wealth, LLC | 203 259 | 2,92 | 2 565 | −0,39 | ||||
| 2025-08-07 | 13F | Parkside Financial Bank & Trust | 7 276 | 3,00 | 92 | 1,11 | ||||
| 2025-08-14 | 13F | Williams Jones Wealth Management, LLC. | 10 901 | 0,00 | 138 | −2,14 | ||||
| 2025-07-08 | 13F | Nbc Securities, Inc. | 300 | 0,00 | 0 | |||||
| 2025-07-18 | 13F | Founders Capital Management | 1 500 | 0,00 | 19 | −5,26 | ||||
| 2025-07-11 | 13F | Orrstown Financial Services Inc | 13 640 | 0,00 | 172 | −1,71 | ||||
| 2025-07-23 | 13F | Tcfg Wealth Management, Llc | 41 656 | 0,00 | 526 | −1,87 | ||||
| 2025-08-19 | 13F | National Asset Management, Inc. | 19 102 | 241 | ||||||
| 2025-07-24 | 13F | IFP Advisors, Inc | 1 514 | 0,93 | 19 | 0,00 | ||||
| 2025-08-14 | 13F | Westchester Capital Management, LLC | 7 702 | 0,00 | 97 | −2,02 | ||||
| 2025-08-13 | 13F | Jones Financial Companies Lllp | 6 614 | 26,85 | 83 | 22,39 | ||||
| 2025-08-11 | 13F | Principal Securities, Inc. | 36 999 | 37,40 | 467 | 28,37 | ||||
| 2025-07-15 | 13F | DKM Wealth Management, Inc. | 23 500 | 0,00 | 297 | −1,99 | ||||
| 2025-08-11 | 13F | Anfield Capital Management, LLC | 8 804 | 5,41 | 111 | 3,74 | ||||
| 2025-08-13 | 13F | StoneX Group Inc. | 13 956 | 4,42 | 176 | 2,92 | ||||
| 2025-08-05 | 13F | GPS Wealth Strategies Group, LLC | 1 079 | 0,00 | 14 | 0,00 | ||||
| 2025-08-14 | 13F | Millennium Management Llc | 246 923 | 1 100,93 | 3 116 | 1 080,30 | ||||
| 2025-07-08 | 13F | Ransom Advisory, Ltd | 0 | −100,00 | 0 | |||||
| 2025-08-19 | 13F | Asset Dedication, LLC | 0 | −100,00 | 0 | |||||
| 2025-08-12 | 13F | Steward Partners Investment Advisory, Llc | 35 291 | 1,13 | 445 | −0,67 | ||||
| 2025-08-04 | 13F | Arkadios Wealth Advisors | 103 954 | 4,97 | 1 312 | 2,99 | ||||
| 2025-08-06 | 13F | LeClair Wealth Partners LLC | 40 885 | 0,00 | 516 | −1,90 | ||||
| 2025-07-17 | 13F/A | Capital Investment Advisors, LLC | 70 434 | −4,03 | 889 | −5,83 | ||||
| 2025-08-27 | 13F/A | Squarepoint Ops LLC | 0 | −100,00 | 0 | −100,00 | ||||
| 2025-05-15 | 13F | Aquatic Capital Management LLC | 0 | −100,00 | 0 | |||||
| 2025-08-13 | 13F | Transce3nd, LLC | 5 439 | 269,75 | 69 | 277,78 | ||||
| 2025-07-11 | 13F | Farther Finance Advisors, LLC | 584 | −73,56 | 7 | −75,00 | ||||
| 2025-05-15 | 13F | Nebula Research & Development LLC | 0 | −100,00 | 0 | −100,00 | ||||
| 2025-08-07 | 13F | Acadian Asset Management Llc | 764 | −22,83 | 0 | |||||
| 2025-05-09 | 13F | TD Waterhouse Canada Inc. | 0 | −100,00 | 0 | |||||
| 2025-07-11 | 13F | Kingstone Capital Partners Texas, LLC | 13 812 738 | 189 | ||||||
| 2025-08-14 | 13F | Royal Bank Of Canada | 237 209 | 17,79 | 2 994 | 15,60 | ||||
| 2025-08-11 | 13F | Wealthspire Advisors, LLC | 10 018 | 126 | ||||||
| 2025-08-14 | 13F | Cura Wealth Advisors, Llc | 708 959 | 9,31 | 8 947 | 7,28 | ||||
| 2025-08-08 | 13F | Condor Capital Management | 412 875 | 3,98 | 5 210 | 2,04 | ||||
| 2025-08-14 | 13F | Two Sigma Investments, Lp | 222 459 | 5,80 | 2 807 | 3,81 | ||||
| 2025-08-06 | 13F | Wedbush Securities Inc | 36 643 | 0,97 | 0 | |||||
| 2025-08-15 | 13F | Morgan Stanley | 1 887 140 | 3,52 | 23 816 | 1,58 | ||||
| 2025-05-05 | 13F | Lindbrook Capital, Llc | 38 | 0,00 | 0 | |||||
| 2025-08-15 | 13F | Caxton Associates Llp | 12 886 | 0,00 | 163 | −1,82 | ||||
| 2025-07-25 | 13F | Allspring Global Investments Holdings, LLC | 0 | −100,00 | 0 | −100,00 | ||||
| 2025-08-15 | 13F | Great West Life Assurance Co /can/ | 93 857 | 5,07 | 1 | 0,00 | ||||
| 2025-08-07 | 13F | Connor, Clark & Lunn Investment Management Ltd. | 51 851 | −50,00 | 654 | −50,94 | ||||
| 2025-08-14 | 13F | Two Sigma Securities, Llc | 10 561 | 133 | ||||||
| 2025-08-13 | 13F | Northern Trust Corp | 33 081 | 417 | ||||||
| 2025-08-19 | 13F | Advisory Services Network, LLC | 23 530 | 12,00 | 296 | 9,63 | ||||
| 2025-08-28 | NP | Monachil Credit Income Fund | 10 000 | 126 | ||||||
| 2025-08-07 | 13F | Evoke Wealth, Llc | 36 800 | 0,00 | 464 | −1,90 | ||||
| 2025-08-14 | 13F/A | Rockefeller Capital Management L.P. | 77 277 | 1,46 | 975 | −0,41 | ||||
| 2025-07-18 | 13F | Truist Financial Corp | 25 850 | −6,51 | 326 | −8,17 | ||||
| 2025-08-04 | 13F | Assetmark, Inc | 500 | 6 | ||||||
| 2025-08-13 | 13F | M Holdings Securities, Inc. | 72 318 | −3,06 | 1 | |||||
| 2025-08-21 | NP | TIBAX - Thornburg Investment Income Builder Fund - Class A | 2 937 783 | 0,00 | 37 075 | −1,87 | ||||
| 2025-04-25 | NP | VSSVX - Small Cap Special Values Fund | 62 406 | −2,28 | 860 | −4,98 | ||||
| 2025-07-17 | 13F | HB Wealth Management, LLC | 12 819 | 3,00 | 162 | 0,63 | ||||
| 2025-08-14 | 13F | Wells Fargo & Company/mn | 584 965 | 0,12 | 7 382 | −1,74 | ||||
| 2025-08-14 | 13F | Brevan Howard Capital Management LP | 23 780 | 9,01 | 300 | 7,14 | ||||
| 2025-07-31 | 13F | MQS Management LLC | 0 | −100,00 | 0 | |||||
| 2025-08-12 | 13F | Proequities, Inc. | 0 | 0 | ||||||
| 2025-08-25 | 13F/A | Promus Capital, LLC | 5 300 | 0,00 | 67 | −2,94 | ||||
| 2025-08-15 | 13F | WFA of San Diego, LLC | 0 | −100,00 | 0 | |||||
| 2025-07-18 | 13F | Trust Co Of Vermont | 466 | 6 | ||||||
| 2025-08-14 | 13F | Verition Fund Management LLC | 47 589 | 601 | ||||||
| 2025-07-30 | 13F | Onyx Bridge Wealth Group LLC | 17 539 | 1,44 | 221 | −0,45 | ||||
| 2025-08-11 | 13F | Citigroup Inc | 0 | −100,00 | 0 | |||||
| 2025-08-21 | NP | BIZD - VanEck Vectors BDC Income ETF | 2 113 835 | 2,33 | 26 677 | 0,42 | ||||
| 2025-08-13 | 13F | Garner Asset Management Corp | 111 631 | −15,34 | 1 409 | −16,93 | ||||
| 2025-08-14 | 13F | NCP Inc. | 0 | −100,00 | 0 | |||||
| 2025-07-25 | 13F | Sovereign Financial Group, Inc. | 12 113 | 0,00 | 153 | −1,94 | ||||
| 2025-05-15 | 13F | WPG Advisers, LLC | 0 | −100,00 | 0 | −100,00 | ||||
| 2025-08-07 | 13F | Resources Investment Advisors, LLC. | 18 947 | −29,58 | 239 | −30,92 | ||||
| 2025-07-28 | NP | KBWD - Invesco KBW High Dividend Yield Financial ETF This fund is a listed as child fund of Invesco Ltd. and if that institution has disclosed ownership in this security, then these positions will not be double counted when calculating total shares and total value | 864 454 | 13,13 | 11 346 | 7,75 | ||||
| 2025-06-27 | NP | LBO - WHITEWOLF Publicly Listed Private Equity ETF | 6 075 | 14,28 | 72 | −2,70 | ||||
| 2025-07-24 | 13F | Us Bancorp \de\ | 23 359 | −7,59 | 295 | −9,54 | ||||
| 2025-08-14 | 13F | Peak6 Llc | Call | 13 900 | 175 | |||||
| 2025-07-16 | 13F | Signaturefd, Llc | 3 387 | 88,48 | 43 | 82,61 | ||||
| 2025-08-12 | 13F | Global Retirement Partners, LLC | 445 | 6 | ||||||
| 2025-08-15 | 13F | Provenance Wealth Advisors, LLC | 0 | −100,00 | 0 | |||||
| 2025-07-22 | 13F | Accel Wealth Management | 13 731 | 0,59 | 173 | −1,14 | ||||
| 2025-08-13 | 13F | Callodine Capital Management, LP | 500 000 | 22,00 | 6 310 | 19,73 | ||||
| 2025-08-12 | 13F | LPL Financial LLC | 538 467 | −4,21 | 6 795 | −6,00 | ||||
| 2025-08-06 | 13F | Fox Run Management, L.l.c. | 0 | −100,00 | 0 | |||||
| 2025-08-13 | 13F | 1832 Asset Management L.P. | 0 | −100,00 | 0 | |||||
| 2025-08-21 | NP | MOFTX - Mercer Opportunistic Fixed Income Fund Class I | 42 000 | 530 | ||||||
| 2025-05-15 | 13F | Barclays Plc | 0 | −100,00 | 0 | |||||
| 2025-04-30 | 13F | POM Investment Strategies, LLC | 0 | −100,00 | 0 | |||||
| 2025-08-11 | 13F | Sharpepoint Llc | 80 563 | 17,49 | 1 017 | 23,00 | ||||
| 2025-07-29 | 13F | Activest Wealth Management | 2 266 | 0,00 | 29 | −3,45 | ||||
| 2025-08-14 | 13F | Raymond James Financial Inc | 48 311 | −23,74 | 610 | −25,18 | ||||
| 2025-08-12 | 13F | DnB Asset Management AS | 164 114 | 0,00 | 2 071 | −1,85 | ||||
| 2025-08-14 | 13F | Almitas Capital LLC | 92 717 | −35,11 | 1 170 | −36,31 | ||||
| 2025-05-13 | 13F | Sei Investments Co | 49 089 | 0,00 | 662 | 0,00 | ||||
| 2025-08-11 | 13F | Lsv Asset Management | 104 866 | 0,00 | 1 | 0,00 | ||||
| 2025-08-07 | 13F | Hennion & Walsh Asset Management, Inc. | 223 557 | −27,97 | 2 821 | −29,32 | ||||
| 2025-08-13 | 13F | Invesco Ltd. | 770 438 | −12,31 | 9 723 | −13,95 | ||||
| 2025-08-08 | 13F | Foundations Investment Advisors, LLC | 371 828 | −13,00 | 4 692 | −14,63 | ||||
| 2025-05-12 | 13F | Virtu Financial LLC | 0 | −100,00 | 0 | |||||
| 2025-08-04 | 13F | Hantz Financial Services, Inc. | 500 | 0,00 | 0 | |||||
| 2025-07-23 | 13F | Tyche Wealth Partners LLC | 23 500 | 20,51 | 297 | 18,40 | ||||
| 2025-08-11 | 13F | Private Advisor Group, LLC | 0 | −100,00 | 0 | |||||
| 2025-08-07 | 13F | Global Wealth Management Investment Advisory, Inc. | 85 220 | 7,73 | 1 075 | 5,70 | ||||
| 2025-05-14 | 13F | Credit Agricole S A | 28 265 | 0,00 | 363 | −4,72 | ||||
| 2025-08-12 | 13F | J.w. Cole Advisors, Inc. | 119 168 | 12,80 | 1 504 | 10,68 | ||||
| 2025-08-01 | 13F | Envestnet Asset Management Inc | 48 838 | 8,96 | 616 | 6,94 | ||||
| 2025-08-12 | 13F | Trexquant Investment LP | 13 777 | 174 | ||||||
| 2025-04-28 | 13F | Strategic Financial Concepts, LLC | 0 | −100,00 | 0 | −100,00 | ||||
| 2025-08-11 | 13F | Nomura Asset Management Co Ltd | 6 706 | 20,63 | 85 | 18,31 | ||||
| 2025-08-13 | 13F | Lido Advisors, LLC | 69 158 | 13,65 | 873 | 11,51 | ||||
| 2025-07-17 | 13F | Janney Montgomery Scott LLC | 56 575 | −2,33 | 1 | |||||
| 2025-07-16 | 13F | Meridian Investment Counsel Inc. | 42 045 | −21,33 | 531 | −22,85 | ||||
| 2025-08-14 | 13F | Wealth Preservation Advisors, LLC | 0 | −100,00 | 0 | |||||
| 2025-07-14 | 13F | AdvisorNet Financial, Inc | 157 228 | −7,98 | 1 984 | −9,70 | ||||
| 2025-08-15 | 13F | Kestra Advisory Services, LLC | 19 263 | 43,28 | 243 | 41,28 | ||||
| 2025-08-14 | 13F | Ares Management Llc | 545 532 | 13,17 | 6 885 | 11,07 | ||||
| 2025-07-31 | 13F | Cambridge Investment Research Advisors, Inc. | 11 358 | −45,04 | 0 | |||||
| 2025-05-12 | 13F | National Bank Of Canada /fi/ | 0 | −100,00 | 0 | |||||
| 2025-08-06 | 13F | Commonwealth Equity Services, Llc | 466 028 | 33,05 | 6 | 25,00 | ||||
| 2025-08-19 | 13F | Anchor Investment Management, LLC | 2 577 | 0,00 | 33 | −3,03 | ||||
| 2025-05-02 | 13F | Transcendent Capital Group LLC | 0 | −100,00 | 0 | |||||
| 2025-05-30 | NP | ERNZ - TrueShares Active Yield ETF | 8 773 | 113 | ||||||
| 2025-08-19 | 13F | Cape Investment Advisory, Inc. | 1 784 | 0,00 | 23 | 0,00 | ||||
| 2025-04-25 | 13F | Smallwood Wealth Investment Management, LLC | 16 | 0 | ||||||
| 2025-08-12 | 13F | Franklin Resources Inc | 772 538 | 18,27 | 9 749 | 16,06 | ||||
| 2025-07-17 | 13F | Camelot Portfolios, LLC | 61 884 | −4,18 | 781 | −6,02 | ||||
| 2025-08-14 | 13F | GWM Advisors LLC | 24 430 | 4,27 | 308 | 2,33 | ||||
| 2025-08-14 | 13F | BI Asset Management Fondsmaeglerselskab A/S | 271 547 | 11,49 | 3 | 0,00 | ||||
| 2025-07-17 | 13F | Melfa Wealth Management, Llc | 13 718 | 0,00 | 173 | −1,70 | ||||
| 2025-08-05 | 13F | Next Capital Management LLC | 725 401 | 329,02 | 9 155 | 321,07 | ||||
| 2025-08-14 | 13F | Wiley Bros.-aintree Capital, Llc | 38 624 | 17,96 | 487 | 14,32 | ||||
| 2025-07-31 | 13F | Whipplewood Advisors, LLC | 63 341 | 2 111 266,67 | 799 | −16,34 | ||||
| 2025-08-14 | 13F | Qube Research & Technologies Ltd | 0 | −100,00 | 0 | |||||
| 2025-08-13 | 13F | Guggenheim Capital Llc | 10 443 | −1,15 | 132 | −2,96 | ||||
| 2025-07-01 | 13F | Confluence Investment Management Llc | 165 155 | 84,02 | 2 084 | 80,59 |
Other Listings
| US:MFIC | 12,97 US$ |