Grundläggande statistik
| Institutionella ägare | 170 total, 170 long only, 0 short only, 0 long/short - change of 25,00% MRQ |
| Genomsnittlig portföljallokering | 1.8087 % - change of −2,11% MRQ |
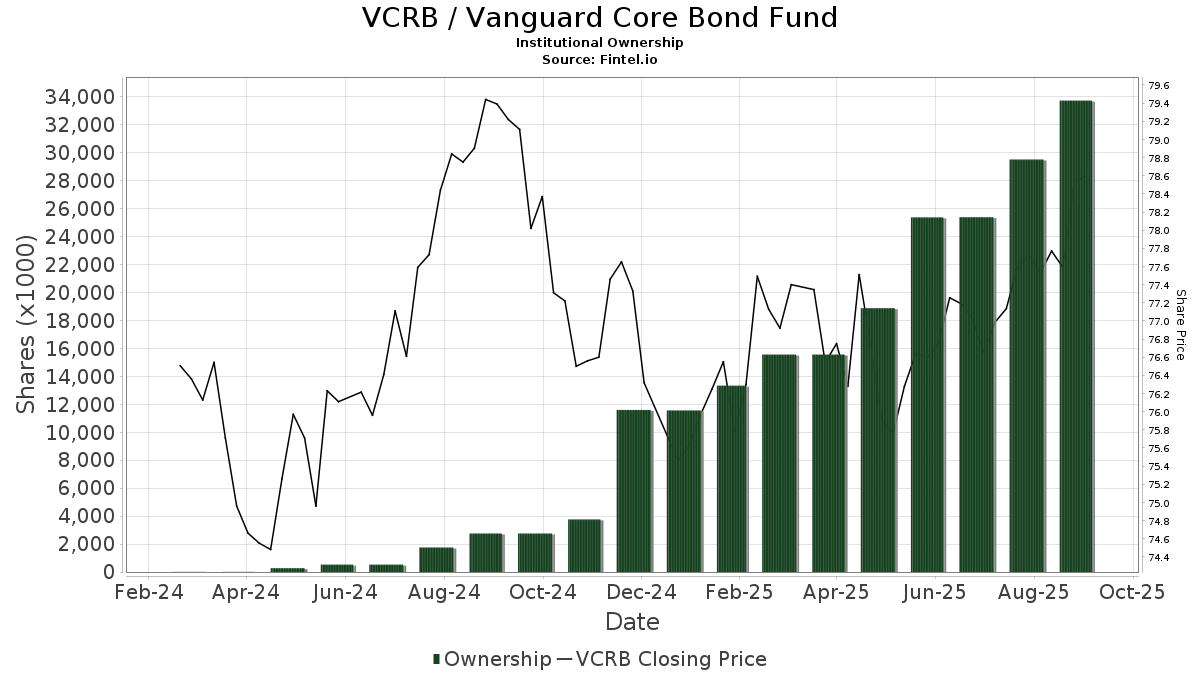
| Institutionella aktier (lång) | 33 770 576 (ex 13D/G) - change of 8,39MM shares 33,07% MRQ |
| Institutionellt värde (lång) | $ 2 491 758 USD ($1000) |
Institutionellt ägande och aktieägare
Vanguard Core Bond Fund (US:VCRB) har 170 Institutionella ägare och aktieägare som har lämnat in 13D/G- eller 13F-formulär till Securities Exchange Commission (SEC). Dessa institut innehar totalt 33,770,576 aktier. Största aktieägare inkluderar HBK Sorce Advisory LLC, Signaturefd, Llc, Martel Wealth Advisors Inc, Assetmark, Inc, Brinker Capital Investments, LLC, Orion Portfolio Solutions, LLC, Diversified Portfolios, Inc., Smith & Howard Wealth Management, LLC, BKD Wealth Advisors, LLC, and Financial Engines Advisors L.L.C. .
Vanguard Core Bond Fund (NasdaqGM:VCRB) Institutionell ägarstruktur visar institutioners och fonders nuvarande positioner i företaget, samt de senaste förändringarna i positionernas storlek. Större aktieägare kan vara enskilda investerare, fonder, hedgefonder eller institutioner. Bilaga 13D visar att investeraren äger (eller ägde) mer än 5% av företaget och avser (eller avsåg) att aktivt eftersträva en förändring av affärsstrategin. Schedule 13G indikerar en passiv investering på över 5%.
The share price as of September 11, 2025 is 78,69 / share. Previously, on September 12, 2024, the share price was 79,43 / share. This represents a decline of 0,93% over that period.
Fondsentimentets poäng
Fondsentimentet poängen(fka Ägarackumulation-poäng) visar vilka aktier som är mest köpta av fonder. Det är resultatet av en sofistikerad kvantitativ flerfaktormodell som identifierar företag med de högsta nivåerna av institutionell ackumulering. Poängsättningsmodellen använder en kombination av den totala ökningen av redovisade ägare, förändringarna i portföljallokeringarna för dessa ägare och andra mått. Siffran sträcker sig från 0 till 100, där högre siffror indikerar en högre nivå av ackumulering i förhållande till sina konkurrenter, och 50 är genomsnittet.
Uppdateringsfrekvens: Dagligen
Se Ownership Explorer, som innehåller en lista över de högst rankade företagen.
Institutionell sälj/köp-kvot
Förutom att rapportera vanliga eget kapital- och skuldemissioner måste institutioner med mer än 100MM tillgångar under förvaltning också avslöja sina innehav av sälj- och köpoptioner. Eftersom säljoptioner i allmänhet indikerar ett negativt sentiment och köpoptioner indikerar ett positivt sentiment, kan vi få en uppfattning om det övergripande institutionella sentimentet genom att plotta förhållandet mellan säljoptioner och köpoptioner. Diagrammet till höger visar det historiska förhållandet mellan sälj- och köpoptioner för detta instrument.
Genom att använda sälj/köp-kvoten som en indikator på aktieägarnas sentiment undviker man en av de största bristerna med att använda det totala institutionella ägandet, nämligen att en betydande del av de förvaltade tillgångarna investeras passivt för att följa index. Passivt förvaltade fonder köper vanligtvis inte optioner, så indikatorn för sälj/köp-kvoten ger en bättre bild av stämningen i aktivt förvaltade fonder.
13F- och NPORT-arkiveringar
Detaljer om 13F-arkiveringar är gratis. Detaljer om NP-arkiveringar kräver ett premiummedlemskap. Gröna rader indikerar nya positioner. Röda rader indikerar stängda positioner. Klicka på länk symbolen för att se hela transaktionshistoriken.
Uppgradera
för att låsa upp premiumdata och exportera till Excel ![]() .
.
| Fil Datum | Källa | Investerare | Typ | Genomsnittligt pris (beräknat) |
Aktier | Δ Aktier (%) |
Rapporterat värde (1000 USD) |
Δ Värde (%) |
Portföljallokering (%) |
|
|---|---|---|---|---|---|---|---|---|---|---|
| 2025-07-30 | 13F | Mid-American Wealth Advisory Group, Inc. | 394 | 31 | ||||||
| 2025-07-31 | 13F | Conservest Capital Advisors, Inc. | 16 869 | 1 309 | ||||||
| 2025-07-09 | 13F | Dynamic Advisor Solutions LLC | 10 550 | 29,45 | 818 | 29,64 | ||||
| 2025-08-08 | 13F | Kaizen Financial Strategies | 122 783 | 2,79 | 9 525 | 3,00 | ||||
| 2025-08-14 | 13F | Raymond James Financial Inc | 13 457 | −1,69 | 1 044 | −1,51 | ||||
| 2025-08-07 | 13F | Resources Investment Advisors, LLC. | 31 155 | 10,96 | 2 417 | 11,13 | ||||
| 2025-07-01 | 13F | Harbor Investment Advisory, Llc | 12 203 | 13,12 | 947 | 13,29 | ||||
| 2025-08-08 | 13F | D'Orazio & Associates, Inc. | 29 450 | 2 285 | ||||||
| 2025-08-14 | 13F | Ariadne Wealth Management, LP | 3 973 | 0,00 | 309 | 1,65 | ||||
| 2025-08-14 | 13F | Ancora Advisors, LLC | 328 | 25 | ||||||
| 2025-07-09 | 13F | Keystone Wealth Services, LLC | 5 093 | 43,42 | 395 | 44,16 | ||||
| 2025-07-28 | 13F | Harbour Investments, Inc. | 235 | 18 | ||||||
| 2025-07-29 | 13F | Private Trust Co Na | 1 929 | −0,98 | 150 | −0,67 | ||||
| 2025-08-07 | 13F | Meeder Advisory Services, Inc. | 331 656 | 25 730 | ||||||
| 2025-08-14 | 13F | Bank Of America Corp /de/ | 704 242 | 237,91 | 54 635 | 238,57 | ||||
| 2025-08-20 | 13F | Tull Financial Group, Inc. | 459 913 | 118,09 | 35 680 | 118,52 | ||||
| 2025-08-04 | 13F | HBK Sorce Advisory LLC | 8 213 718 | 3,21 | 637 220 | 3,41 | ||||
| 2025-08-14 | 13F | Old Mission Capital Llc | 46 105 | 3 577 | ||||||
| 2025-07-18 | 13F | Martel Wealth Advisors Inc | 1 384 604 | 2,36 | 107 418 | 2,56 | ||||
| 2025-08-14 | 13F | Aqr Capital Management Llc | 3 973 | 20,39 | 308 | 20,78 | ||||
| 2025-07-15 | 13F | Smith & Howard Wealth Management, LLC | 872 703 | 67 704 | ||||||
| 2025-05-02 | 13F | Transcendent Capital Group LLC | 0 | −100,00 | 0 | |||||
| 2025-08-14 | 13F | McIlrath & Eck, LLC | 115 743 | −5,83 | 8 979 | −5,64 | ||||
| 2025-07-31 | 13F | Schoolcraft Capital LLC | 373 229 | −7,52 | 28 955 | −7,34 | ||||
| 2025-07-15 | 13F | Signal Tree Financial Partners Llc | 15 803 | 48,40 | 1 226 | 48,67 | ||||
| 2025-07-25 | 13F | Atria Wealth Solutions, Inc. | 6 701 | −43,64 | 520 | −43,59 | ||||
| 2025-08-13 | 13F | Daner Wealth Management, LLC | 11 866 | 161,31 | 919 | 165,61 | ||||
| 2025-08-14 | 13F | EP Wealth Advisors, Inc. | 0 | −100,00 | 0 | |||||
| 2025-08-13 | 13F | Boston Family Office Llc | 55 546 | 84,27 | 4 | 100,00 | ||||
| 2025-08-15 | 13F | CI Private Wealth, LLC | 2 611 | 1,08 | 203 | 1,00 | ||||
| 2025-05-07 | 13F | Magnolia Wealth Management, LLC | 581 996 | −3,02 | 45 064 | −0,95 | ||||
| 2025-07-16 | 13F | Plancorp, LLC | 0 | −100,00 | 0 | |||||
| 2025-07-25 | 13F | BCR Wealth Strategies, LLC | 254 508 | 64,42 | 20 | 72,73 | ||||
| 2025-07-14 | 13F | Farmers Trust Co | 7 918 | 0,00 | 614 | 0,16 | ||||
| 2025-08-14 | 13F | GWM Advisors LLC | 30 300 | 7,82 | 2 351 | 8,05 | ||||
| 2025-07-17 | 13F | Enclave Advisors LLC | 33 148 | 7,09 | 2 572 | 7,30 | ||||
| 2025-08-13 | 13F | Brown Advisory Inc | 10 236 | 794 | ||||||
| 2025-07-22 | 13F | Gutierrez Wealth Advisory, LLC | 112 717 | 0,23 | 8 745 | 0,42 | ||||
| 2025-08-19 | 13F | Cape Investment Advisory, Inc. | 2 725 | 1 283,25 | 211 | 1 306,67 | ||||
| 2025-08-06 | 13F | SOUTH STATE Corp | 82 271 | −39,89 | 6 383 | −39,78 | ||||
| 2025-08-06 | 13F | Ethos Financial Group, LLC | 31 938 | 50,35 | 2 478 | 50,67 | ||||
| 2025-07-30 | 13F | Mills Wealth Advisors LLC | 387 849 | 22,58 | 30 089 | 22,82 | ||||
| 2025-08-01 | 13F | Gwn Securities Inc. | 0 | −100,00 | 0 | |||||
| 2025-05-05 | 13F | Morningstar Investment Services LLC | 297 313 | 23 | ||||||
| 2025-07-24 | 13F | Grand Wealth Management, Llc | 54 315 | 0,57 | 4 214 | 0,77 | ||||
| 2025-08-12 | 13F | Coldstream Capital Management Inc | 0 | −100,00 | 0 | |||||
| 2025-08-14 | 13F | Financial Engines Advisors L.L.C. | 825 903 | 3,61 | 64 074 | 3,81 | ||||
| 2025-07-29 | 13F | Swmg, Llc | 3 825 | −68,66 | 294 | −68,76 | ||||
| 2025-08-06 | 13F | AE Wealth Management LLC | 1 585 | −23,69 | 123 | −23,75 | ||||
| 2025-08-15 | 13F | Morgan Stanley | 1 | 0 | ||||||
| 2025-07-15 | 13F | Patriot Investment Management Inc. | 27 393 | −0,47 | 2 125 | −0,28 | ||||
| 2025-08-01 | 13F | Ashton Thomas Private Wealth, LLC | 2 718 | 211 | ||||||
| 2025-07-15 | 13F | Verum Partners LLC | 245 018 | −4,13 | 19 009 | −3,95 | ||||
| 2025-07-30 | 13F | Cornerstone Advisory, LLC | 5 766 | 3,71 | 447 | 5,18 | ||||
| 2025-05-16 | 13F | American Trust | 0 | −100,00 | 0 | −100,00 | ||||
| 2025-07-17 | 13F | Barry Investment Advisors, LLC | 73 231 | 37,77 | 5 681 | 38,06 | ||||
| 2025-08-13 | 13F | Strategic Family Wealth Counselors, L.L.C. | 63 121 | 9,84 | 4 897 | 10,05 | ||||
| 2025-07-18 | 13F | Lynx Investment Advisory | 19 557 | 7,47 | 1 517 | 7,74 | ||||
| 2025-07-15 | 13F | SJS Investment Consulting Inc. | 250 309 | 52,05 | 19 419 | 52,35 | ||||
| 2025-09-04 | 13F/A | Advisor Group Holdings, Inc. | 41 227 | 322,11 | 3 198 | 323,02 | ||||
| 2025-08-12 | 13F | Jpmorgan Chase & Co | 189 | 15 | ||||||
| 2025-07-25 | 13F | Quantum Financial Planning Services, Inc. | 342 796 | 363,98 | 26 594 | 364,93 | ||||
| 2025-08-05 | 13F | Bank Of Montreal /can/ | 0 | −100,00 | 0 | |||||
| 2025-07-21 | 13F | Keystone Financial Group, Inc. | 305 | −78,49 | 23 | −78,70 | ||||
| 2025-08-06 | 13F | Rialto Wealth Management, LLC | 3 427 | 0,00 | 266 | 0,00 | ||||
| 2025-03-12 | 13F/A | Private Capital Management Llc | 34 936 | 1 031,35 | 2 656 | 1 025,42 | ||||
| 2025-08-13 | 13F | Greenwich Wealth Management LLC | 56 823 | −32,91 | 4 | −33,33 | ||||
| 2025-07-25 | 13F | Concurrent Investment Advisors, LLC | 5 299 | 411 | ||||||
| 2025-08-04 | 13F | Atria Investments Llc | 11 544 | −48,37 | 896 | −48,30 | ||||
| 2025-07-23 | 13F | Lansing Street Advisors | 90 738 | 10,29 | 7 039 | 10,50 | ||||
| 2025-08-13 | 13F | Keystone Financial Group | 6 809 | 528 | ||||||
| 2025-05-08 | 13F | Great Valley Advisor Group, Inc. | 0 | −100,00 | 0 | |||||
| 2025-08-14 | 13F | Citadel Advisors Llc | 51 801 | 3,96 | 4 019 | 4,15 | ||||
| 2025-08-14 | 13F | Royal Bank Of Canada | 21 272 | 64,06 | 1 651 | 64,44 | ||||
| 2025-08-04 | 13F | Elite Life Management LLC | 45 173 | 1,22 | 3 505 | 1,42 | ||||
| 2025-07-21 | 13F | Ameritas Advisory Services, LLC | 781 | 61 | ||||||
| 2025-07-09 | 13F | Breakwater Investment Management | 82 930 | 475,42 | 6 434 | 476,95 | ||||
| 2025-07-23 | 13F | Penney Financial, LLC | 73 828 | 5 728 | ||||||
| 2025-08-08 | 13F | AJ Advisors, LLC | 126 686 | 8,05 | 9 828 | 8,26 | ||||
| 2025-08-15 | 13F | Kestra Advisory Services, LLC | 5 827 | 452 | ||||||
| 2025-07-14 | 13F | UMA Financial Services, Inc. | 2 483 | 0,00 | 193 | 0,00 | ||||
| 2025-08-11 | 13F | Diversified Portfolios, Inc. | 891 655 | 15,29 | 69 175 | 15,51 | ||||
| 2025-08-08 | 13F | Cetera Investment Advisers | 56 679 | 4 397 | ||||||
| 2025-07-08 | 13F | ShankerValleau Wealth Advisors, Inc. | 156 621 | 3,56 | 12 151 | 3,77 | ||||
| 2025-08-04 | 13F | Spire Wealth Management | 0 | −100,00 | 0 | |||||
| 2025-07-16 | 13F | Novem Group | 4 333 | 336 | ||||||
| 2025-08-12 | 13F | Change Path, LLC | 84 165 | 40,63 | 6 530 | 40,89 | ||||
| 2025-07-24 | 13F | Bernard Wealth Management Corp. | 12 | 0,00 | 1 | |||||
| 2025-08-06 | 13F | Nicholas Hoffman & Company, LLC. | 39 800 | 6,81 | 3 088 | 7,00 | ||||
| 2025-07-25 | 13F | LRI Investments, LLC | 2 614 | −2,35 | 203 | −2,42 | ||||
| 2025-08-12 | 13F | J.w. Cole Advisors, Inc. | 3 318 | 257 | ||||||
| 2025-08-14 | 13F | Integrated Wealth Concepts LLC | 2 861 | 222 | ||||||
| 2025-08-11 | 13F | Brown Brothers Harriman & Co | 0 | −100,00 | 0 | |||||
| 2025-08-14 | 13F | Mariner, LLC | 352 465 | 284,19 | 27 344 | 284,96 | ||||
| 2025-08-20 | 13F/A | Coppell Advisory Solutions LLC | 24 061 | 31,12 | 1 861 | 30,80 | ||||
| 2025-07-17 | 13F | San Luis Wealth Advisors LLC | 211 195 | −51,44 | 16 | −51,52 | ||||
| 2025-07-16 | 13F | Signaturefd, Llc | 4 555 932 | 29,24 | 353 449 | 29,49 | ||||
| 2025-08-07 | 13F | Tfo-tdc, Llc | 2 911 | 226 | ||||||
| 2025-08-19 | 13F | Asset Dedication, LLC | 720 | 56 | ||||||
| 2025-08-27 | 13F/A | Brinker Capital Investments, LLC | 960 085 | 7,38 | 74 483 | 7,59 | ||||
| 2025-07-28 | 13F | Cornerstone Wealth Group, LLC | 278 667 | 0,50 | 21 619 | 0,70 | ||||
| 2025-08-06 | 13F | Commonwealth Equity Services, Llc | 79 862 | 8,71 | 6 | 20,00 | ||||
| 2025-07-28 | 13F | Axxcess Wealth Management, Llc | 24 260 | −31,81 | 1 882 | −31,66 | ||||
| 2025-08-14 | 13F | Marshall Investment Management, Llc | 0 | −100,00 | 0 | |||||
| 2025-08-13 | 13F | Momentous Wealth Management, Inc. | 327 879 | 8,62 | 25 437 | 8,83 | ||||
| 2025-07-24 | 13F | KC Investment Advisors, LLC | 88 855 | −50,11 | 6 893 | −50,01 | ||||
| 2025-07-25 | 13F | Envestnet Portfolio Solutions, Inc. | 48 562 | −10,55 | 3 767 | −10,37 | ||||
| 2025-08-08 | 13F | Foundations Investment Advisors, LLC | 187 202 | 7,12 | 14 523 | 7,33 | ||||
| 2025-07-30 | 13F | Retirement Planning Group | 34 684 | −10,64 | 2 691 | −10,48 | ||||
| 2025-07-21 | 13F | Trellis Wealth Advisors LLC | 11 598 | 900 | ||||||
| 2025-05-15 | 13F/A | Orion Portfolio Solutions, LLC | 894 071 | 69 228 | ||||||
| 2025-08-14 | 13F | Bnp Paribas Arbitrage, Sa | 0 | −100,00 | 0 | |||||
| 2025-08-14 | 13F | NorthLanding Financial Partners, LLC | 117 512 | 26,19 | 9 117 | 26,44 | ||||
| 2025-04-29 | 13F | Financial Network Wealth Management LLC | 70 424 | 5 | ||||||
| 2025-08-07 | 13F | Tilson Financial Group, Inc. | 431 491 | −0,45 | 33 | 0,00 | ||||
| 2025-08-11 | 13F | NewEdge Wealth, LLC | 288 067 | 22 340 | ||||||
| 2025-08-08 | 13F | CFO4Life Group, LLC | 157 305 | 9,55 | 12 204 | 9,76 | ||||
| 2025-08-13 | 13F | Continuum Advisory, LLC | 0 | −100,00 | 0 | |||||
| 2025-08-11 | 13F | Invenio Wealth Partners Llc | 145 775 | 11 309 | ||||||
| 2025-07-15 | 13F | Hofer & Associates. Inc | 85 133 | 6 605 | ||||||
| 2025-04-29 | 13F | Proffitt & Goodson Inc | 0 | −100,00 | 0 | |||||
| 2025-07-28 | 13F | Keeler & Nadler Financial Planning & Wealth Management | 121 433 | 53,51 | 9 421 | 54,30 | ||||
| 2025-07-22 | 13F | Olistico Wealth, LLC | 2 005 | 18,36 | 156 | 18,32 | ||||
| 2025-08-11 | 13F | Principal Securities, Inc. | 120 292 | 676,68 | 9 332 | 694,89 | ||||
| 2025-07-31 | 13F | Oppenheimer & Co Inc | 3 223 | 250 | ||||||
| 2025-08-12 | 13F | O'shaughnessy Asset Management, Llc | 63 | 5 | ||||||
| 2025-07-18 | 13F | Truist Financial Corp | 102 022 | −2,80 | 7 915 | −2,62 | ||||
| 2025-08-08 | 13F | Crossmark Global Holdings, Inc. | 35 707 | 3,27 | 2 770 | 3,47 | ||||
| 2025-08-12 | 13F | Accredited Wealth Management, LLC | 1 480 | 0,00 | 115 | 0,00 | ||||
| 2025-07-10 | 13F | Compton Wealth Advisory Group, LLC | 99 301 | 31,33 | 7 704 | 31,59 | ||||
| 2025-08-13 | 13F | Victory Financial Group, Llc | 58 657 | −0,09 | 4 551 | 0,11 | ||||
| 2025-08-12 | 13F | Goepper Burkhardt LLC | 0 | −100,00 | 0 | |||||
| 2025-08-13 | 13F | GeoWealth Management, LLC | 219 | 17 | ||||||
| 2025-08-14 | 13F | Jane Street Group, Llc | 317 475 | 24 630 | ||||||
| 2025-07-02 | 13F | Dentgroup LLC | 3 536 | 274 | ||||||
| 2025-07-21 | 13F | Mendota Financial Group, LLC | 17 534 | 1 478,22 | 1 360 | 1 481,40 | ||||
| 2025-08-07 | 13F | Addison Advisors LLC | 890 | 69 | ||||||
| 2025-08-01 | 13F | Pasadena Private Wealth, LLC | 5 316 | 0,53 | 412 | 0,73 | ||||
| 2025-08-12 | 13F | Proequities, Inc. | 0 | 0 | ||||||
| 2025-08-05 | 13F | Bank of New York Mellon Corp | 25 389 | −4,79 | 1 970 | −4,60 | ||||
| 2025-08-14 | 13F | TCG Advisory Services, LLC | 390 657 | 7,99 | 30 307 | 8,20 | ||||
| 2025-08-14 | 13F | Sentinus, LLC | 24 404 | −2,03 | 1 893 | −1,82 | ||||
| 2025-08-13 | 13F | Renaissance Technologies Llc | 5 700 | 442 | ||||||
| 2025-07-14 | 13F | AdvisorNet Financial, Inc | 1 305 | 194,58 | 101 | 197,06 | ||||
| 2025-08-11 | 13F | HighTower Advisors, LLC | 177 211 | 4,38 | 13 748 | 4,58 | ||||
| 2025-07-16 | 13F | Stephenson National Bank & Trust | 657 | 22,12 | 51 | 21,95 | ||||
| 2025-07-22 | 13F | Tandem Investment Partners LLC | 77 289 | 6,81 | 5 996 | 7,01 | ||||
| 2025-08-14 | 13F | Hrt Financial Lp | 7 438 | 1 | ||||||
| 2025-07-29 | 13F | BKD Wealth Advisors, LLC | 828 445 | 70,87 | 64 271 | 71,20 | ||||
| 2025-07-29 | 13F | Chicago Partners Investment Group LLC | 107 504 | 970,33 | 8 276 | 974,81 | ||||
| 2025-08-12 | 13F | Ameritas Investment Partners, Inc. | 125 | 10 | ||||||
| 2025-07-15 | 13F | Garrett Investment Advisors LLC | 177 842 | −16,87 | 13 797 | −16,70 | ||||
| 2025-07-23 | 13F | L.K. Benson & Company, P.C. | 7 595 | 36,40 | 589 | 36,66 | ||||
| 2025-08-08 | 13F | TD Capital Management LLC | 7 629 | 198,82 | 592 | 200,00 | ||||
| 2025-07-23 | 13F | Ami Investment Management Inc | 173 405 | 13 453 | ||||||
| 2025-08-12 | 13F | LPL Financial LLC | 482 581 | 58,32 | 37 439 | 58,63 | ||||
| 2025-08-14 | 13F | Wells Fargo & Company/mn | 0 | −100,00 | 0 | |||||
| 2025-07-07 | 13F | Retirement Wealth Solutions LLC | 2 523 | 196 | ||||||
| 2025-07-29 | 13F | Signature Estate & Investment Advisors Llc | 6 257 | 485 | ||||||
| 2025-08-08 | 13F | Advyzon Investment Management, LLC | 6 685 | 519 | ||||||
| 2025-08-14 | 13F | UBS Group AG | 0 | −100,00 | 0 | |||||
| 2025-07-07 | 13F | OMNI 360 Wealth, Inc. | 67 682 | 10,15 | 5 251 | 10,36 | ||||
| 2025-07-14 | 13F | Leonard Rickey Investment Advisors P.L.L.C. | 83 641 | 8,26 | 6 489 | 10,21 | ||||
| 2025-07-25 | 13F | Hazlett, Burt & Watson, Inc. | 337 | 0 | ||||||
| 2025-07-24 | 13F | Galvin, Gaustad & Stein, LLC | 48 054 | 165,20 | 3 728 | 165,72 | ||||
| 2025-07-30 | 13F | Bogart Wealth, LLC | 48 882 | 19,08 | 3 792 | 19,32 | ||||
| 2025-08-14 | 13F | Goldman Sachs Group Inc | 58 120 | 4 509 | ||||||
| 2025-08-01 | 13F | Zhang Financial LLC | 3 778 | 36,34 | 293 | 36,92 | ||||
| 2025-07-22 | 13F | Oak Hill Wealth Advisors, Llc | 16 328 | 1 252 | ||||||
| 2025-07-11 | 13F | Orrstown Financial Services Inc | 6 333 | 491 | ||||||
| 2025-08-12 | 13F | Up Strategic Wealth Investment Advisors Llc | 80 885 | 7,45 | 6 275 | 7,67 | ||||
| 2025-08-04 | 13F | Assetmark, Inc | 1 115 767 | 743,37 | 86 561 | 745,07 | ||||
| 2025-07-24 | 13F | Jfs Wealth Advisors, Llc | 1 044 | 81 | ||||||
| 2025-07-07 | 13F | Kings Path Partners LLC | 59 200 | 116,18 | 4 593 | 116,60 | ||||
| 2025-08-05 | 13F | Mission Wealth Management, Lp | 49 838 | 23,37 | 3 866 | 23,63 | ||||
| 2025-08-14 | 13F | Mml Investors Services, Llc | 70 215 | 10,38 | 5 | 25,00 | ||||
| 2025-08-12 | 13F | Global Retirement Partners, LLC | 2 124 | 165 | ||||||
| 2025-07-31 | 13F | Topsail Wealth Management, LLC | 14 964 | 405,71 | 1 161 | 406,55 | ||||
| 2025-08-08 | 13F | Pnc Financial Services Group, Inc. | 4 255 | −6,52 | 330 | −6,25 | ||||
| 2025-08-11 | 13F | Private Advisor Group, LLC | 118 839 | 7,18 | 9 219 | 7,40 | ||||
| 2025-07-24 | 13F | IFP Advisors, Inc | 336 | −1,47 | 26 | 0,00 | ||||
| 2025-07-16 | 13F | Essex Financial Services, Inc. | 6 125 | 1,74 | 475 | 1,93 | ||||
| 2025-08-11 | 13F | Regal Investment Advisors LLC | 3 282 | 255 | ||||||
| 2025-08-04 | 13F | Savvy Advisors, Inc. | 23 265 | 1 805 | ||||||
| 2025-08-13 | 13F | Flow Traders U.s. Llc | 36 814 | 281,49 | 3 | |||||
| 2025-08-04 | 13F | Keybank National Association/oh | 0 | −100,00 | 0 | |||||
| 2025-08-01 | 13F | Envestnet Asset Management Inc | 493 456 | 5,47 | 38 282 | 5,68 | ||||
| 2025-07-28 | 13F | Baker Boyer National Bank | 3 257 | 0,00 | 253 | 0,00 | ||||
| 2025-07-31 | 13F | Cambridge Investment Research Advisors, Inc. | 75 820 | 26,93 | 6 | 25,00 |