Grundläggande statistik
| Institutionella ägare | 262 total, 262 long only, 0 short only, 0 long/short - change of −2,60% MRQ |
| Genomsnittlig portföljallokering | 0.1357 % - change of −12,23% MRQ |
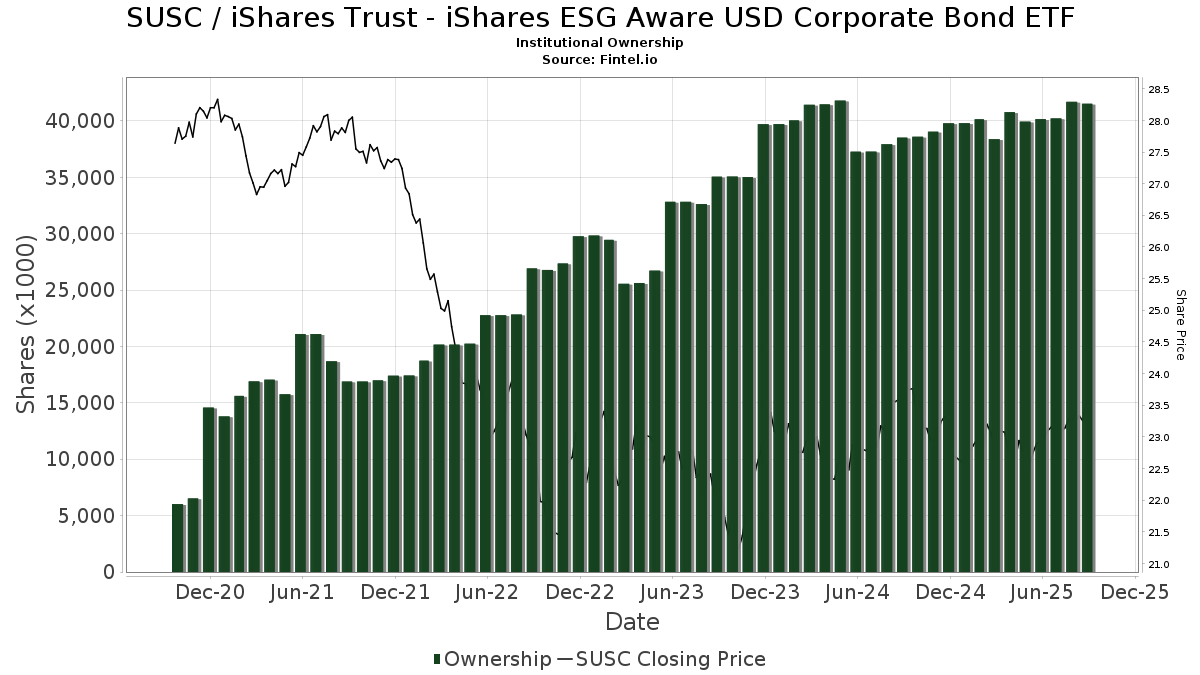
| Institutionella aktier (lång) | 41 519 507 (ex 13D/G) - change of 1,30MM shares 3,23% MRQ |
| Institutionellt värde (lång) | $ 847 178 USD ($1000) |
Institutionellt ägande och aktieägare
iShares Trust - iShares ESG Aware USD Corporate Bond ETF (US:SUSC) har 262 Institutionella ägare och aktieägare som har lämnat in 13D/G- eller 13F-formulär till Securities Exchange Commission (SEC). Dessa institut innehar totalt 41,519,507 aktier. Största aktieägare inkluderar Envestnet Asset Management Inc, Jpmorgan Chase & Co, Wealthfront Advisers Llc, LPL Financial LLC, Envestnet Portfolio Solutions, Inc., Ameriprise Financial Inc, Betterment LLC, Creative Planning, Fisher Asset Management, LLC, and Acorns Advisers, LLC .
iShares Trust - iShares ESG Aware USD Corporate Bond ETF (NasdaqGM:SUSC) Institutionell ägarstruktur visar institutioners och fonders nuvarande positioner i företaget, samt de senaste förändringarna i positionernas storlek. Större aktieägare kan vara enskilda investerare, fonder, hedgefonder eller institutioner. Bilaga 13D visar att investeraren äger (eller ägde) mer än 5% av företaget och avser (eller avsåg) att aktivt eftersträva en förändring av affärsstrategin. Schedule 13G indikerar en passiv investering på över 5%.
The share price as of September 12, 2025 is 23,65 / share. Previously, on September 16, 2024, the share price was 23,92 / share. This represents a decline of 1,13% over that period.
Fondsentimentets poäng
Fondsentimentet poängen(fka Ägarackumulation-poäng) visar vilka aktier som är mest köpta av fonder. Det är resultatet av en sofistikerad kvantitativ flerfaktormodell som identifierar företag med de högsta nivåerna av institutionell ackumulering. Poängsättningsmodellen använder en kombination av den totala ökningen av redovisade ägare, förändringarna i portföljallokeringarna för dessa ägare och andra mått. Siffran sträcker sig från 0 till 100, där högre siffror indikerar en högre nivå av ackumulering i förhållande till sina konkurrenter, och 50 är genomsnittet.
Uppdateringsfrekvens: Dagligen
Se Ownership Explorer, som innehåller en lista över de högst rankade företagen.
Institutionell sälj/köp-kvot
Förutom att rapportera vanliga eget kapital- och skuldemissioner måste institutioner med mer än 100MM tillgångar under förvaltning också avslöja sina innehav av sälj- och köpoptioner. Eftersom säljoptioner i allmänhet indikerar ett negativt sentiment och köpoptioner indikerar ett positivt sentiment, kan vi få en uppfattning om det övergripande institutionella sentimentet genom att plotta förhållandet mellan säljoptioner och köpoptioner. Diagrammet till höger visar det historiska förhållandet mellan sälj- och köpoptioner för detta instrument.
Genom att använda sälj/köp-kvoten som en indikator på aktieägarnas sentiment undviker man en av de största bristerna med att använda det totala institutionella ägandet, nämligen att en betydande del av de förvaltade tillgångarna investeras passivt för att följa index. Passivt förvaltade fonder köper vanligtvis inte optioner, så indikatorn för sälj/köp-kvoten ger en bättre bild av stämningen i aktivt förvaltade fonder.
13F- och NPORT-arkiveringar
Detaljer om 13F-arkiveringar är gratis. Detaljer om NP-arkiveringar kräver ett premiummedlemskap. Gröna rader indikerar nya positioner. Röda rader indikerar stängda positioner. Klicka på länk symbolen för att se hela transaktionshistoriken.
Uppgradera
för att låsa upp premiumdata och exportera till Excel ![]() .
.
| Fil Datum | Källa | Investerare | Typ | Genomsnittligt pris (beräknat) |
Aktier | Δ Aktier (%) |
Rapporterat värde (1000 USD) |
Δ Värde (%) |
Portföljallokering (%) |
|
|---|---|---|---|---|---|---|---|---|---|---|
| 2025-07-22 | 13F | Stanich Group LLC | 0 | −100,00 | 0 | |||||
| 2025-07-14 | 13F | Occidental Asset Management, LLC | 15 100 | 0,17 | 351 | 0,86 | ||||
| 2025-04-23 | 13F | Walkner Condon Financial Advisors LLC | 0 | −100,00 | 0 | |||||
| 2025-07-24 | 13F | Morton Brown Family Wealth, LLC | 7 101 | 2,22 | 165 | 2,50 | ||||
| 2025-07-15 | 13F | Mather Group, Llc. | 0 | −100,00 | 0 | |||||
| 2025-07-14 | 13F | U.S. Capital Wealth Advisors, LLC | 15 877 | 10,10 | 369 | 10,84 | ||||
| 2025-07-25 | 13F | Community Bank, N.A. | 146 | 0,00 | 3 | 0,00 | ||||
| 2025-07-16 | 13F | Evergreen Private Wealth LLC | 20 460 | 12,66 | 475 | 13,64 | ||||
| 2025-07-15 | 13F | Level Financial Advisors, Inc. | 13 190 | 2,13 | 306 | 3,03 | ||||
| 2025-08-14 | 13F | Susquehanna International Group, Llp | 32 344 | 751 | ||||||
| 2025-08-11 | 13F | Wealthgarden F.s. Llc | 12 873 | 0,03 | 298 | 0,34 | ||||
| 2025-08-14 | 13F | Goldman Sachs Group Inc | 0 | −100,00 | 0 | |||||
| 2025-07-21 | 13F | Ascent Group, LLC | 31 998 | 9,85 | 743 | 10,73 | ||||
| 2025-08-08 | 13F | Kingsview Wealth Management, LLC | 8 900 | −0,48 | 207 | 0,00 | ||||
| 2025-07-24 | 13F | JB Capital LLC | 18 806 | 20,54 | 437 | 21,45 | ||||
| 2025-07-31 | 13F | Buckingham Strategic Partners | 22 315 | 1,24 | 518 | 1,97 | ||||
| 2025-08-14 | 13F | Wharton Business Group, LLC | 10 045 | 0,00 | 0 | |||||
| 2025-07-09 | 13F | Beacon Financial Group | 22 127 | −0,08 | 514 | 0,78 | ||||
| 2025-07-18 | 13F | SigFig Wealth Management, LLC | 87 472 | 17,15 | 2 022 | 17,69 | ||||
| 2025-07-23 | 13F | Venturi Wealth Management, LLC | 23 943 | −3,45 | 556 | −2,63 | ||||
| 2025-07-09 | 13F | Finley Financial, LLC | 10 850 | 0,00 | 252 | 1,20 | ||||
| 2025-08-07 | 13F | Allworth Financial LP | 122 615 | −8,51 | 2 848 | −6,90 | ||||
| 2025-08-13 | 13F | Transce3nd, LLC | 2 293 | 13,46 | 53 | 15,22 | ||||
| 2025-07-25 | 13F | Envestnet Portfolio Solutions, Inc. | 1 909 893 | 0,57 | 44 367 | 1,31 | ||||
| 2025-08-15 | 13F | Captrust Financial Advisors | 19 358 | −0,02 | 450 | 0,67 | ||||
| 2025-08-08 | 13F | Creative Planning | 1 159 353 | 3,60 | 26 932 | 4,37 | ||||
| 2025-07-29 | 13F | Two West Capital Advisors LLC | 10 588 | 245 | ||||||
| 2025-08-05 | 13F | Scarborough Advisors, LLC | 1 135 | 26 | ||||||
| 2025-08-07 | 13F | Payden & Rygel | 35 557 | 0,00 | 1 | |||||
| 2025-08-19 | 13F | Advisory Services Network, LLC | 59 628 | −0,80 | 1 380 | −0,43 | ||||
| 2025-07-25 | 13F | Cwm, Llc | 638 278 | 18,67 | 15 | 16,67 | ||||
| 2025-07-30 | 13F | Crewe Advisors LLC | 861 | 2,26 | 20 | 5,26 | ||||
| 2025-07-23 | 13F | 1 North Wealth Services Llc | 545 | 0,00 | 13 | 0,00 | ||||
| 2025-07-17 | 13F | LexAurum Advisors, LLC | 14 569 | −1,22 | 338 | −0,59 | ||||
| 2025-04-08 | 13F | Parallel Advisors, LLC | 0 | −100,00 | 0 | |||||
| 2025-04-21 | 13F | ORG Partners LLC | 0 | −100,00 | 0 | |||||
| 2025-08-12 | 13F | BlackRock, Inc. | 6 153 | 15,18 | 143 | 15,45 | ||||
| 2025-08-14 | 13F | Financial Advisory Service, Inc. | 613 | 1,16 | 14 | 7,69 | ||||
| 2025-04-22 | 13F | Veridan Wealth LLC | 9 938 | −25,37 | 229 | −24,42 | ||||
| 2025-08-11 | 13F | United Capital Financial Advisers, Llc | 142 194 | 16,76 | 3 303 | 17,63 | ||||
| 2025-08-11 | 13F | Copperleaf Capital, LLC | 8 743 | 0,00 | 203 | 1,00 | ||||
| 2025-07-24 | 13F | Endeavor Private Wealth, Inc. | 9 638 | 224 | ||||||
| 2025-08-14 | 13F | Mercer Global Advisors Inc /adv | 33 596 | 1,12 | 780 | 1,83 | ||||
| 2025-07-08 | 13F | Rise Advisors, LLC | 683 | 1,19 | 16 | 0,00 | ||||
| 2025-08-05 | 13F | McGinn Investment Management, Inc. | 0 | −100,00 | 0 | |||||
| 2025-08-06 | 13F | AE Wealth Management LLC | 11 288 | 21,83 | 262 | 23,00 | ||||
| 2025-05-13 | 13F | Brooklyn FI, LLC | 0 | −100,00 | 0 | −100,00 | ||||
| 2025-08-05 | 13F | Tme Financial, Inc. | 9 943 | −4,62 | 231 | −4,17 | ||||
| 2025-08-04 | 13F | Savvy Advisors, Inc. | 14 036 | 4,51 | 326 | 5,50 | ||||
| 2025-08-12 | 13F | Archer Investment Corp | 639 | 0,00 | 15 | 0,00 | ||||
| 2025-07-03 | 13F | Higgins & Schmidt Wealth Strategies LLC | 14 146 | 14,83 | 329 | 15,49 | ||||
| 2025-07-11 | 13F/A | Umb Bank N A/mo | 25 729 | 0,00 | 598 | 0,67 | ||||
| 2025-08-12 | 13F | MAI Capital Management | 4 532 | 4,09 | 105 | 5,00 | ||||
| 2025-08-14 | 13F | Benjamin Edwards Inc | 11 824 | −3,89 | 275 | −3,18 | ||||
| 2025-04-04 | 13F | Quent Capital, LLC | 0 | −100,00 | 0 | |||||
| 2025-08-08 | 13F | Pnc Financial Services Group, Inc. | 3 460 | 0,70 | 80 | 1,27 | ||||
| 2025-08-05 | 13F | Claro Advisors LLC | 0 | −100,00 | 0 | |||||
| 2025-08-13 | 13F | Townsquare Capital Llc | 0 | −100,00 | 0 | |||||
| 2025-07-09 | 13F | Affinity Capital Advisors, LLC | 64 119 | −8,93 | 1 489 | −5,70 | ||||
| 2025-07-23 | 13F | Sax Wealth Advisors, Llc | 9 885 | 4,77 | 230 | 5,53 | ||||
| 2025-08-01 | 13F | Envestnet Asset Management Inc | 8 401 421 | 12,41 | 195 165 | 13,24 | ||||
| 2025-07-16 | 13F | MBE Wealth Management, LLC | 22 835 | 0,18 | 530 | 0,95 | ||||
| 2025-08-14 | 13F | Mml Investors Services, Llc | 416 390 | 13,33 | 10 | 12,50 | ||||
| 2025-08-13 | 13F | Rockport Wealth LLC | 10 127 | 0,00 | 235 | 0,86 | ||||
| 2025-08-14 | 13F | Fiduciary Trust Co | 64 189 | 1,45 | 1 491 | 2,19 | ||||
| 2025-08-29 | 13F | Evolution Wealth Management Inc. | 1 390 | 32 | ||||||
| 2025-08-06 | 13F | Hoxton Planning & Management, LLC | 21 819 | 4,06 | 507 | 4,76 | ||||
| 2025-08-14 | 13F | LifePlan Investment Advisors, Inc. | 44 654 | 14,81 | 1 037 | 15,74 | ||||
| 2025-07-25 | 13F | Wells Financial Advisors INC | 22 345 | 0,00 | 519 | 0,78 | ||||
| 2025-08-12 | 13F | Steward Partners Investment Advisory, Llc | 59 867 | 11,04 | 1 391 | 11,83 | ||||
| 2025-07-24 | 13F | Jfs Wealth Advisors, Llc | 10 198 | 8,95 | 237 | 9,77 | ||||
| 2025-08-05 | 13F | Centennial Bank/AR/ | 600 | 0,00 | 14 | 0,00 | ||||
| 2025-08-14 | 13F | Guardian Wealth Advisors, Llc / Nc | 2 700 | 8,65 | 63 | 8,77 | ||||
| 2025-07-24 | 13F | MA Private Wealth | 30 670 | 0,00 | 712 | 0,71 | ||||
| 2025-07-22 | 13F | Merit Financial Group, LLC | 59 829 | 52,17 | 1 390 | 53,31 | ||||
| 2025-07-28 | 13F | Axxcess Wealth Management, Llc | 9 584 | 223 | ||||||
| 2025-08-18 | 13F | Geneos Wealth Management Inc. | 1 027 | 24 | ||||||
| 2025-08-13 | 13F | Gateway Wealth Partners, LLC | 9 335 | 7,47 | 217 | 8,00 | ||||
| 2025-08-13 | 13F | EverSource Wealth Advisors, LLC | 37 882 | 11,91 | 880 | 12,69 | ||||
| 2025-07-17 | 13F | One Wealth Advisors, LLC | 303 743 | 13,61 | 7 056 | 14,44 | ||||
| 2025-08-14 | 13F | Diversify Advisory Services, LLC | 31 724 | −16,90 | 738 | −16,06 | ||||
| 2025-07-30 | 13F | Nottingham Advisors, Inc. | 12 254 | 9,07 | 285 | 9,65 | ||||
| 2025-07-10 | 13F | Marshall Financial Group LLC | 10 969 | 5,84 | 253 | 5,88 | ||||
| 2025-08-11 | 13F | Annis Gardner Whiting Capital Advisors, LLC | 730 | −9,43 | 17 | −11,11 | ||||
| 2025-08-11 | 13F | HighTower Advisors, LLC | 53 475 | −0,68 | 1 242 | 0,08 | ||||
| 2025-08-15 | 13F | Blue Edge Capital, LLC | 25 154 | −12,15 | 584 | −11,52 | ||||
| 2025-04-15 | 13F | McKinley Carter Wealth Services, Inc. | 0 | −100,00 | 0 | |||||
| 2025-07-21 | 13F | Stock Yards Bank & Trust Co | 30 550 | 0,00 | 710 | 0,71 | ||||
| 2025-08-13 | 13F | WCG Wealth Advisors LLC | 0 | −100,00 | 0 | |||||
| 2025-08-07 | 13F | PFG Advisors | 25 059 | −0,61 | 582 | 0,17 | ||||
| 2025-08-14 | 13F | Royal Bank Of Canada | 420 023 | 5,78 | 9 758 | 6,57 | ||||
| 2025-07-25 | 13F | NorthRock Partners, LLC | 2 801 | 29,38 | 65 | 32,65 | ||||
| 2025-08-11 | 13F | Birchbrook, Inc. | 67 059 | 10,19 | 1 558 | 10,98 | ||||
| 2025-08-06 | 13F | Long Run Wealth Advisors, LLC | 144 808 | 1,23 | 3 364 | 1,97 | ||||
| 2025-08-13 | 13F/A | StoneX Group Inc. | 11 500 | −23,33 | 264 | −24,36 | ||||
| 2025-07-09 | 13F | Dynamic Advisor Solutions LLC | 17 581 | −12,50 | 408 | −11,88 | ||||
| 2025-05-15 | 13F/A | Orion Portfolio Solutions, LLC | 32 753 | 11,56 | 755 | 13,19 | ||||
| 2025-07-31 | 13F | Richards, Merrill & Peterson, Inc. | 0 | −100,00 | 0 | |||||
| 2025-08-05 | 13F | Bank Of Montreal /can/ | 2 | 0 | ||||||
| 2025-07-21 | 13F | Empirical Financial Services, LLC d.b.a. Empirical Wealth Management | 43 617 | 8,39 | 1 013 | 9,28 | ||||
| 2025-08-11 | 13F | Theory Financial Llc | 41 235 | 23,42 | 954 | 23,90 | ||||
| 2025-08-13 | 13F | Kilter Group LLC | 817 | 19 | ||||||
| 2025-08-15 | 13F | Morgan Stanley | 800 296 | −17,71 | 18 591 | −17,11 | ||||
| 2025-08-11 | 13F | FSC Wealth Advisors, LLC | 1 260 | 0,00 | 29 | 0,00 | ||||
| 2025-08-11 | 13F | Eq Llc | 16 599 | 13,27 | 386 | 14,24 | ||||
| 2025-09-04 | 13F | ZynergyRetirementPlanningLLC | 0 | −100,00 | 0 | |||||
| 2025-08-12 | 13F | Ameritas Investment Partners, Inc. | 34 960 | −2,89 | 812 | −2,17 | ||||
| 2025-07-10 | 13F | IMPACTfolio, LLC | 465 893 | 3,93 | 10 823 | 4,69 | ||||
| 2025-08-12 | 13F | Barings Llc | 147 173 | −85,42 | 3 419 | −85,32 | ||||
| 2025-07-23 | 13F | Prime Capital Investment Advisors, LLC | 0 | −100,00 | 0 | |||||
| 2025-08-13 | 13F | Maia Wealth LLC | 17 959 | 21,70 | 417 | 25,60 | ||||
| 2025-07-21 | 13F | Ameriflex Group, Inc. | 2 632 | −5,73 | 61 | −6,25 | ||||
| 2025-08-12 | 13F | Choate Investment Advisors | 162 | 4 | ||||||
| 2025-08-14 | 13F | Comerica Bank | 12 160 | 8,53 | 282 | 9,30 | ||||
| 2025-07-31 | 13F | Wealthfront Advisers Llc | 3 040 474 | 16,33 | 70 630 | 17,18 | ||||
| 2025-07-14 | 13F | Park Avenue Securities Llc | 594 111 | 15,66 | 14 | 18,18 | ||||
| 2025-08-08 | 13F | Emerald Investment Partners, Llc | 39 723 | −1,61 | 923 | −0,97 | ||||
| 2025-07-10 | 13F | Oliver Lagore Vanvalin Investment Group | 2 745 | −3,04 | 63 | −1,56 | ||||
| 2025-07-17 | 13F | Halbert Hargrove Global Advisors, Llc | 6 118 | 0,00 | 142 | 0,71 | ||||
| 2025-07-31 | 13F | Cambridge Investment Research Advisors, Inc. | 228 573 | 4,30 | 5 | 0,00 | ||||
| 2025-07-08 | 13F | Braun-Bostich & Associates Inc. | 15 165 | 6,69 | 352 | 7,65 | ||||
| 2025-08-13 | 13F | Twin Peaks Wealth Advisors, LLC | 3 711 | 86 | ||||||
| 2025-07-25 | 13F | Atria Wealth Solutions, Inc. | 25 445 | −87,14 | 591 | −87,07 | ||||
| 2025-08-14 | 13F | McIlrath & Eck, LLC | 153 | 0,00 | 4 | 0,00 | ||||
| 2025-04-23 | 13F | Williams Financial, LLC | 0 | −100,00 | 0 | |||||
| 2025-08-14 | 13F | Ameriprise Financial Inc | 1 649 800 | −4,07 | 38 306 | −3,42 | ||||
| 2025-08-14 | 13F | Gen-Wealth Partners Inc | 1 588 | 21,69 | 37 | 20,00 | ||||
| 2025-08-26 | 13F/A | Thrivent Financial For Lutherans | 21 755 | −86,91 | 1 | −100,00 | ||||
| 2025-07-14 | 13F | Buttonwood Financial Group, LLC | 24 965 | 10,10 | 575 | 12,99 | ||||
| 2025-05-14 | 13F | Jane Street Group, Llc | 0 | −100,00 | 0 | |||||
| 2025-07-24 | 13F | Eastern Bank | 7 701 | −83,89 | 179 | −83,85 | ||||
| 2025-07-15 | 13F | Retirement Income Solutions, Inc | 10 842 | −26,48 | 252 | −26,18 | ||||
| 2025-08-11 | 13F | Aptus Capital Advisors, LLC | 2 905 | 7,99 | 67 | 8,06 | ||||
| 2025-05-08 | 13F | Us Financial Advisors, Llc | 22 235 | 13,32 | 513 | 15,06 | ||||
| 2025-08-14 | 13F | Bnp Paribas Arbitrage, Sa | 61 | 306,67 | 1 | |||||
| 2025-08-06 | 13F | Capasso Planning Partners LLC | 12 623 | 0,29 | 293 | 1,03 | ||||
| 2025-08-12 | 13F | WealthTrak Capital Management LLC | 1 586 | 0,00 | 37 | 0,00 | ||||
| 2025-07-24 | 13F | Us Bancorp \de\ | 851 | −15,24 | 20 | −17,39 | ||||
| 2025-08-07 | 13F | LFA - Lugano Financial Advisors SA | 0 | −100,00 | 0 | |||||
| 2025-08-13 | 13F | Flow Traders U.s. Llc | 31 674 | 1 | ||||||
| 2025-07-17 | 13F | Janney Montgomery Scott LLC | 150 984 | 58,81 | 4 | 50,00 | ||||
| 2025-08-14 | 13F | Colony Group, LLC | 11 909 | −14,43 | 277 | −13,75 | ||||
| 2025-07-11 | 13F | My Legacy Advisors, LLC | 10 521 | −13,90 | 243 | −13,88 | ||||
| 2025-07-28 | 13F | RFG Advisory, LLC | 54 432 | 13,98 | 1 264 | 14,80 | ||||
| 2025-08-14 | 13F | Raymond James Financial Inc | 203 956 | 4,33 | 4 738 | 5,08 | ||||
| 2025-07-10 | 13F | Charter Oak Capital Management, LLC | 72 304 | −5,68 | 1 680 | −4,98 | ||||
| 2025-07-07 | 13F | Bangor Savings Bank | 370 | 0,00 | 9 | 0,00 | ||||
| 2025-08-14 | 13F | Wells Fargo & Company/mn | 411 712 | −0,26 | 9 564 | 0,48 | ||||
| 2025-07-10 | 13F | Sharkey, Howes & Javer | 158 858 | 23,19 | 3 690 | 24,12 | ||||
| 2025-07-22 | 13F | Macroview Investment Management Llc | 11 491 | 267 | ||||||
| 2025-08-08 | 13F | Cetera Investment Advisers | 757 729 | 17,29 | 17 602 | 18,16 | ||||
| 2025-07-25 | 13F | Concurrent Investment Advisors, LLC | 12 990 | 302 | ||||||
| 2025-07-29 | 13F | Horst & Graben Wealth Management LLC | 172 120 | 7,44 | 3 998 | 8,23 | ||||
| 2025-07-11 | 13F | Farther Finance Advisors, LLC | 38 687 | 2,35 | 899 | 3,22 | ||||
| 2025-08-12 | 13F | LPL Financial LLC | 2 396 363 | 25,65 | 55 668 | 26,58 | ||||
| 2025-08-13 | 13F | Capital Analysts, Inc. | 14 091 | 23,98 | 0 | |||||
| 2025-08-14 | 13F | Stifel Financial Corp | 37 931 | 30,24 | 881 | 31,30 | ||||
| 2025-07-15 | 13F | Carr Financial Group Corp | 13 627 | 1,11 | 317 | 1,94 | ||||
| 2025-07-18 | 13F/A | MJT & Associates Financial Advisory Group, Inc. | 580 | −30,62 | 13 | −31,58 | ||||
| 2025-05-02 | 13F | Whittier Trust Co Of Nevada Inc | 0 | −100,00 | 0 | |||||
| 2025-07-18 | 13F | Trilogy Capital Inc. | 42 861 | 1,25 | 996 | 1,95 | ||||
| 2025-08-06 | 13F | Wedbush Securities Inc | 14 967 | 11,14 | 0 | |||||
| 2025-07-16 | 13F | Diversified Enterprises, LLC | 24 948 | 39,48 | 580 | 40,53 | ||||
| 2025-07-15 | 13F | Spectrum Planning & Advisory Services Inc. | 18 943 | −2,16 | 440 | −1,35 | ||||
| 2025-07-25 | 13F | Midwest Capital Advisors, LLC | 6 613 | 0,00 | 154 | 0,66 | ||||
| 2025-07-24 | 13F | Blair William & Co/il | 10 468 | 0,39 | 243 | 1,25 | ||||
| 2025-08-12 | 13F | Proequities, Inc. | 0 | 0 | ||||||
| 2025-08-06 | 13F | Savant Capital, LLC | 201 748 | −3,84 | 4 687 | −3,12 | ||||
| 2025-07-07 | 13F | Life Line Wealth Management Llc | 10 788 | −6,93 | 251 | −6,37 | ||||
| 2025-08-13 | 13F | First Trust Advisors Lp | 13 747 | 319 | ||||||
| 2025-08-08 | 13F | Larson Financial Group LLC | 15 280 | 1,11 | 355 | 1,72 | ||||
| 2025-08-14 | 13F | Financial Engines Advisors L.L.C. | 256 098 | −13,40 | 5 949 | −12,76 | ||||
| 2025-08-13 | 13F | M&t Bank Corp | 0 | −100,00 | 0 | |||||
| 2025-08-13 | 13F | Continuum Advisory, LLC | 25 944 | 1,32 | 603 | 2,03 | ||||
| 2025-08-11 | 13F | Regal Investment Advisors LLC | 18 559 | 11,18 | 431 | 12,24 | ||||
| 2025-08-01 | 13F | Rossby Financial, LCC | 122 917 | −10,35 | 2 855 | −9,13 | ||||
| 2025-08-06 | 13F | Modera Wealth Management, LLC | 11 494 | 0,00 | 267 | 0,75 | ||||
| 2025-08-13 | 13F | Fisher Asset Management, LLC | 1 018 357 | 3,17 | 23 656 | 3,93 | ||||
| 2025-07-28 | 13F | Sagespring Wealth Partners, Llc | 13 586 | −8,99 | 316 | −8,43 | ||||
| 2025-08-07 | 13F | Kestra Private Wealth Services, Llc | 16 825 | 0,71 | 391 | 1,30 | ||||
| 2025-07-21 | 13F | Patriot Financial Group Insurance Agency, LLC | 13 446 | −3,92 | 312 | −3,11 | ||||
| 2025-07-28 | 13F | Harbour Investments, Inc. | 13 583 | −2,45 | 316 | −1,87 | ||||
| 2025-08-08 | 13F | ERTS Wealth Advisors, LLC | 0 | −100,00 | 0 | |||||
| 2025-08-25 | 13F | Hilltop Partners LLC | 0 | −100,00 | 0 | |||||
| 2025-08-14 | 13F | Hilltop Holdings Inc. | 0 | −100,00 | 0 | |||||
| 2025-07-24 | 13F | JNBA Financial Advisors | 48 237 | −6,90 | 1 121 | −6,20 | ||||
| 2025-04-30 | 13F | Sofos Investments, Inc. | 6 223 | −56,91 | 144 | −56,40 | ||||
| 2025-07-16 | 13F | Perigon Wealth Management, LLC | 214 019 | 7,19 | 4 972 | 7,97 | ||||
| 2025-07-08 | 13F | Gradient Investments LLC | 31 496 | −16,63 | 732 | −16,07 | ||||
| 2025-08-14 | 13F | Mariner, LLC | 27 496 | 24,85 | 639 | 25,84 | ||||
| 2025-08-14 | 13F | Wiley Bros.-aintree Capital, Llc | 14 726 | 95,15 | 348 | 61,86 | ||||
| 2025-08-08 | 13F | Wealth Alliance | 30 114 | −7,30 | 700 | −6,68 | ||||
| 2025-07-24 | 13F | IFP Advisors, Inc | 1 173 | −64,44 | 27 | −64,47 | ||||
| 2025-08-13 | 13F | Milestone Investment Advisors LLC | 3 000 | 0,00 | 70 | 0,00 | ||||
| 2025-07-23 | 13F | Nbt Bank N A /ny | 1 142 | 0,00 | 27 | 0,00 | ||||
| 2025-08-12 | 13F | CIBC Private Wealth Group, LLC | 86 | 0,00 | 2 | 0,00 | ||||
| 2025-07-10 | 13F | Sovran Advisors, LLC | 0 | −100,00 | 0 | |||||
| 2025-07-25 | 13F | Keener Financial Planning LLC | 8 668 | 0,38 | 0 | |||||
| 2025-08-14 | 13F | Bragg Financial Advisors, Inc | 16 350 | −5,01 | 380 | −4,29 | ||||
| 2025-07-30 | 13F | Wbh Advisory Inc | 9 264 | 215 | ||||||
| 2025-08-14 | 13F | Fmr Llc | 740 268 | 25,32 | 17 196 | 26,25 | ||||
| 2025-07-16 | 13F | St Germain D J Co Inc | 3 345 | −60,54 | 78 | −60,51 | ||||
| 2025-07-17 | 13F | Neumann Capital Management, LLC | 26 950 | −1,19 | 626 | −0,32 | ||||
| 2025-07-23 | 13F | Peak Financial Management, Inc. | 19 535 | 6,61 | 454 | 7,35 | ||||
| 2025-04-01 | 13F | Massmutual Trust Co Fsb/adv | 0 | −100,00 | 0 | |||||
| 2025-08-13 | 13F | SageView Advisory Group, LLC | 24 026 | −7,24 | 555 | −7,20 | ||||
| 2025-07-21 | 13F | Ameritas Advisory Services, LLC | 4 178 | 97 | ||||||
| 2025-07-29 | 13F | Private Wealth Management Group, LLC | 45 938 | −1,38 | 1 067 | −0,65 | ||||
| 2025-08-11 | 13F | Sofi Wealth, Llc | 25 618 | 75,98 | 595 | 77,61 | ||||
| 2025-07-25 | 13F | Ruedi Wealth Management, Inc. | 0 | −100,00 | 0 | |||||
| 2025-07-25 | 13F | We Are One Seven, LLC | 44 716 | 15,56 | 1 039 | 16,37 | ||||
| 2025-08-13 | 13F | Baker Avenue Asset Management, LP | 9 583 | −5,81 | 223 | −5,13 | ||||
| 2025-08-04 | 13F | Pensionmark Financial Group, Llc | 42 815 | 9,62 | 995 | 10,44 | ||||
| 2025-07-11 | 13F | Colorado Capital Management, Inc. | 193 635 | −5,99 | 4 | 0,00 | ||||
| 2025-07-21 | 13F | Barrett & Company, Inc. | 58 | 0,00 | 1 | 0,00 | ||||
| 2025-08-15 | 13F | CI Private Wealth, LLC | 23 480 | 0,24 | 545 | 0,93 | ||||
| 2025-08-13 | 13F | Mount Yale Investment Advisors, LLC | 3 110 | 72 | ||||||
| 2025-08-12 | 13F | SRS Capital Advisors, Inc. | 68 | −2,86 | 2 | 0,00 | ||||
| 2025-08-08 | 13F | Avantax Advisory Services, Inc. | 45 002 | 12,74 | 1 045 | 13,59 | ||||
| 2025-08-13 | 13F | Hsbc Holdings Plc | 95 283 | −1,59 | 2 213 | −0,85 | ||||
| 2025-08-12 | 13F | Investor's Fiduciary Advisor Network, LLC | 59 742 | −25,83 | 1 | 0,00 | ||||
| 2025-08-01 | 13F | Redwood Park Advisors LLC | 0 | −100,00 | 0 | |||||
| 2025-08-27 | 13F/A | Brinker Capital Investments, LLC | 44 494 | 35,85 | 1 034 | 36,82 | ||||
| 2025-05-14 | 13F | Retirement Capital Strategies | 0 | −100,00 | 0 | |||||
| 2025-07-23 | 13F | Dohj, Llc | 116 644 | −32,96 | 2 642 | −34,17 | ||||
| 2025-08-01 | 13F | Facet Wealth, Inc. | 102 345 | 2,44 | 2 369 | 4,46 | ||||
| 2025-08-11 | 13F | Cornerstone Planning Group LLC | 0 | −100,00 | 0 | |||||
| 2025-08-06 | 13F | Golden State Wealth Management, LLC | 17 451 | −4,46 | 405 | −3,80 | ||||
| 2025-08-04 | 13F | Assetmark, Inc | 260 161 | 10,44 | 6 044 | 11,25 | ||||
| 2025-04-30 | 13F | Stratos Wealth Advisors, LLC | 0 | −100,00 | 0 | −100,00 | ||||
| 2025-08-05 | 13F | Bank of New York Mellon Corp | 295 410 | −1,01 | 6 862 | −0,28 | ||||
| 2025-08-01 | 13F | Cobblestone Capital Advisors Llc /ny/ | 17 881 | 4,32 | 415 | 5,06 | ||||
| 2025-08-01 | 13F | Schmidt P J Investment Management Inc | 51 072 | 2,48 | 1 186 | 3,22 | ||||
| 2025-07-16 | 13F | Vision Capital Management, Inc. | 50 006 | 2,63 | 1 162 | 3,38 | ||||
| 2025-07-17 | 13F | Tempus Wealth Planning, LLC | 22 272 | 25,34 | 517 | 26,41 | ||||
| 2025-08-06 | 13F | Summit Wealth Group, LLC | 82 296 | −1,10 | 2 | 0,00 | ||||
| 2025-08-11 | 13F | Principal Securities, Inc. | 6 794 | −6,85 | 158 | −4,85 | ||||
| 2025-08-15 | 13F | High Falls Advisors, Inc | 0 | −100,00 | 0 | |||||
| 2025-08-07 | 13F | Topel & Distasi Wealth Management, LLC | 83 960 | 5,37 | 1 950 | 6,15 | ||||
| 2025-09-04 | 13F/A | Advisor Group Holdings, Inc. | 131 958 | 32,07 | 3 062 | 32,86 | ||||
| 2025-07-23 | 13F | Proffitt & Goodson Inc | 20 341 | −1,73 | 473 | −1,05 | ||||
| 2025-08-04 | 13F | Atria Investments Llc | 15 118 | 26,27 | 351 | 27,17 | ||||
| 2025-08-14 | 13F | CoreCap Advisors, LLC | 1 804 | 0,00 | 42 | 0,00 | ||||
| 2025-07-09 | 13F | Lifelong Wealth Advisors, Inc. | 22 610 | 17,93 | 525 | 18,78 | ||||
| 2025-05-19 | 13F/A | Advisory Alpha, LLC | 0 | −100,00 | 0 | −100,00 | ||||
| 2025-08-07 | 13F | Resources Investment Advisors, LLC. | 163 438 | 10,83 | 3 797 | 11,65 | ||||
| 2025-08-07 | 13F | Keystone Financial Services | 22 866 | 1,92 | 531 | 2,71 | ||||
| 2025-08-14 | 13F | UBS Group AG | 376 758 | 0,04 | 8 752 | 0,78 | ||||
| 2025-08-12 | 13F | Global Retirement Partners, LLC | 4 576 | −3,28 | 106 | −0,93 | ||||
| 2025-08-01 | 13F | Austin Private Wealth, LLC | 43 334 | 17,64 | 1 007 | 18,49 | ||||
| 2025-08-14 | 13F | Aprio Wealth Management, LLC | 28 720 | 13,80 | 667 | 14,80 | ||||
| 2025-08-06 | 13F | First Horizon Advisors, Inc. | 23 384 | 112,18 | 543 | 113,78 | ||||
| 2025-08-11 | 13F | CFS Investment Advisory Services, LLC | 10 076 | 6,86 | 0 | |||||
| 2025-08-08 | 13F | Financial Gravity Companies, Inc. | 5 322 | −19,56 | 124 | −18,00 | ||||
| 2025-05-12 | 13F | Independent Advisor Alliance | 0 | −100,00 | 0 | |||||
| 2025-07-15 | 13F | Oregon Pacific Wealth Management, LLC | 29 761 | −1,95 | 691 | −1,14 | ||||
| 2025-07-07 | 13F | Capital Asset Advisory Services LLC | 9 584 | 222 | ||||||
| 2025-08-12 | 13F | Marshall & Sterling Wealth Advisors Inc. | 2 167 | 15,14 | 50 | 16,28 | ||||
| 2025-07-17 | 13F | Willow Creek Wealth Management Inc. | 34 237 | −1,80 | 795 | −1,00 | ||||
| 2025-08-11 | 13F | Citigroup Inc | 3 864 | −7,52 | 90 | −7,29 | ||||
| 2025-07-30 | 13F | Strategic Blueprint, LLC | 11 147 | −24,65 | 259 | −24,34 | ||||
| 2025-08-04 | 13F | Creative Financial Designs Inc /adv | 9 246 | −13,27 | 215 | −12,65 | ||||
| 2025-07-23 | 13F | Vontobel Holding Ltd. | 71 739 | 0,20 | 1 667 | 0,91 | ||||
| 2025-08-13 | 13F | Acorns Advisers, LLC | 926 699 | −13,11 | 22 | −12,50 | ||||
| 2025-08-12 | 13F | Putnam Fl Investment Management Co | 193 177 | 0,36 | 4 488 | 1,10 | ||||
| 2025-08-11 | 13F | Private Advisor Group, LLC | 9 454 | 220 | ||||||
| 2025-05-02 | 13F | Invera Wealth Advisors, LLC | 232 333 | 2,52 | 5 358 | 4,02 | ||||
| 2025-08-13 | 13F | Elios Financial Group Inc. | 59 823 | −1,41 | 1 390 | −0,71 | ||||
| 2025-07-07 | 13F | Wesbanco Bank Inc | 148 213 | 3,54 | 3 443 | 4,30 | ||||
| 2025-07-22 | 13F | Miracle Mile Advisors, LLC | 263 766 | 83,01 | 6 127 | 84,38 | ||||
| 2025-07-30 | 13F | Whittier Trust Co | 9 240 | 0,00 | 215 | 0,94 | ||||
| 2025-08-14 | 13F | Betterment LLC | 1 419 635 | 14,87 | 33 | 14,29 | ||||
| 2025-08-05 | 13F | GPS Wealth Strategies Group, LLC | 3 281 | 0,40 | 76 | 1,33 | ||||
| 2025-08-13 | 13F | Van Hulzen Asset Management, LLC | 34 308 | 0,00 | 797 | 0,63 | ||||
| 2025-08-06 | 13F | Commonwealth Equity Services, Llc | 184 347 | 2,58 | 4 | 0,00 | ||||
| 2025-08-15 | 13F | Equitable Holdings, Inc. | 160 868 | 14,40 | 3 737 | 15,24 | ||||
| 2025-08-06 | 13F | One Wealth Capital Management, Llc | 35 284 | 22,20 | 820 | 23,16 | ||||
| 2025-07-28 | 13F | Mutual Advisors, LLC | 48 795 | −0,63 | 1 128 | 0,27 | ||||
| 2025-07-10 | 13F | Focus Financial Network, Inc. | 16 991 | −7,08 | 395 | −6,41 | ||||
| 2025-05-14 | 13F | CIBC World Markets Inc. | 0 | −100,00 | 0 | |||||
| 2025-07-31 | 13F | Schneider Downs Wealth Management Advisors, LP | 36 619 | 22,55 | 851 | 23,37 | ||||
| 2025-07-30 | 13F | Brookstone Capital Management | 73 372 | −4,82 | 1 704 | −4,11 | ||||
| 2025-08-14 | 13F | Citadel Advisors Llc | 0 | −100,00 | 0 | |||||
| 2025-07-10 | 13F | Global Financial Private Client, LLC | 0 | −100,00 | 0 | |||||
| 2025-07-25 | 13F | Sequoia Financial Advisors, LLC | 43 475 | −10,96 | 1 010 | −10,31 | ||||
| 2025-04-28 | 13F | Fedenia Advisers LLC | 0 | −100,00 | 0 | |||||
| 2025-04-23 | 13F | Financial Life Planners | 0 | −100,00 | 0 | |||||
| 2025-07-10 | 13F | Klaas Financial Asset Advisors, LLC | 156 401 | 1,16 | 3 633 | 1,91 | ||||
| 2025-08-14 | 13F | Bank Of America Corp /de/ | 360 944 | 2,05 | 8 385 | 2,81 | ||||
| 2025-07-14 | 13F | UMA Financial Services, Inc. | 799 | 1,14 | 19 | 0,00 | ||||
| 2025-05-14 | 13F | Oarsman Capital, Inc. | 0 | −100,00 | 0 | |||||
| 2025-07-15 | 13F | North Star Investment Management Corp. | 980 | 257,66 | 23 | 266,67 | ||||
| 2025-08-13 | 13F | Jones Financial Companies Lllp | 23 228 | 14,48 | 537 | 14,99 | ||||
| 2025-08-14 | 13F/A | Rockefeller Capital Management L.P. | 10 854 | −0,40 | 252 | 0,40 | ||||
| 2025-08-14 | 13F | GWM Advisors LLC | 87 097 | 1,72 | 2 023 | 2,48 | ||||
| 2025-08-06 | 13F | Adviser Investments LLC | 12 415 | −31,18 | 288 | −30,77 | ||||
| 2025-05-16 | 13F | Coppell Advisory Solutions LLC | 0 | −100,00 | 0 | |||||
| 2025-07-18 | 13F | Truist Financial Corp | 24 906 | 8,37 | 579 | 9,26 | ||||
| 2025-08-14 | 13F | Integrated Wealth Concepts LLC | 40 130 | 36,63 | 932 | 37,67 | ||||
| 2025-08-13 | 13F | Rsm Us Wealth Management Llc | 24 465 | −33,07 | 568 | −32,54 | ||||
| 2025-07-29 | 13F | Mattson Financial Services, LLC | 0 | −100,00 | 0 | |||||
| 2025-05-16 | 13F/A | Kestra Investment Management, LLC | 0 | −100,00 | 0 | |||||
| 2025-08-01 | 13F | American Financial & Tax Strategies Inc | 14 765 | 28,30 | 343 | 29,06 | ||||
| 2025-08-13 | 13F | GeoWealth Management, LLC | 100 640 | 42,24 | 2 338 | 43,29 | ||||
| 2025-08-12 | 13F | Jpmorgan Chase & Co | 3 879 448 | 5,72 | 90 120 | 6,49 | ||||
| 2025-07-15 | 13F | Five Pine Wealth Management | 12 755 | 1,67 | 296 | 2,42 | ||||
| 2025-04-22 | 13F | Manning & Napier Advisors Llc | 0 | −100,00 | 0 | −100,00 |