Grundläggande statistik
| Institutionella ägare | 173 total, 173 long only, 0 short only, 0 long/short - change of 0,00% MRQ |
| Genomsnittlig portföljallokering | 0.2010 % - change of −11,91% MRQ |
| Institutionella aktier (lång) | 10 050 819 (ex 13D/G) - change of −0,21MM shares −2,05% MRQ |
| Institutionellt värde (lång) | $ 506 248 USD ($1000) |
Institutionellt ägande och aktieägare
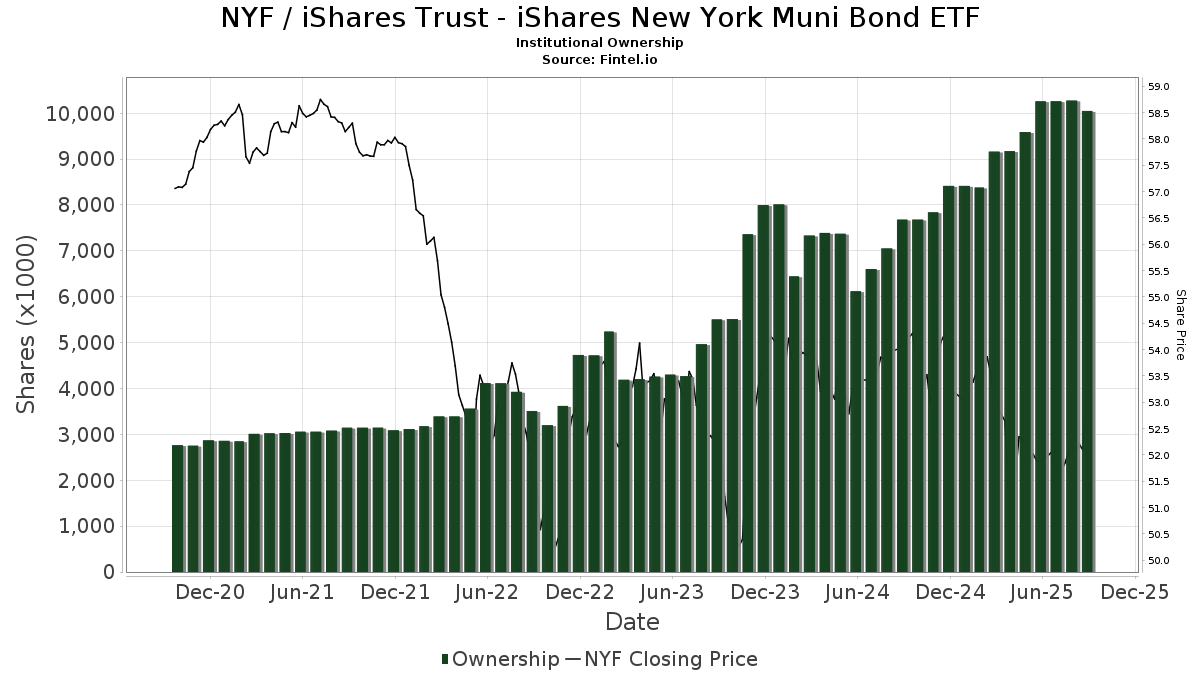
iShares Trust - iShares New York Muni Bond ETF (US:NYF) har 173 Institutionella ägare och aktieägare som har lämnat in 13D/G- eller 13F-formulär till Securities Exchange Commission (SEC). Dessa institut innehar totalt 10,050,819 aktier. Största aktieägare inkluderar Tiaa Trust, National Association, High Probability Advisors, LLC, Bank Of America Corp /de/, Morgan Stanley, Fmr Llc, Facet Wealth, Inc., HighTower Advisors, LLC, Adviser Investments LLC, Jane Street Group, Llc, and Satovsky Asset Management Llc .
iShares Trust - iShares New York Muni Bond ETF (ARCA:NYF) Institutionell ägarstruktur visar institutioners och fonders nuvarande positioner i företaget, samt de senaste förändringarna i positionernas storlek. Större aktieägare kan vara enskilda investerare, fonder, hedgefonder eller institutioner. Bilaga 13D visar att investeraren äger (eller ägde) mer än 5% av företaget och avser (eller avsåg) att aktivt eftersträva en förändring av affärsstrategin. Schedule 13G indikerar en passiv investering på över 5%.
The share price as of September 10, 2025 is 53,03 / share. Previously, on September 11, 2024, the share price was 54,20 / share. This represents a decline of 2,16% over that period.
Fondsentimentets poäng
Fondsentimentet poängen(fka Ägarackumulation-poäng) visar vilka aktier som är mest köpta av fonder. Det är resultatet av en sofistikerad kvantitativ flerfaktormodell som identifierar företag med de högsta nivåerna av institutionell ackumulering. Poängsättningsmodellen använder en kombination av den totala ökningen av redovisade ägare, förändringarna i portföljallokeringarna för dessa ägare och andra mått. Siffran sträcker sig från 0 till 100, där högre siffror indikerar en högre nivå av ackumulering i förhållande till sina konkurrenter, och 50 är genomsnittet.
Uppdateringsfrekvens: Dagligen
Se Ownership Explorer, som innehåller en lista över de högst rankade företagen.
Institutionell sälj/köp-kvot
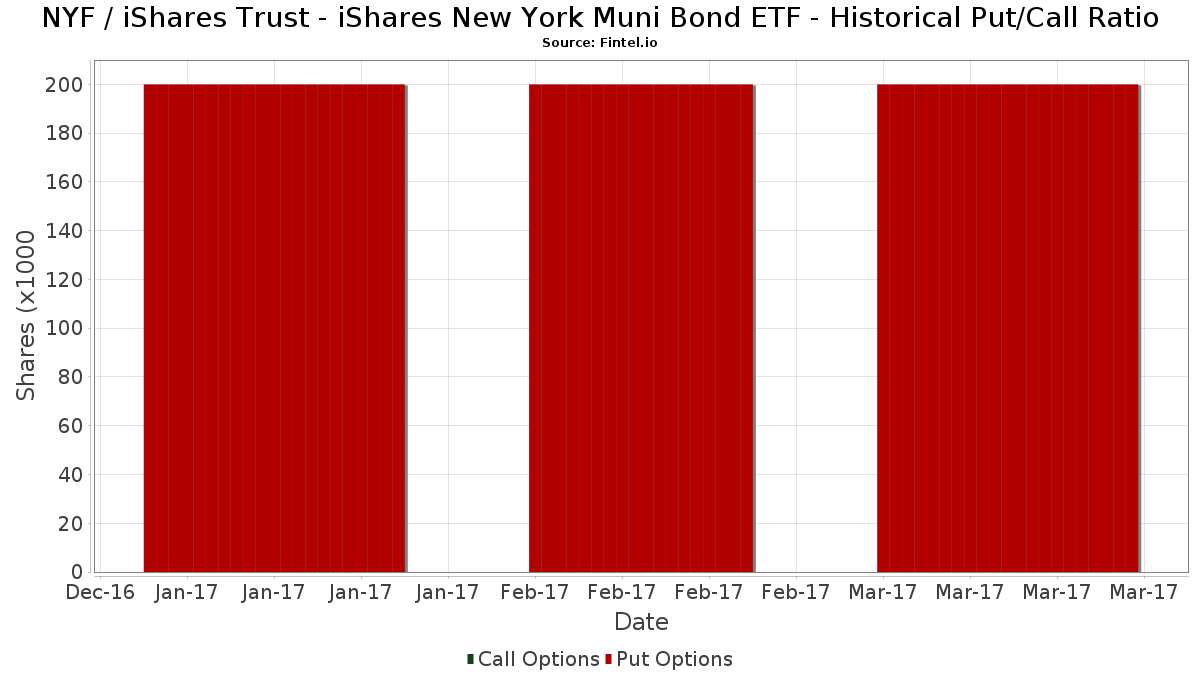
Förutom att rapportera vanliga eget kapital- och skuldemissioner måste institutioner med mer än 100MM tillgångar under förvaltning också avslöja sina innehav av sälj- och köpoptioner. Eftersom säljoptioner i allmänhet indikerar ett negativt sentiment och köpoptioner indikerar ett positivt sentiment, kan vi få en uppfattning om det övergripande institutionella sentimentet genom att plotta förhållandet mellan säljoptioner och köpoptioner. Diagrammet till höger visar det historiska förhållandet mellan sälj- och köpoptioner för detta instrument.
Genom att använda sälj/köp-kvoten som en indikator på aktieägarnas sentiment undviker man en av de största bristerna med att använda det totala institutionella ägandet, nämligen att en betydande del av de förvaltade tillgångarna investeras passivt för att följa index. Passivt förvaltade fonder köper vanligtvis inte optioner, så indikatorn för sälj/köp-kvoten ger en bättre bild av stämningen i aktivt förvaltade fonder.
13F- och NPORT-arkiveringar
Detaljer om 13F-arkiveringar är gratis. Detaljer om NP-arkiveringar kräver ett premiummedlemskap. Gröna rader indikerar nya positioner. Röda rader indikerar stängda positioner. Klicka på länk symbolen för att se hela transaktionshistoriken.
Uppgradera
för att låsa upp premiumdata och exportera till Excel ![]() .
.
| Fil Datum | Källa | Investerare | Typ | Genomsnittligt pris (beräknat) |
Aktier | Δ Aktier (%) |
Rapporterat värde (1000 USD) |
Δ Värde (%) |
Portföljallokering (%) |
|
|---|---|---|---|---|---|---|---|---|---|---|
| 2025-08-12 | 13F | Deutsche Bank Ag\ | 3 329 | −10,39 | 174 | −11,28 | ||||
| 2025-08-08 | 13F | Creative Planning | 68 226 | 30,56 | 3 557 | 29,30 | ||||
| 2025-07-15 | 13F | North Star Investment Management Corp. | 7 050 | 0,00 | 368 | −1,08 | ||||
| 2025-07-15 | 13F | Level Financial Advisors, Inc. | 39 770 | 11,60 | 2 074 | 10,50 | ||||
| 2025-07-22 | 13F | Stanich Group LLC | 0 | −100,00 | 0 | |||||
| 2025-07-31 | 13F | CNB Bank | 5 482 | 0,00 | 286 | −1,04 | ||||
| 2025-08-07 | 13F | Cascade Financial Partners, LLC | 58 225 | 0,00 | 3 036 | −0,98 | ||||
| 2025-08-13 | 13F | Wealthedge Investment Advisors, Llc | 0 | −100,00 | 0 | |||||
| 2025-08-14 | 13F | Integrated Wealth Concepts LLC | 5 188 | 0,74 | 271 | −0,37 | ||||
| 2025-07-16 | 13F | Independent Wealth Network Inc. | 7 420 | 0,05 | 387 | −1,03 | ||||
| 2025-07-31 | 13F | Cambridge Investment Research Advisors, Inc. | 20 397 | 101,49 | 1 | |||||
| 2025-08-14 | 13F | Atomi Financial Group, Inc. | 17 069 | 27,06 | 890 | 25,74 | ||||
| 2025-07-08 | 13F | 21 West Wealth Management LLC | 4 761 | 248 | ||||||
| 2025-08-07 | 13F | Brio Consultants, LLC | 7 171 | 11,65 | 374 | 10,36 | ||||
| 2025-05-14 | 13F | Citizens Business Bank | 0 | −100,00 | 0 | |||||
| 2025-07-11 | 13F | Westfuller Advisors, LLC | 13 752 | 0,74 | 717 | −0,14 | ||||
| 2025-07-15 | 13F | Mather Group, Llc. | 0 | −100,00 | 0 | |||||
| 2025-08-14 | 13F | Stifel Financial Corp | 12 983 | 0,71 | 677 | −0,29 | ||||
| 2025-07-08 | 13F | Parallel Advisors, LLC | 28 | 0,00 | 1 | 0,00 | ||||
| 2025-08-14 | 13F | EP Wealth Advisors, Inc. | 9 910 | −20,94 | 517 | −21,70 | ||||
| 2025-07-17 | 13F | Dopkins Wealth Management, Llc | 4 477 | 233 | ||||||
| 2025-08-04 | 13F | Assetmark, Inc | 65 516 | −7,16 | 3 416 | −8,05 | ||||
| 2025-07-25 | 13F | McNamara Financial Services, Inc. | 10 214 | 0,00 | 533 | −0,93 | ||||
| 2025-07-30 | 13F | Durante & Waters, Llc | 44 050 | −0,27 | 2 297 | −1,25 | ||||
| 2025-08-05 | 13F | Tiaa Trust, National Association | 858 675 | −13,16 | 44 771 | −14,00 | ||||
| 2025-08-12 | 13F | Coldstream Capital Management Inc | 0 | −100,00 | 0 | |||||
| 2025-08-14 | 13F | Citadel Advisors Llc | 13 015 | 679 | ||||||
| 2025-07-21 | 13F | Hudson Valley Investment Advisors Inc /adv | 9 700 | −3,48 | 506 | −4,54 | ||||
| 2025-08-05 | 13F | J. W. Coons Advisors, LLC | 4 000 | 0,00 | 209 | −0,95 | ||||
| 2025-08-08 | 13F | Francis Financial, Inc. | 45 343 | −74,97 | 2 364 | −75,21 | ||||
| 2025-08-12 | 13F | Proequities, Inc. | 0 | 0 | ||||||
| 2025-05-06 | 13F | Goodwin Investment Advisory | 0 | −100,00 | 0 | |||||
| 2025-07-29 | 13F | Members Advisory Group LLC | 19 692 | 7,35 | 1 027 | 6,32 | ||||
| 2025-09-04 | 13F/A | Advisor Group Holdings, Inc. | 52 781 | −38,91 | 2 752 | −39,49 | ||||
| 2025-08-06 | 13F | Rialto Wealth Management, LLC | 402 | 28,85 | 21 | 25,00 | ||||
| 2025-08-11 | 13F | Conquis Financial Llc | 25 354 | 179,94 | 1 322 | 177,52 | ||||
| 2025-08-08 | 13F | Gts Securities Llc | 5 076 | 265 | ||||||
| 2025-07-14 | 13F | Opal Wealth Advisors, LLC | 15 033 | 8,62 | 784 | 7,55 | ||||
| 2025-07-14 | 13F | GAMMA Investing LLC | 8 286 | −2,54 | 432 | −3,36 | ||||
| 2025-04-11 | 13F | First Affirmative Financial Network | 4 450 | 234 | ||||||
| 2025-07-17 | 13F | Keystone Global Partners, LLC | 5 225 | 20,50 | 272 | 19,30 | ||||
| 2025-08-14 | 13F | Royal Bank Of Canada | 10 225 | 5,25 | 533 | 4,10 | ||||
| 2025-07-31 | 13F | Buckingham Strategic Partners | 4 477 | 233 | ||||||
| 2025-07-02 | 13F | Dentgroup LLC | 5 634 | 294 | ||||||
| 2025-07-10 | 13F | Wealth Enhancement Advisory Services, Llc | 13 617 | −6,94 | 709 | −8,05 | ||||
| 2025-04-01 | 13F | Massmutual Trust Co Fsb/adv | 0 | −100,00 | 0 | |||||
| 2025-07-29 | 13F | Stratos Wealth Partners, LTD. | 8 868 | 462 | ||||||
| 2025-08-15 | 13F | Kestra Advisory Services, LLC | 42 451 | 607,63 | 2 213 | 602,54 | ||||
| 2025-08-14 | 13F | Graney & King, LLC | 4 539 | −5,44 | 237 | −6,35 | ||||
| 2025-08-11 | 13F | Wealthspire Advisors, LLC | 19 686 | −57,41 | 1 026 | −57,83 | ||||
| 2025-08-04 | 13F | Creative Financial Designs Inc /adv | 2 223 | 0,05 | 116 | −1,71 | ||||
| 2025-08-14 | 13F | Two Sigma Securities, Llc | 3 864 | 201 | ||||||
| 2025-08-06 | 13F | Long Run Wealth Advisors, LLC | 10 520 | 0,15 | 549 | −0,90 | ||||
| 2025-08-07 | 13F | Fidelis Capital Partners, LLC | 7 290 | 0,00 | 380 | 0,26 | ||||
| 2025-05-14 | 13F | Susquehanna International Group, Llp | 0 | −100,00 | 0 | |||||
| 2025-08-14 | 13F | AllSquare Wealth Management LLC | 4 219 | −8,46 | 220 | −9,50 | ||||
| 2025-08-14 | 13F | Fairview Capital Investment Management, Llc | 0 | −100,00 | 0 | |||||
| 2025-07-23 | 13F | Sax Wealth Advisors, Llc | 0 | −100,00 | 0 | |||||
| 2025-08-14 | 13F | Marshall Investment Management, Llc | 0 | −100,00 | 0 | |||||
| 2025-07-16 | 13F | TCI Wealth Advisors, Inc. | 18 698 | 0,00 | 975 | −1,02 | ||||
| 2025-08-29 | 13F | Centaurus Financial, Inc. | 3 237 | 0 | ||||||
| 2025-04-10 | 13F | Lmcg Investments, Llc | 0 | −100,00 | 0 | −100,00 | ||||
| 2025-08-12 | 13F | O'shaughnessy Asset Management, Llc | 10 204 | 20,25 | 532 | 19,28 | ||||
| 2025-08-05 | 13F | Astra Wealth Partners LLC | 5 438 | −30,23 | 284 | −30,98 | ||||
| 2025-08-11 | 13F | Bell Investment Advisors, Inc | 8 926 | 0,73 | 465 | −0,21 | ||||
| 2025-08-07 | 13F | Allworth Financial LP | 19 474 | −1,35 | 1 015 | −0,78 | ||||
| 2025-04-23 | 13F | Spire Wealth Management | 0 | −100,00 | 0 | |||||
| 2025-07-21 | 13F | Empirical Financial Services, LLC d.b.a. Empirical Wealth Management | 9 581 | 500 | ||||||
| 2025-08-14 | 13F | Fmr Llc | 406 868 | 21,47 | 21 214 | 20,29 | ||||
| 2025-08-06 | 13F | Commonwealth Equity Services, Llc | 85 566 | 46,22 | 4 | 33,33 | ||||
| 2025-08-15 | 13F | CI Private Wealth, LLC | 22 007 | 26,59 | 1 147 | 25,36 | ||||
| 2025-08-01 | 13F | Equita Financial Network, Inc. | 23 069 | −24,79 | 1 203 | −25,53 | ||||
| 2025-08-14 | 13F | UBS Group AG | 125 921 | 4,00 | 6 566 | 3,00 | ||||
| 2025-07-15 | 13F | Farrell Financial LLC | 15 504 | −25,43 | 808 | −26,14 | ||||
| 2025-07-16 | 13F | St Germain D J Co Inc | 7 093 | −3,30 | 370 | −4,40 | ||||
| 2025-08-14 | 13F | Mercer Global Advisors Inc /adv | 14 761 | −49,46 | 770 | −49,97 | ||||
| 2025-08-14 | 13F | Ameriprise Financial Inc | 48 711 | −49,61 | 2 513 | −50,64 | ||||
| 2025-08-14 | 13F | Goldman Sachs Group Inc | 73 378 | 2,30 | 3 826 | 1,30 | ||||
| 2025-08-14 | 13F | Alliancebernstein L.p. | 88 879 | 2,94 | 4 634 | 1,94 | ||||
| 2025-07-14 | 13F | Conrad Siegel Investment Advisors, Inc. | 24 438 | 22,43 | 1 274 | 21,33 | ||||
| 2025-07-18 | 13F | SOA Wealth Advisors, LLC. | 49 768 | 82,18 | 2 595 | 80,39 | ||||
| 2025-05-15 | 13F | Lido Advisors, LLC | 0 | −100,00 | 0 | −100,00 | ||||
| 2025-08-14 | 13F | First Foundation Advisors | 27 065 | 1 411 | ||||||
| 2025-08-07 | 13F | Hennion & Walsh Asset Management, Inc. | 75 952 | 9,28 | 3 960 | 8,23 | ||||
| 2025-07-23 | 13F | Stephen J. Garry & Associates, Llc | 4 110 | 0,00 | 214 | −0,93 | ||||
| 2025-08-06 | 13F | Middleton & Co Inc/ma | 0 | −100,00 | 0 | |||||
| 2025-07-17 | 13F | LifeGoal Wealth Advisors | 17 510 | 8,37 | 913 | 7,29 | ||||
| 2025-08-14 | 13F | Sei Investments Co | 11 623 | −14,28 | 606 | −15,01 | ||||
| 2025-07-16 | 13F | Magnus Financial Group LLC | 33 128 | 35,99 | 1 727 | 34,71 | ||||
| 2025-08-01 | 13F | Envestnet Asset Management Inc | 205 163 | 4,83 | 10 697 | 3,82 | ||||
| 2025-07-02 | 13F | Boston Standard Wealth Management, LLC | 6 895 | 8,29 | 360 | 5,88 | ||||
| 2025-07-24 | 13F | IFP Advisors, Inc | 1 689 | 0,18 | 88 | 0,00 | ||||
| 2025-07-31 | 13F | Wealthfront Advisers Llc | 10 848 | −11,71 | 566 | −12,54 | ||||
| 2025-08-05 | 13F | Crestwood Advisors Group LLC | 7 333 | 0,00 | 382 | −1,04 | ||||
| 2025-08-06 | 13F | Wsfs Capital Management, Llc | 7 226 | −9,75 | 377 | −10,69 | ||||
| 2025-05-15 | 13F/A | Orion Portfolio Solutions, LLC | 10 111 | 0,00 | 532 | −1,12 | ||||
| 2025-07-09 | 13F | Alesco Advisors Llc | 292 550 | −10,54 | 15 254 | −11,41 | ||||
| 2025-07-25 | 13F | Atria Wealth Solutions, Inc. | 25 559 | 26,82 | 1 332 | 25,54 | ||||
| 2025-07-14 | 13F | Signature Securities Group Corporation | 16 085 | 2,69 | 839 | 1,70 | ||||
| 2025-07-17 | 13F | Paradigm Financial Partners, Llc | 6 371 | −6,53 | 332 | −7,26 | ||||
| 2025-08-05 | 13F | W.G. Shaheen & Associates DBA Whitney & Co | 11 544 | 1,99 | 602 | 1,01 | ||||
| 2025-08-08 | 13F | Altfest L J & Co Inc | 111 430 | 16,53 | 5 810 | 15,40 | ||||
| 2025-08-14 | 13F | Wells Fargo & Company/mn | 55 381 | 2,98 | 2 888 | 1,98 | ||||
| 2025-08-13 | 13F | Cerity Partners LLC | 9 518 | 0,00 | 496 | −1,00 | ||||
| 2025-08-14 | 13F | Mml Investors Services, Llc | 24 270 | 9,01 | 1 | 0,00 | ||||
| 2025-08-15 | 13F | Captrust Financial Advisors | 6 265 | 327 | ||||||
| 2025-08-11 | 13F | Brown Brothers Harriman & Co | 166 | 0,00 | 9 | 0,00 | ||||
| 2025-04-16 | 13F | New Century Financial Group, LLC | 0 | −100,00 | 0 | |||||
| 2025-07-18 | 13F | Northeast Financial Group, Inc. | 5 414 | −9,45 | 282 | −10,19 | ||||
| 2025-08-13 | 13F | Baird Financial Group, Inc. | 0 | −100,00 | 0 | |||||
| 2025-07-09 | 13F | High Probability Advisors, LLC | 668 495 | 5,09 | 34 855 | 4,07 | ||||
| 2025-08-06 | 13F | Adviser Investments LLC | 353 480 | 0,95 | 18 430 | −0,03 | ||||
| 2025-08-12 | 13F | Nemes Rush Group LLC | 3 930 | 0,74 | 205 | −0,49 | ||||
| 2025-08-01 | 13F | Facet Wealth, Inc. | 392 537 | 5,80 | 20 400 | 5,56 | ||||
| 2025-08-11 | 13F | Citigroup Inc | 15 430 | 165,12 | 805 | 162,75 | ||||
| 2025-07-22 | 13F | Sutton Place Investors Llc | 7 539 | −10,95 | 393 | −11,69 | ||||
| 2025-08-13 | 13F | Jones Financial Companies Lllp | 5 186 | 293,77 | 270 | 289,86 | ||||
| 2025-08-13 | 13F | American Investment Services, Inc. | 4 925 | 0,00 | 257 | −1,16 | ||||
| 2025-07-24 | 13F | Drucker Wealth 3.0, LLC | 26 700 | 42,63 | 1 391 | 41,12 | ||||
| 2025-07-29 | 13F | Private Trust Co Na | 2 018 | 0,00 | 105 | −0,94 | ||||
| 2025-08-11 | 13F | HighTower Advisors, LLC | 382 305 | −10,81 | 19 933 | −11,67 | ||||
| 2025-07-29 | 13F | Stratos Wealth Advisors, LLC | 16 808 | 0,00 | 876 | −0,90 | ||||
| 2025-08-08 | 13F | Pnc Financial Services Group, Inc. | 1 976 | 5 711,76 | 103 | 10 200,00 | ||||
| 2025-08-13 | 13F | Flow Traders U.s. Llc | 26 274 | 439,62 | 1 | |||||
| 2025-08-12 | 13F | Global Retirement Partners, LLC | 0 | −100,00 | 0 | |||||
| 2025-08-13 | 13F | Hsbc Holdings Plc | 282 000 | −0,48 | 14 703 | −1,45 | ||||
| 2025-07-22 | 13F | Relyea Zuckerberg Hanson LLC | 0 | −100,00 | 0 | |||||
| 2025-08-11 | 13F | Arrow Financial Corp | 86 275 | −2,74 | 4 498 | −3,68 | ||||
| 2025-08-15 | 13F | Morgan Stanley | 455 538 | −10,05 | 23 752 | −10,92 | ||||
| 2025-08-06 | 13F | Quadrant Private Wealth Management, LLC | 4 793 | 250 | ||||||
| 2025-08-13 | 13F | Satovsky Asset Management Llc | 328 830 | −0,88 | 17 145 | −1,84 | ||||
| 2025-07-23 | 13F | Eagle Rock Investment Company, Llc | 10 000 | 66,67 | 521 | 65,40 | ||||
| 2025-08-07 | 13F | King Luther Capital Management Corp | 723 | −0,96 | ||||||
| 2025-08-14 | 13F | Dimension Capital Management Llc | 16 379 | 0,00 | 854 | −0,93 | ||||
| 2025-08-13 | 13F | Townsquare Capital Llc | 0 | −100,00 | 0 | |||||
| 2025-08-27 | 13F/A | Brinker Capital Investments, LLC | 9 806 | −3,02 | 511 | −3,95 | ||||
| 2025-08-14 | 13F | Mpwm Advisory Solutions, Llc | 430 | 0,00 | 22 | 0,00 | ||||
| 2025-08-11 | 13F | Elequin Capital Lp | 4 916 | −72,71 | 256 | −73,00 | ||||
| 2025-08-14 | 13F | Mariner, LLC | 160 513 | −23,94 | 8 367 | −24,69 | ||||
| 2025-07-10 | 13F | Wedmont Private Capital | 46 725 | 0,09 | 2 433 | 1,63 | ||||
| 2025-07-31 | 13F | Carnegie Capital Asset Management, LLC | 50 936 | 3,35 | 2 656 | 2,35 | ||||
| 2025-07-15 | 13F | James J. Burns & Company, LLC | 58 734 | −9,38 | 3 062 | −10,26 | ||||
| 2025-07-25 | NP | FNYTX - Franklin New York Tax-free Income Fund Class A1 | 0 | −100,00 | 0 | −100,00 | ||||
| 2025-07-11 | 13F | Farther Finance Advisors, LLC | 1 | 0,00 | 0 | |||||
| 2025-07-22 | 13F | Grimes & Company, Inc. | 8 250 | 0,00 | 430 | −0,92 | ||||
| 2025-08-15 | 13F | Manhattan West Asset Management, LLC | 6 770 | −26,38 | 353 | −27,27 | ||||
| 2025-08-13 | 13F | Northwestern Mutual Wealth Management Co | 9 451 | 493 | ||||||
| 2025-08-14 | 13F | Smartleaf Asset Management LLC | 396 | 6,45 | 21 | 5,26 | ||||
| 2025-07-21 | 13F | Patriot Financial Group Insurance Agency, LLC | 30 803 | 25,77 | 1 606 | 24,59 | ||||
| 2025-08-08 | 13F | Bailard, Inc. | 39 901 | 0,84 | 2 080 | −0,14 | ||||
| 2025-08-15 | 13F | Equitable Holdings, Inc. | 15 216 | −6,12 | 793 | −7,03 | ||||
| 2025-08-12 | 13F | LPL Financial LLC | 129 081 | 8,57 | 6 730 | 7,53 | ||||
| 2025-08-12 | 13F | Jpmorgan Chase & Co | 87 760 | −14,97 | 4 576 | −15,81 | ||||
| 2025-08-08 | 13F | Tortoise Investment Management, LLC | 3 412 | −8,08 | 178 | −9,23 | ||||
| 2025-08-08 | 13F | Wealth Alliance | 6 215 | 0,94 | 324 | 0,00 | ||||
| 2025-07-28 | 13F | Davidson Investment Advisors | 4 941 | −5,04 | 258 | −5,86 | ||||
| 2025-08-08 | 13F | Cetera Investment Advisers | 134 102 | 4,99 | 6 992 | 3,99 | ||||
| 2025-07-28 | 13F | Revolve Wealth Partners, LLC | 28 716 | 15,78 | 1 497 | 14,71 | ||||
| 2025-08-14 | 13F | Colony Group, LLC | 46 482 | 0,57 | 2 424 | −0,41 | ||||
| 2025-05-15 | 13F | MAI Capital Management | 0 | −100,00 | 0 | |||||
| 2025-08-14 | 13F | Bank Of America Corp /de/ | 645 341 | 14,39 | 33 648 | 13,29 | ||||
| 2025-08-14 | 13F | Raymond James Financial Inc | 5 171 | 29,76 | 270 | 28,71 | ||||
| 2025-07-11 | 13F | Myecfo, Llc | 130 634 | −3,26 | 6 811 | −4,19 | ||||
| 2025-08-12 | 13F | AlphaCore Capital LLC | 9 618 | 0,00 | 501 | −0,99 | ||||
| 2025-07-30 | 13F | Atlantic Edge Private Wealth Management, LLC | 2 900 | 0,00 | 151 | −0,66 | ||||
| 2025-07-23 | 13F | Proffitt & Goodson Inc | 23 234 | −21,98 | 1 211 | −22,72 | ||||
| 2025-08-08 | 13F | Empower Advisory Group, LLC | 13 987 | 26,85 | 729 | 25,69 | ||||
| 2025-08-12 | 13F | Martin Worley Group | 4 211 | 0,00 | 220 | −0,90 | ||||
| 2025-08-13 | 13F | Guggenheim Capital Llc | 4 987 | 260 | ||||||
| 2025-05-12 | 13F | Financial Engines Advisors L.L.C. | 0 | −100,00 | 0 | |||||
| 2025-07-14 | 13F | Park Avenue Securities Llc | 0 | −100,00 | 0 | |||||
| 2025-08-14 | 13F | Jane Street Group, Llc | 347 152 | 296,77 | 18 101 | 292,97 | ||||
| 2025-08-08 | 13F | Avantax Advisory Services, Inc. | 9 940 | 26,37 | 518 | 25,12 | ||||
| 2025-08-06 | 13F | Thompson Siegel & Walmsley Llc | 5 031 | 23,58 | 0 | |||||
| 2025-08-04 | 13F | WNY Asset Management, LLC | 20 709 | 11,77 | 1 080 | 10,67 | ||||
| 2025-08-14 | 13F | BCS Private Wealth Management, Inc. | 7 000 | 0 | ||||||
| 2025-07-31 | 13F | Ndwm Llc | 12 583 | 0,00 | 656 | −0,91 | ||||
| 2025-08-14 | 13F | Old Mission Capital Llc | 23 441 | 1 222 | ||||||
| 2025-08-14 | 13F | Betterment LLC | 166 364 | −1,73 | 9 | 0,00 | ||||
| 2025-08-08 | 13F | Taylor, Cottrill, Erickson & Associates, Inc. | 87 330 | −20,08 | 4 553 | −20,86 | ||||
| 2025-08-11 | 13F | Rockbridge Investment Management, LCC | 15 572 | −0,18 | 812 | −1,22 | ||||
| 2025-07-23 | 13F | Nbt Bank N A /ny | 105 220 | −0,96 | 5 486 | −1,91 | ||||
| 2025-07-09 | 13F | Breakwater Capital Group | 0 | −100,00 | 0 | |||||
| 2025-08-05 | 13F | Bank of New York Mellon Corp | 11 890 | −0,92 | 620 | −1,90 | ||||
| 2025-08-14 | 13F | Seven Mile Advisory | 3 917 | 0,00 | 204 | −0,97 | ||||
| 2025-07-29 | 13F | Calamos Wealth Management LLC | 6 683 | −51,02 | 348 | −51,53 | ||||
| 2025-07-30 | 13F | Klingman & Associates, LLC | 222 354 | −2,43 | 11 594 | −3,38 | ||||
| 2025-08-07 | 13F | Resources Investment Advisors, LLC. | 4 782 | 0,00 | 249 | −0,80 | ||||
| 2025-07-14 | 13F | Armstrong Advisory Group, Inc | 4 354 | 1,21 | 227 | −0,44 | ||||
| 2025-08-12 | 13F | Steward Partners Investment Advisory, Llc | 13 744 | −3,65 | 717 | −4,66 | ||||
| 2025-08-11 | 13F | Private Advisor Group, LLC | 13 983 | −17,93 | 729 | −18,73 | ||||
| 2025-07-17 | 13F | Astoria Strategic Wealth, Inc. | 26 675 | 8,29 | 1 391 | 7,25 | ||||
| 2025-08-11 | 13F | NewEdge Wealth, LLC | 41 946 | −8,37 | 2 184 | −9,38 | ||||
| 2025-07-22 | 13F | Miracle Mile Advisors, LLC | 317 818 | 1,09 | 16 571 | 0,11 | ||||
| 2025-07-22 | 13F | MBL Wealth, LLC | 0 | −100,00 | 0 | |||||
| 2025-07-15 | 13F | Graypoint LLC | 27 500 | 0,00 | 1 434 | −0,97 | ||||
| 2025-08-14 | 13F | Note Advisors, LLC | 54 628 | 5,25 | 2 848 | 4,25 | ||||
| 2025-08-04 | 13F | Atria Investments Llc | 5 177 | 1,13 | 270 | 0,00 | ||||
| 2025-07-29 | 13F | Chicago Partners Investment Group LLC | 19 961 | 0,08 | 1 032 | −1,06 | ||||
| 2025-07-30 | 13F | Whittier Trust Co Of Nevada Inc | 1 476 | 0,00 | 77 | −1,30 | ||||
| 2025-08-01 | 13F | Brookwood Investment Group LLC | 4 141 | 0,00 | 216 | −1,38 |