Grundläggande statistik
| Institutionella ägare | 233 total, 233 long only, 0 short only, 0 long/short - change of −11,03% MRQ |
| Genomsnittlig portföljallokering | 0.5177 % - change of 4,44% MRQ |
| Institutionella aktier (lång) | 24 557 262 (ex 13D/G) - change of −4,13MM shares −14,40% MRQ |
| Institutionellt värde (lång) | $ 1 118 244 USD ($1000) |
Institutionellt ägande och aktieägare
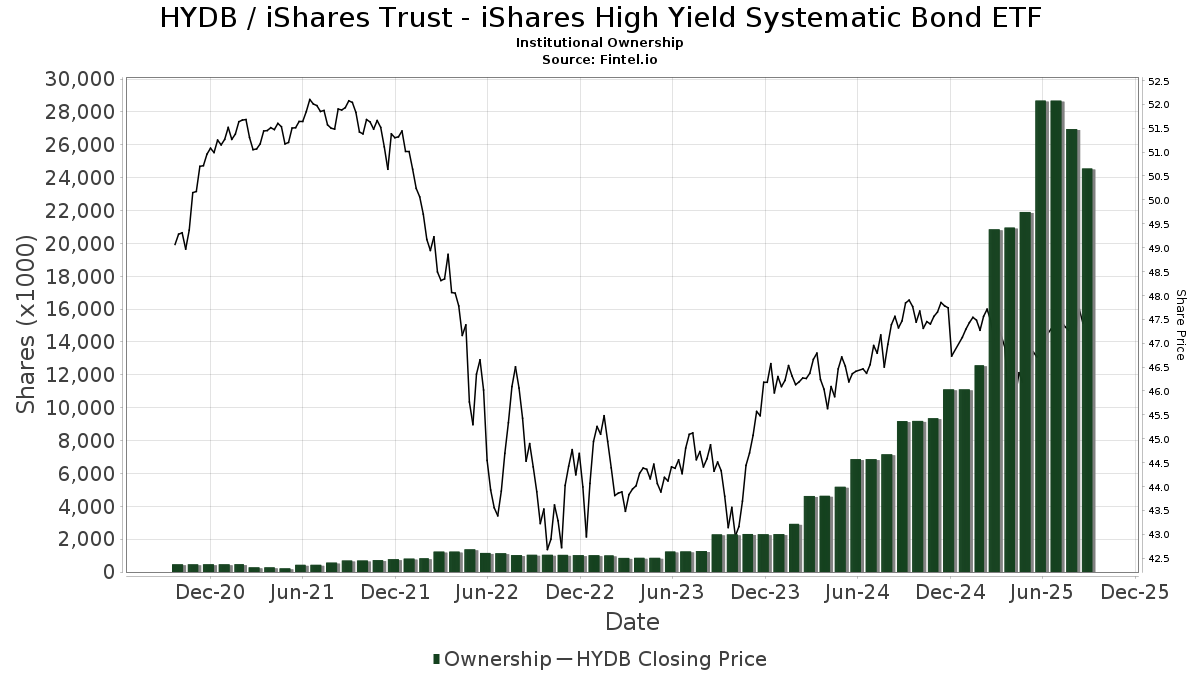
iShares Trust - iShares High Yield Systematic Bond ETF (US:HYDB) har 233 Institutionella ägare och aktieägare som har lämnat in 13D/G- eller 13F-formulär till Securities Exchange Commission (SEC). Dessa institut innehar totalt 24,557,262 aktier. Största aktieägare inkluderar Renaissancere Holdings Ltd, Bank Of America Corp /de/, Envestnet Asset Management Inc, Wealthspire Advisors, LLC, LPL Financial LLC, Ameriprise Financial Inc, State of New Jersey Common Pension Fund D, Strategic Planning Group, Llc, Insight Wealth Strategies, LLC, and Northern Lights Fund Trust - Sierra Tactical Bond Fund Investor Class Shares .
iShares Trust - iShares High Yield Systematic Bond ETF (BATS:HYDB) Institutionell ägarstruktur visar institutioners och fonders nuvarande positioner i företaget, samt de senaste förändringarna i positionernas storlek. Större aktieägare kan vara enskilda investerare, fonder, hedgefonder eller institutioner. Bilaga 13D visar att investeraren äger (eller ägde) mer än 5% av företaget och avser (eller avsåg) att aktivt eftersträva en förändring av affärsstrategin. Schedule 13G indikerar en passiv investering på över 5%.
The share price as of September 9, 2025 is 47,58 / share. Previously, on September 10, 2024, the share price was 47,40 / share. This represents an increase of 0,38% over that period.
Fondsentimentets poäng
Fondsentimentet poängen(fka Ägarackumulation-poäng) visar vilka aktier som är mest köpta av fonder. Det är resultatet av en sofistikerad kvantitativ flerfaktormodell som identifierar företag med de högsta nivåerna av institutionell ackumulering. Poängsättningsmodellen använder en kombination av den totala ökningen av redovisade ägare, förändringarna i portföljallokeringarna för dessa ägare och andra mått. Siffran sträcker sig från 0 till 100, där högre siffror indikerar en högre nivå av ackumulering i förhållande till sina konkurrenter, och 50 är genomsnittet.
Uppdateringsfrekvens: Dagligen
Se Ownership Explorer, som innehåller en lista över de högst rankade företagen.
Institutionell sälj/köp-kvot
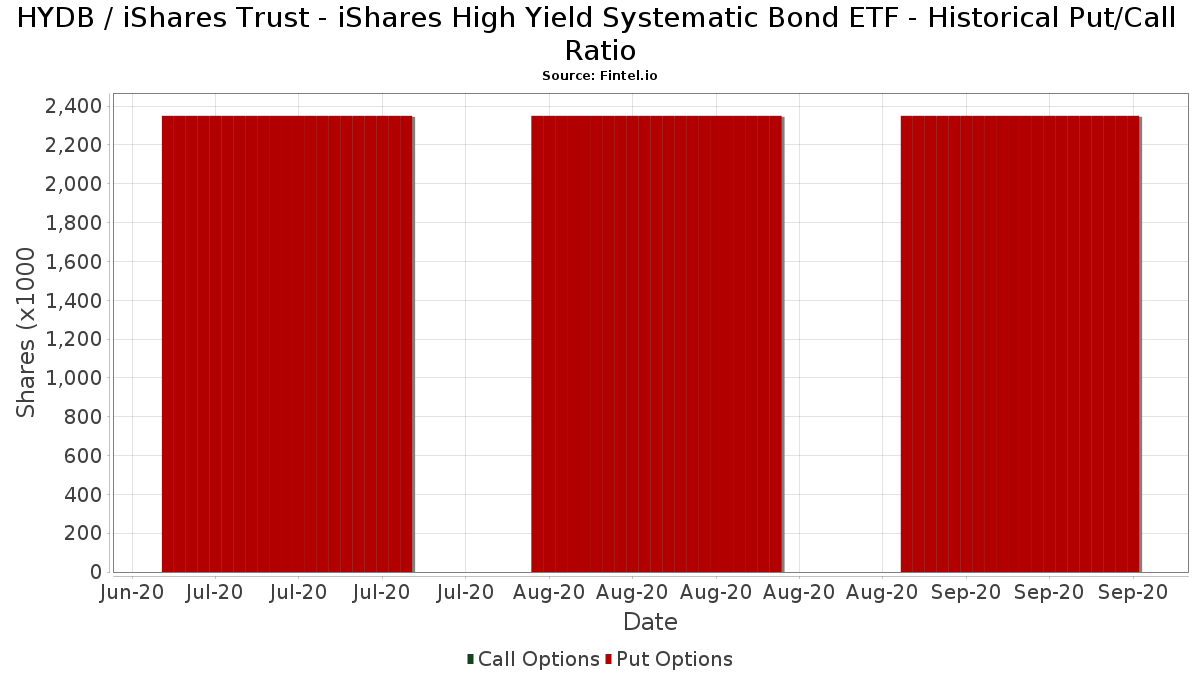
Förutom att rapportera vanliga eget kapital- och skuldemissioner måste institutioner med mer än 100MM tillgångar under förvaltning också avslöja sina innehav av sälj- och köpoptioner. Eftersom säljoptioner i allmänhet indikerar ett negativt sentiment och köpoptioner indikerar ett positivt sentiment, kan vi få en uppfattning om det övergripande institutionella sentimentet genom att plotta förhållandet mellan säljoptioner och köpoptioner. Diagrammet till höger visar det historiska förhållandet mellan sälj- och köpoptioner för detta instrument.
Genom att använda sälj/köp-kvoten som en indikator på aktieägarnas sentiment undviker man en av de största bristerna med att använda det totala institutionella ägandet, nämligen att en betydande del av de förvaltade tillgångarna investeras passivt för att följa index. Passivt förvaltade fonder köper vanligtvis inte optioner, så indikatorn för sälj/köp-kvoten ger en bättre bild av stämningen i aktivt förvaltade fonder.
13F- och NPORT-arkiveringar
Detaljer om 13F-arkiveringar är gratis. Detaljer om NP-arkiveringar kräver ett premiummedlemskap. Gröna rader indikerar nya positioner. Röda rader indikerar stängda positioner. Klicka på länk symbolen för att se hela transaktionshistoriken.
Uppgradera
för att låsa upp premiumdata och exportera till Excel ![]() .
.
| Fil Datum | Källa | Investerare | Typ | Genomsnittligt pris (beräknat) |
Aktier | Δ Aktier (%) |
Rapporterat värde (1000 USD) |
Δ Värde (%) |
Portföljallokering (%) |
|
|---|---|---|---|---|---|---|---|---|---|---|
| 2025-08-04 | 13F | Arkadios Wealth Advisors | 15 761 | 12,88 | 748 | 13,85 | ||||
| 2025-07-21 | 13F | Ascent Group, LLC | 21 150 | −62,18 | 1 004 | −61,87 | ||||
| 2025-08-14 | 13F | Synovus Financial Corp | 28 840 | 113,38 | 1 369 | 115,25 | ||||
| 2025-07-24 | 13F | Endeavor Private Wealth, Inc. | 0 | −100,00 | 0 | |||||
| 2025-05-22 | NP | MNHYX - High Yield Bond Series Class S | 392 550 | −6,44 | 18 485 | −6,28 | ||||
| 2025-08-14 | 13F | Ancora Advisors, LLC | 101 | 0,00 | 5 | 0,00 | ||||
| 2025-07-30 | 13F | Onyx Bridge Wealth Group LLC | 9 629 | 457 | ||||||
| 2025-08-07 | 13F | Allworth Financial LP | 22 286 | −1,53 | 1 058 | 0,95 | ||||
| 2025-05-06 | 13F | Venturi Wealth Management, LLC | 0 | −100,00 | 0 | |||||
| 2025-07-29 | 13F | Stratos Wealth Partners, LTD. | 53 407 | 6,49 | 2 536 | 7,37 | ||||
| 2025-08-06 | 13F | Commonwealth Equity Services, Llc | 28 599 | −73,83 | 1 | −80,00 | ||||
| 2025-07-29 | 13F | Two West Capital Advisors LLC | 4 879 | 5,54 | 231 | 11,06 | ||||
| 2025-07-18 | 13F | SigFig Wealth Management, LLC | 4 602 | −58,42 | 218 | −58,27 | ||||
| 2025-08-11 | 13F | Copperleaf Capital, LLC | 10 555 | 16,44 | 501 | 17,61 | ||||
| 2025-07-15 | 13F | North Star Investment Management Corp. | 1 175 | 0,00 | 56 | 0,00 | ||||
| 2025-07-07 | 13F | Retirement Wealth Solutions LLC | 171 | −76,80 | 8 | −76,47 | ||||
| 2025-07-24 | 13F | JB Capital LLC | 4 769 | −24,13 | 226 | −23,39 | ||||
| 2025-08-08 | 13F | Kingsview Wealth Management, LLC | 14 597 | 0,81 | 693 | 1,62 | ||||
| 2025-07-09 | 13F | Breakwater Capital Group | 10 920 | 55,76 | 518 | 56,97 | ||||
| 2025-08-05 | 13F | Bank Of Montreal /can/ | 0 | −100,00 | 0 | |||||
| 2025-08-12 | 13F | BlackRock, Inc. | 182 180 | −62,99 | 8 649 | −62,69 | ||||
| 2025-07-31 | 13F | State of New Jersey Common Pension Fund D | 563 120 | 0,00 | 26 734 | 0,82 | ||||
| 2025-07-30 | 13F | Brookstone Capital Management | 0 | −100,00 | 0 | |||||
| 2025-05-07 | 13F | Spectrum Wealth Counsel, LLC | 5 383 | 10,74 | 253 | 10,96 | ||||
| 2025-08-11 | 13F | United Capital Financial Advisers, Llc | 49 329 | −59,22 | 2 342 | −58,89 | ||||
| 2025-04-22 | 13F | Veridan Wealth LLC | 48 822 | 3,60 | 2 299 | 3,37 | ||||
| 2025-08-15 | 13F | Captrust Financial Advisors | 250 133 | −48,89 | 11 874 | −48,47 | ||||
| 2025-08-01 | 13F | Liberty Wealth Management Llc | 5 496 | −54,20 | 261 | −22,62 | ||||
| 2025-08-07 | 13F | Resources Investment Advisors, LLC. | 73 142 | −9,50 | 3 472 | −8,75 | ||||
| 2025-08-14 | 13F | Peapack Gladstone Financial Corp | 0 | −100,00 | 0 | |||||
| 2025-08-12 | 13F | CIBC Private Wealth Group, LLC | 0 | −100,00 | 0 | |||||
| 2025-07-17 | 13F | Park Place Capital Corp | 70 | −36,94 | 3 | −40,00 | ||||
| 2025-07-15 | 13F | FLP Wealth Management, LLC | 0 | −100,00 | 0 | |||||
| 2025-05-15 | 13F | Citadel Advisors Llc | 0 | −100,00 | 0 | |||||
| 2025-08-14 | 13F | Kovitz Investment Group Partners, LLC | 0 | −100,00 | 0 | −100,00 | ||||
| 2025-07-29 | 13F | Horst & Graben Wealth Management LLC | 0 | −100,00 | 0 | |||||
| 2025-08-13 | 13F | Johnson Financial Group, Inc. | 0 | −100,00 | 0 | |||||
| 2025-08-14 | 13F | Mariner, LLC | 74 203 | 3 523 | ||||||
| 2025-08-14 | 13F | UBS Group AG | 227 285 | 22,83 | 10 790 | 23,84 | ||||
| 2025-08-14 | 13F | CoreCap Advisors, LLC | 88 | −79,63 | 4 | −80,00 | ||||
| 2025-08-18 | 13F | Front Row Advisors LLC | 100 | 0,00 | 5 | 0,00 | ||||
| 2025-07-25 | 13F | Sequoia Financial Advisors, LLC | 0 | −100,00 | 0 | |||||
| 2025-07-14 | 13F | U.S. Capital Wealth Advisors, LLC | 9 281 | −64,52 | 441 | −64,26 | ||||
| 2025-08-14 | 13F | Atomi Financial Group, Inc. | 208 301 | 8,49 | 9 889 | 9,38 | ||||
| 2025-07-24 | 13F | Leo Wealth, LLC | 29 345 | 1 393 | ||||||
| 2025-08-14 | 13F | Sunbelt Securities, Inc. | 1 879 | 76,76 | 88 | 76,00 | ||||
| 2025-08-14 | 13F | Mml Investors Services, Llc | 222 439 | −19,05 | 11 | −16,67 | ||||
| 2025-07-18 | 13F | Madrona Financial Services, LLC | 7 694 | 6,80 | 365 | 7,67 | ||||
| 2025-08-11 | 13F | Mach-1 Financial Group, Inc. | 0 | −100,00 | 0 | |||||
| 2025-08-11 | 13F | Outlook Wealth Advisors, LLC | 292 055 | 1,46 | 13 865 | 2,29 | ||||
| 2025-07-16 | 13F | Moisand Fitzgerald Tamayo, LLC | 306 | 0,00 | 15 | 0,00 | ||||
| 2025-08-12 | 13F | Steward Partners Investment Advisory, Llc | 2 074 | −75,35 | 98 | −75,25 | ||||
| 2025-08-08 | 13F | Advisory Resource Group | 74 098 | 8,68 | 3 518 | 9,56 | ||||
| 2025-07-25 | 13F | Retirement Planning Group, Llc / Ny | 56 218 | 0,33 | 2 669 | 1,14 | ||||
| 2025-07-25 | 13F | Wells Financial Advisors INC | 320 | 0,00 | 15 | 0,00 | ||||
| 2025-08-07 | 13F | Shared Vision Wealth Group LLC | 4 803 | −51,85 | 228 | −51,60 | ||||
| 2025-07-28 | 13F | Cypress Wealth Services, LLC | 0 | −100,00 | 0 | |||||
| 2025-08-26 | NP | EVMLX - The E-Valuator Moderate (50%-70%) RMS Fund Service Class Shares | 26 618 | −12,58 | 1 264 | −11,86 | ||||
| 2025-04-28 | 13F | Actinver Wealth Management, Inc. | 0 | −100,00 | 0 | |||||
| 2025-08-11 | 13F | Summit Wealth Partners, LLC | 11 760 | −49,28 | 558 | −48,85 | ||||
| 2025-07-14 | 13F | Abound Wealth Management | 0 | −100,00 | 0 | |||||
| 2025-07-10 | 13F | Exchange Traded Concepts, Llc | 11 975 | 0,06 | 569 | 0,89 | ||||
| 2025-07-24 | 13F | MA Private Wealth | 137 856 | 1 340,35 | 6 545 | 1 354,22 | ||||
| 2025-09-04 | 13F/A | Advisor Group Holdings, Inc. | 277 421 | 22,14 | 13 156 | 22,99 | ||||
| 2025-07-25 | 13F | ONE Advisory Partners, LLC | 0 | −100,00 | 0 | |||||
| 2025-07-23 | 13F | Prime Capital Investment Advisors, LLC | 7 777 | −2,71 | 369 | −1,86 | ||||
| 2025-07-29 | 13F | ShoreHaven Wealth Partners, LLC | 0 | −100,00 | 0 | |||||
| 2025-08-14 | 13F | Guardian Wealth Advisors, Llc / Nc | 0 | −100,00 | 0 | |||||
| 2025-08-14 | 13F | Royal Bank Of Canada | 19 994 | −14,30 | 949 | −13,65 | ||||
| 2025-07-14 | 13F | Strategic Planning Group, Llc | 496 220 | 8,65 | 23 558 | 9,54 | ||||
| 2025-08-12 | 13F | Coldstream Capital Management Inc | 0 | −100,00 | 0 | |||||
| 2025-08-14 | 13F | Balanced Rock Investment Advisor | 6 385 | 7,09 | 303 | 8,21 | ||||
| 2025-08-13 | 13F | Twin Peaks Wealth Advisors, LLC | 48 | 2 | ||||||
| 2025-07-23 | 13F | Watershed Private Wealth Llc | 23 609 | −1,40 | 1 121 | −0,62 | ||||
| 2025-07-31 | 13F | Cambridge Investment Research Advisors, Inc. | 44 203 | −20,27 | 2 | 0,00 | ||||
| 2025-07-10 | 13F | Sovran Advisors, LLC | 24 346 | 71,01 | 1 147 | 76,04 | ||||
| 2025-07-23 | 13F | Steel Peak Wealth Management LLC | 18 399 | −49,81 | 873 | −49,42 | ||||
| 2025-07-22 | 13F | Bay Harbor Wealth Management, LLC | 2 358 | −61,46 | 112 | −61,46 | ||||
| 2025-08-13 | 13F | BCJ Capital Management, LLC | 13 121 | −50,19 | 623 | −49,84 | ||||
| 2025-07-24 | 13F | Jfs Wealth Advisors, Llc | 16 902 | 1,52 | 802 | 2,30 | ||||
| 2025-05-15 | 13F/A | Orion Portfolio Solutions, LLC | 5 830 | 17,87 | 275 | 18,10 | ||||
| 2025-07-11 | 13F | Matthew Goff Investment Advisor, LLC | 5 321 | −16,47 | 253 | −15,72 | ||||
| 2025-07-09 | 13F | Dynamic Advisor Solutions LLC | 45 373 | 5,27 | 2 154 | 6,16 | ||||
| 2025-08-12 | 13F | MAI Capital Management | 16 | 0,00 | 1 | |||||
| 2025-08-06 | 13F | Summit Investment Advisors, Inc. | 8 065 | 1,90 | 380 | 3,84 | ||||
| 2025-08-14 | 13F | Diversify Advisory Services, LLC | 0 | −100,00 | 0 | |||||
| 2025-08-27 | 13F | Barnes Wealth Management Group, Inc | 0 | −100,00 | 0 | |||||
| 2025-08-26 | NP | EVGLX - The E-Valuator Growth (70%-85%) RMS Fund Service Class Shares | 13 031 | −0,97 | 619 | −0,16 | ||||
| 2025-08-08 | 13F | Meridian Wealth Management, LLC | 10 787 | 36,20 | 512 | 37,63 | ||||
| 2025-07-21 | 13F | Ameriflex Group, Inc. | 1 795 | 66,36 | 85 | 68,00 | ||||
| 2025-07-11 | 13F | Adirondack Trust Co | 882 | 0,00 | 42 | 0,00 | ||||
| 2025-07-29 | 13F | Liberty Square Wealth Partners Llc | 100 852 | 134,14 | 4 788 | 136,05 | ||||
| 2025-08-04 | 13F | Atria Investments Llc | 21 832 | −46,51 | 1 036 | −46,07 | ||||
| 2025-07-09 | 13F | Westbourne Investments, Inc. | 17 123 | 0,00 | 813 | 0,74 | ||||
| 2025-08-11 | 13F | Tidemark, LLC | 14 987 | −9,06 | 711 | −8,38 | ||||
| 2025-08-14 | 13F | Wells Fargo & Company/mn | 21 | −89,50 | 1 | −88,89 | ||||
| 2025-08-08 | 13F | Emerald Investment Partners, Llc | 4 599 | −47,49 | 218 | −47,09 | ||||
| 2025-07-22 | 13F | Merit Financial Group, LLC | 22 428 | −58,55 | 1 065 | −58,24 | ||||
| 2025-08-08 | 13F | IMA Wealth, Inc. | 269 294 | 2,40 | 12 785 | 3,24 | ||||
| 2025-08-26 | 13F/A | Thrivent Financial For Lutherans | 20 672 | 11,85 | 1 | |||||
| 2025-05-14 | 13F | Caitlin John, LLC | 0 | −100,00 | 0 | |||||
| 2025-07-14 | 13F | Cobblestone Asset Management LLC | 0 | −100,00 | 0 | |||||
| 2025-07-17 | 13F/A | Capital Investment Advisors, LLC | 8 495 | −5,56 | 403 | −4,73 | ||||
| 2025-08-11 | 13F | PAX Financial Group, LLC | 0 | −100,00 | 0 | |||||
| 2025-07-10 | 13F | Oliver Lagore Vanvalin Investment Group | 415 | −2,35 | 20 | 0,00 | ||||
| 2025-08-08 | 13F | Pnc Financial Services Group, Inc. | 1 434 | 36,70 | 68 | 38,78 | ||||
| 2025-08-12 | 13F | Change Path, LLC | 57 148 | 4,35 | 2 713 | 5,24 | ||||
| 2025-07-25 | 13F | Cwm, Llc | 264 339 | −47,41 | 13 | −47,83 | ||||
| 2025-08-05 | 13F | Claro Advisors LLC | 0 | −100,00 | 0 | |||||
| 2025-08-13 | 13F | Victory Financial Group, Llc | 0 | −100,00 | 0 | |||||
| 2025-08-14 | 13F | Brinker Capital Investments, LLC | 0 | −100,00 | 0 | |||||
| 2025-08-12 | 13F | Integrated Advisors Network LLC | 0 | −100,00 | 0 | |||||
| 2025-04-30 | 13F | POM Investment Strategies, LLC | 0 | −100,00 | 0 | |||||
| 2025-07-21 | 13F | Ameritas Advisory Services, LLC | 2 430 | 115 | ||||||
| 2025-07-25 | 13F | Atria Wealth Solutions, Inc. | 23 019 | −43,73 | 1 093 | −43,30 | ||||
| 2025-08-14 | 13F | Icon Wealth Advisors, LLC | 4 911 | −61,19 | 233 | −60,84 | ||||
| 2025-08-14 | 13F | Ameriprise Financial Inc | 853 852 | 12,77 | 40 537 | 13,68 | ||||
| 2025-07-31 | 13F | Glass Jacobson Investment Advisors llc | 0 | −100,00 | 0 | |||||
| 2025-07-31 | 13F | TSA Wealth Managment LLC | 10 874 | −60,01 | 516 | −59,69 | ||||
| 2025-08-12 | 13F | Cook Wealth Management Group Llc | 0 | −100,00 | 0 | |||||
| 2025-07-17 | 13F | Janney Montgomery Scott LLC | 34 131 | −66,60 | 2 | −75,00 | ||||
| 2025-08-01 | 13F | Rossby Financial, LCC | 91 | 4 | ||||||
| 2025-08-11 | 13F | Aptus Capital Advisors, LLC | 2 666 | −19,77 | 127 | −19,23 | ||||
| 2025-08-12 | 13F | LPL Financial LLC | 897 478 | −20,50 | 42 608 | −19,85 | ||||
| 2025-07-30 | 13F | TFB Advisors LLC | 24 275 | 19,39 | 1 152 | 20,38 | ||||
| 2025-08-08 | 13F | Cetera Investment Advisers | 301 795 | −31,03 | 14 328 | −30,47 | ||||
| 2025-05-27 | NP | BlackRock Funds II - BLACKROCK 40/60 TARGET ALLOCATION FUND INSTITUTIONAL SHARES | 298 821 | 9,78 | 14 071 | 9,97 | ||||
| 2025-08-11 | 13F | Independent Advisor Alliance | 7 243 | 33,00 | 344 | 33,98 | ||||
| 2025-08-13 | 13F | Cerity Partners LLC | 16 142 | 766 | ||||||
| 2025-07-24 | 13F | Us Bancorp \de\ | 18 430 | −53,26 | 875 | −52,91 | ||||
| 2025-04-11 | 13F | Snider Financial Group | 0 | −100,00 | 0 | |||||
| 2025-04-21 | 13F | Nelson, Van Denburg & Campbell Wealth Management Group, LLC | 0 | −100,00 | 0 | |||||
| 2025-04-14 | 13F | Strategic Wealth Designers | 0 | −100,00 | 0 | −100,00 | ||||
| 2025-08-14 | 13F | Tennessee Valley Asset Management Partners | 0 | −100,00 | 0 | |||||
| 2025-08-01 | 13F | Capital Investment Counsel, LLC | 320 003 | 9,91 | 15 192 | 10,81 | ||||
| 2025-08-07 | 13F | Summit X, LLC | 46 940 | −16,72 | 2 229 | −16,05 | ||||
| 2025-07-28 | 13F | Pettinga Financial Advisors, LLC | 0 | −100,00 | 0 | |||||
| 2025-07-29 | 13F | Systelligence, LLC | 81 442 | −16,91 | 3 866 | −16,23 | ||||
| 2025-08-05 | 13F | Tsfg, Llc | 1 556 | −66,99 | 0 | |||||
| 2025-08-11 | 13F | Wealthspire Advisors, LLC | 1 263 546 | 1,57 | 59 987 | 2,40 | ||||
| 2025-08-14 | 13F/A | Rockefeller Capital Management L.P. | 15 058 | 715 | ||||||
| 2025-07-25 | 13F | Apollon Wealth Management, LLC | 316 362 | 868,03 | 15 019 | 876,53 | ||||
| 2025-07-10 | 13F | Sharkey, Howes & Javer | 4 690 | −79,06 | 223 | −78,94 | ||||
| 2025-08-04 | 13F | Spire Wealth Management | 937 | −14,27 | 44 | −13,73 | ||||
| 2025-08-01 | 13F | Cedar Point Capital Partners, LLC | 0 | −100,00 | 0 | |||||
| 2025-08-06 | 13F | Legacy Wealth Managment, LLC/ID | 0 | −100,00 | 0 | |||||
| 2025-08-14 | 13F | Integrated Wealth Concepts LLC | 14 253 | −58,46 | 677 | −58,14 | ||||
| 2025-08-14 | 13F | Wiley Bros.-aintree Capital, Llc | 8 402 | 399 | ||||||
| 2025-08-18 | 13F/A | Kestra Investment Management, LLC | 90 080 | 41,88 | 4 277 | 43,06 | ||||
| 2025-08-11 | 13F | HighTower Advisors, LLC | 21 663 | −1,50 | 1 028 | −0,68 | ||||
| 2025-08-13 | 13F | Manning & Napier Advisors Llc | 1 111 | −99,72 | 53 | −99,72 | ||||
| 2025-07-14 | 13F | AdvisorNet Financial, Inc | 112 | −40,43 | 5 | −37,50 | ||||
| 2025-08-08 | 13F | Security Financial Services, INC. | 28 383 | −11,07 | 1 347 | −10,32 | ||||
| 2025-08-12 | 13F | Armor Investment Advisors, LLC | 20 781 | 5,73 | 987 | 6,59 | ||||
| 2025-08-14 | 13F | IHT Wealth Management, LLC | 161 078 | −63,56 | 7 647 | −63,26 | ||||
| 2025-08-14 | 13F | Raymond James Financial Inc | 121 426 | 14,57 | 5 765 | 15,51 | ||||
| 2025-05-14 | 13F | Huntington National Bank | 0 | |||||||
| 2025-08-14 | 13F | EP Wealth Advisors, Inc. | 2 904 | 138 | ||||||
| 2025-08-05 | 13F | Summit Investment Advisory Services, LLC | 8 018 | 381 | ||||||
| 2025-04-15 | 13F | Collier Financial | 184 | −98,30 | 9 | −98,43 | ||||
| 2025-08-13 | 13F | Capital Analysts, Inc. | 2 882 | −32,30 | 0 | |||||
| 2025-08-13 | 13F | Northwestern Mutual Wealth Management Co | 4 864 | −15,22 | 231 | −14,81 | ||||
| 2025-08-14 | 13F | Stifel Financial Corp | 28 166 | −54,68 | 1 337 | −54,31 | ||||
| 2025-08-12 | 13F | J.w. Cole Advisors, Inc. | 28 902 | 1 372 | ||||||
| 2025-07-18 | 13F | SOA Wealth Advisors, LLC. | 2 940 | 140 | ||||||
| 2025-08-11 | 13F | Cornerstone Planning Group LLC | 339 170 | 6,64 | 16 016 | 9,68 | ||||
| 2025-08-04 | 13F | Savvy Advisors, Inc. | 79 087 | 32,64 | 3 755 | 33,74 | ||||
| 2025-08-08 | 13F | Foundations Investment Advisors, LLC | 55 174 | −61,72 | 2 619 | −61,41 | ||||
| 2025-08-26 | NP | BlackRock Funds II - BLACKROCK 20/80 TARGET ALLOCATION FUND INSTITUTIONAL SHARES | 181 082 | −3,13 | 8 597 | −2,34 | ||||
| 2025-07-25 | 13F | Midwest Capital Advisors, LLC | 3 655 | −85,74 | 174 | −85,66 | ||||
| 2025-07-25 | 13F | Apollon Financial, LLC | 9 918 | 471 | ||||||
| 2025-08-13 | 13F | Colonial Trust Co / SC | 196 | 9 | ||||||
| 2025-04-25 | 13F | TBH Global Asset Management, LLC | 0 | −100,00 | 0 | |||||
| 2025-08-12 | 13F | Proequities, Inc. | 0 | 0 | ||||||
| 2025-04-22 | 13F | Synergy Financial Management, LLC | 0 | −100,00 | 0 | |||||
| 2025-07-11 | 13F | Farther Finance Advisors, LLC | 5 307 | −49,48 | 252 | −48,98 | ||||
| 2025-05-14 | 13F | GM Advisory Group, Inc. | 0 | −100,00 | 0 | |||||
| 2025-07-17 | 13F | Raleigh Capital Management Inc. | 0 | −100,00 | 0 | |||||
| 2025-07-21 | 13F | Mirae Asset Global Investments Co., Ltd. | 0 | −100,00 | 0 | |||||
| 2025-07-21 | 13F | Keystone Financial Group, Inc. | 2 978 | 53,03 | 141 | 57,30 | ||||
| 2025-08-13 | 13F | Continuum Advisory, LLC | 34 837 | −0,65 | 1 654 | 0,12 | ||||
| 2025-07-16 | 13F | St Germain D J Co Inc | 190 | 9 | ||||||
| 2025-07-23 | 13F | Lansing Street Advisors | 13 651 | 14,90 | 648 | 15,92 | ||||
| 2025-08-11 | 13F | Regal Investment Advisors LLC | 17 429 | −34,41 | 827 | −33,89 | ||||
| 2025-07-29 | 13F | Cottonwood Capital Advisors, Llc | 116 806 | 10,51 | 5 545 | 11,41 | ||||
| 2025-07-22 | 13F | Wealthcare Advisory Partners LLC | 4 335 | 206 | ||||||
| 2025-07-28 | 13F | Harbour Investments, Inc. | 84 | 4 | ||||||
| 2025-07-08 | 13F | Nbc Securities, Inc. | 1 155 | 1,85 | 0 | |||||
| 2025-07-15 | 13F | Beacon Financial Planning, Inc | 67 167 | 18,34 | 3 189 | 19,31 | ||||
| 2025-08-15 | 13F | Kestra Advisory Services, LLC | 47 490 | −3,57 | 2 255 | −2,80 | ||||
| 2025-08-12 | 13F | New Republic Capital, LLC | 0 | −100,00 | 0 | |||||
| 2025-08-12 | 13F | O'shaughnessy Asset Management, Llc | 0 | −100,00 | 0 | |||||
| 2025-07-16 | 13F | Perigon Wealth Management, LLC | 6 459 | 307 | ||||||
| 2025-08-05 | 13F | Dahring | Cusmano Llc | 178 596 | −0,45 | 8 479 | 0,36 | ||||
| 2025-08-06 | 13F | Quadrant Private Wealth Management, LLC | 0 | −100,00 | 0 | |||||
| 2025-08-05 | 13F | 5T Wealth, LLC | 9 221 | −25,86 | 438 | −25,30 | ||||
| 2025-07-16 | 13F | BOS Asset Management, LLC | 0 | −100,00 | 0 | |||||
| 2025-07-15 | 13F | Oxinas Partners Wealth Management LLC | 9 303 | −5,91 | 442 | −5,16 | ||||
| 2025-08-14 | 13F | Snowden Capital Advisors LLC | 0 | −100,00 | 0 | −100,00 | ||||
| 2025-08-14 | 13F | Comerica Bank | 3 952 | −29,34 | 188 | −28,90 | ||||
| 2025-08-05 | 13F | Prosperity Consulting Group, LLC | 0 | −100,00 | 0 | |||||
| 2025-08-12 | 13F | Park Square Financial Group, LLC | 172 | −14,00 | 8 | −11,11 | ||||
| 2025-07-17 | 13F | Kelly Financial Services LLC | 16 134 | −80,42 | 766 | −80,28 | ||||
| 2025-08-15 | 13F | Morgan Stanley | 370 713 | −25,33 | 17 600 | −24,72 | ||||
| 2025-07-30 | 13F | LGT Financial Advisors LLC | 2 | 0,00 | 0 | |||||
| 2025-07-31 | 13F | Fedenia Advisers LLC | 7 822 | −34,54 | 371 | −33,99 | ||||
| 2025-08-13 | 13F | Milestone Investment Advisors LLC | 140 | 0,00 | 7 | 0,00 | ||||
| 2025-08-04 | 13F | Pensionmark Financial Group, Llc | 13 651 | −12,35 | 648 | −11,60 | ||||
| 2025-08-12 | 13F | BlueStem Wealth Partners, LLC | 230 328 | 5 089,91 | 10 935 | 5 156,73 | ||||
| 2025-05-14 | 13F | Jane Street Group, Llc | 0 | −100,00 | 0 | |||||
| 2025-07-07 | 13F | Insight Wealth Strategies, LLC | 461 563 | 99,88 | 21 786 | 100,36 | ||||
| 2025-07-23 | 13F | Seamount Financial Group Inc | 27 370 | 3,53 | 1 299 | 4,42 | ||||
| 2025-08-04 | 13F | Creative Financial Designs Inc /adv | 2 322 | −97,88 | 110 | −97,86 | ||||
| 2025-08-13 | 13F | Avestar Capital, LLC | 29 852 | 1,58 | 1 417 | 2,46 | ||||
| 2025-07-14 | 13F | Buttonwood Financial Group, LLC | 0 | −100,00 | 0 | |||||
| 2025-08-13 | 13F | West Wealth Group, LLC | 0 | −100,00 | 0 | |||||
| 2025-08-26 | NP | EVTTX - The E-Valuator Conservative/Moderate (30%-50%) RMS Fund Service Class Shares | 9 904 | −3,21 | 470 | −2,29 | ||||
| 2025-07-31 | 13F | Opus Capital Group, LLC | 6 141 | 4,49 | 0 | |||||
| 2025-07-15 | 13F | Cranbrook Wealth Management, LLC | 9 747 | 28,49 | 463 | 29,41 | ||||
| 2025-08-08 | 13F | Avantax Advisory Services, Inc. | 57 445 | 1,91 | 2 727 | 2,75 | ||||
| 2025-07-31 | 13F | Wright Fund Managment, LLC | 240 799 | 0,00 | 11 339 | 0,00 | ||||
| 2025-08-13 | 13F | Mount Yale Investment Advisors, LLC | 2 655 | 126 | ||||||
| 2025-08-08 | 13F | Thoroughbred Financial Services, Llc | 23 600 | 0,34 | 1 | 0,00 | ||||
| 2025-08-06 | 13F | First Horizon Advisors, Inc. | 3 147 | −35,72 | 149 | −35,22 | ||||
| 2025-08-11 | 13F | Sofi Wealth, Llc | 231 698 | 11 000 | ||||||
| 2025-08-26 | NP | EVVLX - The E-Valuator Very Conservative (0%-15%) RMS Fund Service Class Shares | 14 960 | −7,20 | 710 | −6,46 | ||||
| 2025-07-24 | 13F | IFP Advisors, Inc | 50 217 | 82,26 | 2 384 | 83,73 | ||||
| 2025-08-14 | 13F | Warren Averett Asset Management, LLC | 116 319 | −1,17 | 5 522 | −0,36 | ||||
| 2025-07-18 | 13F | Pennsylvania Capital Management Inc /adv | 5 091 | 1,72 | 242 | 2,55 | ||||
| 2025-08-28 | NP | Northern Lights Fund Trust - Sierra Tactical Bond Fund Investor Class Shares | 427 800 | 77,81 | 20 310 | 79,27 | ||||
| 2025-07-17 | 13F | Sound Income Strategies, LLC | 1 091 | 1,30 | 52 | 2,00 | ||||
| 2025-08-14 | 13F | Fmr Llc | 789 | 6,62 | 37 | 8,82 | ||||
| 2025-08-14 | 13F | GWM Advisors LLC | 42 073 | −57,90 | 1 997 | −57,56 | ||||
| 2025-08-13 | 13F | GeoWealth Management, LLC | 3 964 | 188 | ||||||
| 2025-07-29 | 13F | International Assets Investment Management, Llc | 5 049 | −23,49 | 240 | −22,90 | ||||
| 2025-08-12 | 13F | Absolute Capital Management, LLC | 8 070 | −17,69 | 383 | −16,92 | ||||
| 2025-08-26 | NP | EVAGX - The E-Valuator Aggressive Growth (85%-99%) RMS Fund Service Class Shares | 2 292 | −60,93 | 109 | −60,87 | ||||
| 2025-08-05 | 13F | Dynasty Wealth Management, Llc | 64 735 | −2,37 | 3 073 | −1,57 | ||||
| 2025-07-23 | 13F | True Vision MN LLC | 0 | −100,00 | 0 | |||||
| 2025-08-05 | 13F | Bank of New York Mellon Corp | 84 846 | −42,96 | 4 028 | −42,50 | ||||
| 2025-08-11 | 13F | Principal Securities, Inc. | 9 253 | 66,87 | 439 | 68,85 | ||||
| 2025-07-15 | 13F | Mather Group, Llc. | 0 | −100,00 | 0 | |||||
| 2025-08-06 | 13F | Eukles Asset Management | 477 | 0,00 | 23 | 0,00 | ||||
| 2025-04-21 | 13F | Bay Colony Advisory Group, Inc d/b/a Bay Colony Advisors | 0 | −100,00 | 0 | −100,00 | ||||
| 2025-08-11 | 13F | Private Advisor Group, LLC | 23 946 | −3,66 | 1 137 | −2,91 | ||||
| 2025-08-14 | 13F | Modern Wealth Management, LLC | 17 288 | −40,05 | 821 | −39,57 | ||||
| 2025-07-29 | 13F | Arista Wealth Management, LLC | 10 425 | 495 | ||||||
| 2025-08-15 | 13F | High Falls Advisors, Inc | 0 | −100,00 | 0 | |||||
| 2025-08-13 | 13F | EverSource Wealth Advisors, LLC | 575 | −38,70 | 27 | −38,64 | ||||
| 2025-07-30 | 13F | Strategic Blueprint, LLC | 12 500 | −23,63 | 593 | −22,99 | ||||
| 2025-08-05 | 13F | Scarborough Advisors, LLC | 1 423 | 68 | ||||||
| 2025-08-07 | 13F | Hennion & Walsh Asset Management, Inc. | 21 614 | −1,57 | 1 026 | −0,77 | ||||
| 2025-08-04 | 13F | Twin City Private Wealth, Llc | 1 169 | 4,19 | 55 | 5,77 | ||||
| 2025-08-26 | NP | EVCLX - The E-Valuator Conservative (15%-30%) RMS Fund Service Class Shares | 14 637 | −34,03 | 695 | −33,52 | ||||
| 2025-08-12 | 13F | OneAscent Financial Services LLC | 0 | −100,00 | 0 | |||||
| 2025-08-06 | 13F | Hoxton Planning & Management, LLC | 0 | −100,00 | 0 | |||||
| 2025-07-15 | 13F | Regatta Capital Group, Llc | 5 989 | 284 | ||||||
| 2025-08-11 | 13F | CFS Investment Advisory Services, LLC | 5 233 | −71,99 | 0 | |||||
| 2025-07-23 | 13F | Nbt Bank N A /ny | 9 045 | 5,24 | 429 | 6,19 | ||||
| 2025-05-06 | 13F | Advocacy Wealth Management Services, LLC | 0 | −100,00 | 0 | |||||
| 2025-08-12 | 13F | PKS Advisory Services, LLC | 5 048 | −7,83 | 240 | −7,00 | ||||
| 2025-08-28 | NP | GPARX - GuidePath(R) Absolute Return Allocation Fund Service Shares | 107 224 | −50,91 | 5 090 | −50,51 | ||||
| 2025-07-28 | 13F | Sagespring Wealth Partners, Llc | 0 | −100,00 | 0 | |||||
| 2025-08-01 | 13F | Envestnet Asset Management Inc | 1 309 871 | −51,73 | 62 186 | −51,34 | ||||
| 2025-08-06 | 13F | AE Wealth Management LLC | 6 286 | −57,84 | 298 | −57,55 | ||||
| 2025-07-22 | 13F | Simplicity Wealth,LLC | 11 150 | 9,09 | 529 | 9,98 | ||||
| 2025-07-25 | 13F | Richardson Financial Services Inc. | 22 | −26,67 | 1 | 0,00 | ||||
| 2025-08-06 | 13F | ROI Financial Advisors, LLC | 16 116 | 59,38 | 765 | 60,71 | ||||
| 2025-08-12 | 13F | Global Retirement Partners, LLC | 6 410 | 37,64 | 304 | 39,45 | ||||
| 2025-07-29 | 13F | Private Trust Co Na | 1 176 | −48,47 | 56 | −48,60 | ||||
| 2025-08-06 | 13F | Stone House Investment Management, LLC | 344 | −89,46 | 16 | −89,54 | ||||
| 2025-08-12 | 13F | SRS Capital Advisors, Inc. | 316 | −64,89 | 15 | −64,29 | ||||
| 2025-08-19 | 13F | Cape Investment Advisory, Inc. | 344 | −8,99 | 16 | −5,88 | ||||
| 2025-07-21 | 13F | Triad Wealth Partners, LLC | 54 495 | −19,96 | 2 587 | −19,28 | ||||
| 2025-07-30 | 13F | Blume Capital Management, Inc. | 0 | −100,00 | 0 | |||||
| 2025-07-24 | 13F | Riverchase Wealth Management, Llc | 12 594 | 3,87 | 598 | 4,74 | ||||
| 2025-04-15 | 13F | Braun-Bostich & Associates Inc. | 0 | −100,00 | 0 | |||||
| 2025-08-06 | 13F | Financial Advisory Corp /ut/ /adv | 29 291 | 7,96 | 1 | 0,00 | ||||
| 2025-08-06 | 13F | Mascagni Wealth Management, Inc. | 95 560 | 1,58 | 4 537 | 2,42 | ||||
| 2025-07-25 | 13F | Envestnet Portfolio Solutions, Inc. | 80 666 | −69,40 | 3 830 | −69,15 | ||||
| 2025-04-21 | 13F | ORG Partners LLC | 0 | −100,00 | 0 | |||||
| 2025-08-13 | 13F | Correct Capital Wealth Management | 92 769 | −2,42 | 4 404 | −1,61 | ||||
| 2025-06-26 | NP | FARX - Frontier Asset Absolute Return ETF | 11 968 | −6,38 | 555 | −8,57 | ||||
| 2025-07-23 | 13F | Sax Wealth Advisors, Llc | 159 550 | 1,61 | 7 575 | 2,45 | ||||
| 2025-07-08 | 13F | TL Private Wealth | 200 616 | 1,40 | 9 463 | 7,16 | ||||
| 2025-07-08 | 13F | Parallel Advisors, LLC | 79 | 0,00 | 4 | 0,00 | ||||
| 2025-08-14 | 13F | Bank Of America Corp /de/ | 2 929 987 | −1,53 | 139 101 | −0,73 | ||||
| 2025-08-11 | 13F | Renaissancere Holdings Ltd | 5 057 726 | 0,00 | 240 116 | 0,82 | ||||
| 2025-05-16 | 13F | Jones Financial Companies Lllp | 0 | −100,00 | 0 | |||||
| 2025-07-24 | 13F | Cyndeo Wealth Partners, LLC | 0 | −100,00 | 0 | |||||
| 2025-08-15 | 13F | Equitable Holdings, Inc. | 14 371 | −34,52 | 682 | −33,98 | ||||
| 2025-07-24 | 13F | Ronald Blue Trust, Inc. | 6 390 | −56,18 | 303 | −55,83 | ||||
| 2025-08-13 | 13F | Rsm Us Wealth Management Llc | 6 225 | 296 | ||||||
| 2025-08-14 | 13F | Betterment LLC | 247 289 | 11,31 | 12 | 10,00 | ||||
| 2025-06-03 | 13F | Invst, LLC | 6 656 | −28,04 | 313 | −27,88 | ||||
| 2025-08-04 | 13F | Assetmark, Inc | 223 929 | −63,04 | 10 631 | −62,74 | ||||
| 2025-04-30 | 13F | Synergy Investment Management, LLC | 0 | −100,00 | 0 | |||||
| 2025-07-14 | 13F | Park Avenue Securities Llc | 57 598 | −61,39 | 3 | −71,43 | ||||
| 2025-08-14 | 13F | JPL Wealth Management, LLC | 8 260 | 5,83 | 392 | 6,81 | ||||
| 2025-07-18 | 13F | Truist Financial Corp | 18 615 | −58,48 | 884 | −58,17 | ||||
| 2025-08-05 | 13F | Sigma Planning Corp | 0 | −100,00 | 0 | |||||
| 2025-08-12 | 13F | Jpmorgan Chase & Co | 225 545 | −57,07 | 10 708 | −56,72 | ||||
| 2025-08-18 | 13F | Geneos Wealth Management Inc. | 635 | −33,44 | 30 | −31,82 |