Grundläggande statistik
| Institutionella ägare | 193 total, 193 long only, 0 short only, 0 long/short - change of −1,52% MRQ |
| Genomsnittlig portföljallokering | 0.1978 % - change of 27,73% MRQ |
| Institutionella aktier (lång) | 85 744 666 (ex 13D/G) - change of 1,16MM shares 1,37% MRQ |
| Institutionellt värde (lång) | $ 1 751 145 USD ($1000) |
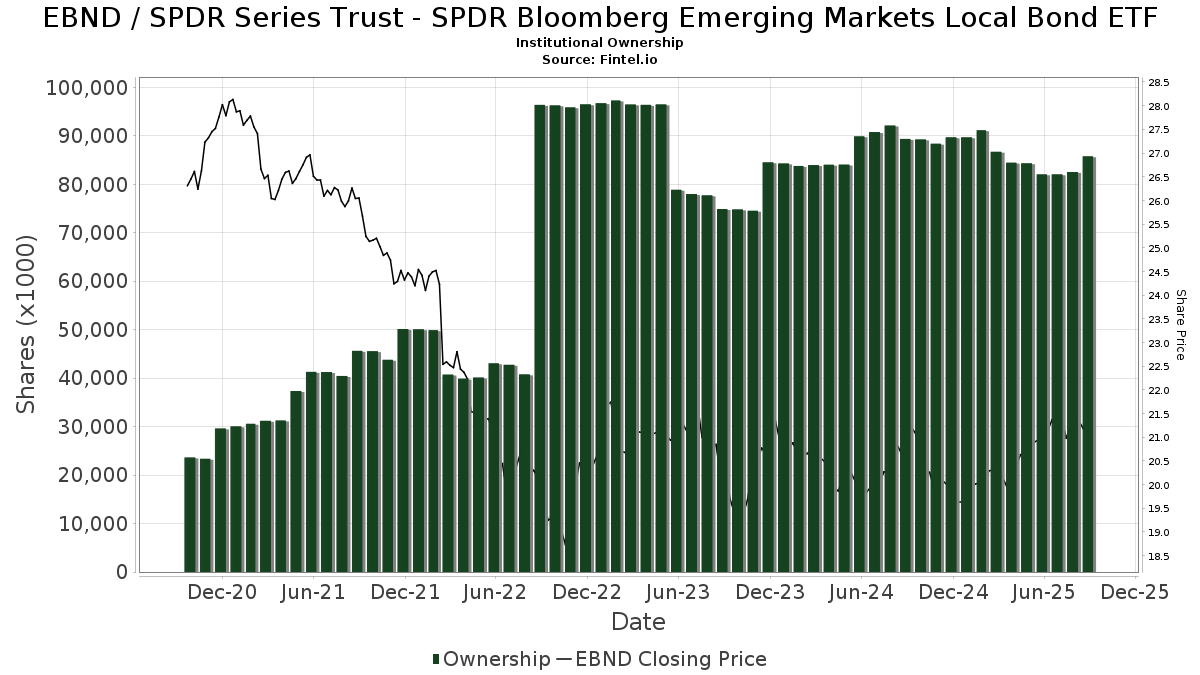
Institutionellt ägande och aktieägare
SPDR Series Trust - SPDR Bloomberg Emerging Markets Local Bond ETF (US:EBND) har 193 Institutionella ägare och aktieägare som har lämnat in 13D/G- eller 13F-formulär till Securities Exchange Commission (SEC). Dessa institut innehar totalt 85,744,666 aktier. Största aktieägare inkluderar Charles Schwab Investment Management Inc, Empower Advisory Group, LLC, Ci Investments Inc., State Street Corp, Brighthouse Funds Trust I - SSGA Growth and Income ETF Portfolio Class A, Sei Investments Co, Envestnet Portfolio Solutions, Inc., Comerica Bank, LPL Financial LLC, and Varma Mutual Pension Insurance Co .
SPDR Series Trust - SPDR Bloomberg Emerging Markets Local Bond ETF (ARCA:EBND) Institutionell ägarstruktur visar institutioners och fonders nuvarande positioner i företaget, samt de senaste förändringarna i positionernas storlek. Större aktieägare kan vara enskilda investerare, fonder, hedgefonder eller institutioner. Bilaga 13D visar att investeraren äger (eller ägde) mer än 5% av företaget och avser (eller avsåg) att aktivt eftersträva en förändring av affärsstrategin. Schedule 13G indikerar en passiv investering på över 5%.
The share price as of September 15, 2025 is 21,49 / share. Previously, on September 16, 2024, the share price was 21,00 / share. This represents an increase of 2,33% over that period.
Fondsentimentets poäng
Fondsentimentet poängen(fka Ägarackumulation-poäng) visar vilka aktier som är mest köpta av fonder. Det är resultatet av en sofistikerad kvantitativ flerfaktormodell som identifierar företag med de högsta nivåerna av institutionell ackumulering. Poängsättningsmodellen använder en kombination av den totala ökningen av redovisade ägare, förändringarna i portföljallokeringarna för dessa ägare och andra mått. Siffran sträcker sig från 0 till 100, där högre siffror indikerar en högre nivå av ackumulering i förhållande till sina konkurrenter, och 50 är genomsnittet.
Uppdateringsfrekvens: Dagligen
Se Ownership Explorer, som innehåller en lista över de högst rankade företagen.
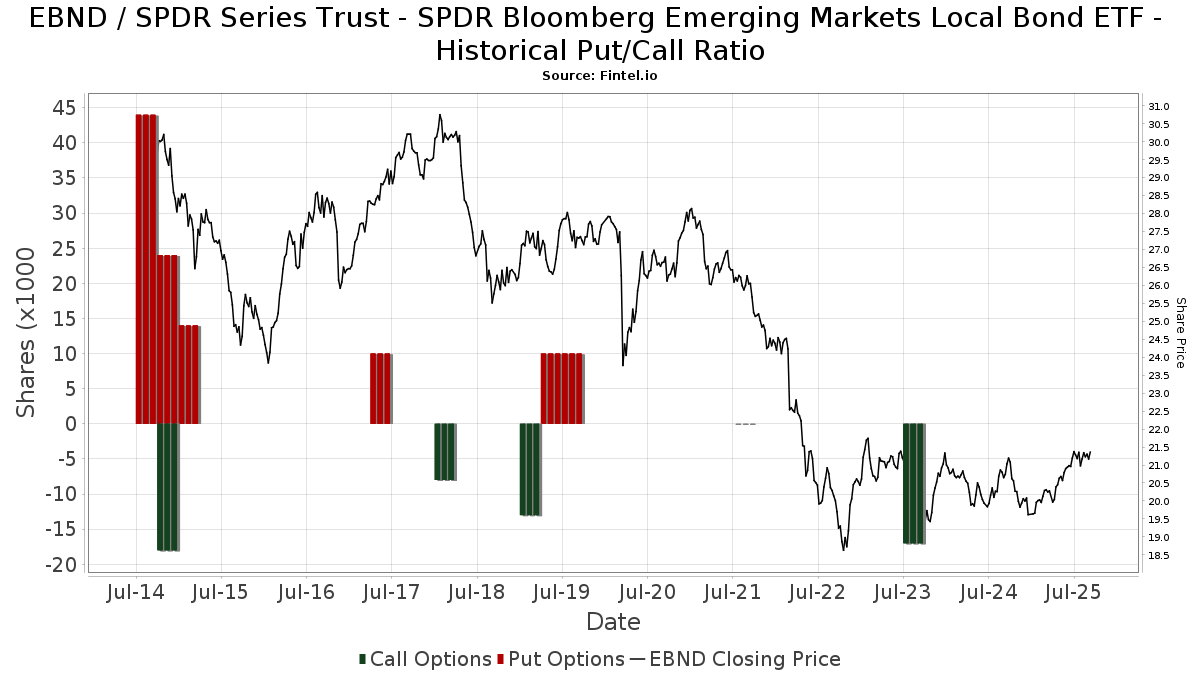
Institutionell sälj/köp-kvot
Förutom att rapportera vanliga eget kapital- och skuldemissioner måste institutioner med mer än 100MM tillgångar under förvaltning också avslöja sina innehav av sälj- och köpoptioner. Eftersom säljoptioner i allmänhet indikerar ett negativt sentiment och köpoptioner indikerar ett positivt sentiment, kan vi få en uppfattning om det övergripande institutionella sentimentet genom att plotta förhållandet mellan säljoptioner och köpoptioner. Diagrammet till höger visar det historiska förhållandet mellan sälj- och köpoptioner för detta instrument.
Genom att använda sälj/köp-kvoten som en indikator på aktieägarnas sentiment undviker man en av de största bristerna med att använda det totala institutionella ägandet, nämligen att en betydande del av de förvaltade tillgångarna investeras passivt för att följa index. Passivt förvaltade fonder köper vanligtvis inte optioner, så indikatorn för sälj/köp-kvoten ger en bättre bild av stämningen i aktivt förvaltade fonder.
13F- och NPORT-arkiveringar
Detaljer om 13F-arkiveringar är gratis. Detaljer om NP-arkiveringar kräver ett premiummedlemskap. Gröna rader indikerar nya positioner. Röda rader indikerar stängda positioner. Klicka på länk symbolen för att se hela transaktionshistoriken.
Uppgradera
för att låsa upp premiumdata och exportera till Excel ![]() .
.
| Fil Datum | Källa | Investerare | Typ | Genomsnittligt pris (beräknat) |
Aktier | Δ Aktier (%) |
Rapporterat värde (1000 USD) |
Δ Värde (%) |
Portföljallokering (%) |
|
|---|---|---|---|---|---|---|---|---|---|---|
| 2025-07-22 | 13F | Iron Horse Wealth Management, LLC | 228 | 0,00 | 5 | 0,00 | ||||
| 2025-08-06 | 13F | Prospera Financial Services Inc | 57 487 | 1 230 | ||||||
| 2025-08-14 | 13F | Wiley Bros.-aintree Capital, Llc | 0 | −100,00 | 0 | |||||
| 2025-08-06 | 13F | First Horizon Advisors, Inc. | 0 | −100,00 | 0 | |||||
| 2025-04-23 | 13F | Walkner Condon Financial Advisors LLC | 0 | −100,00 | 0 | |||||
| 2025-04-29 | 13F | Wood Tarver Financial Group, LLC | 0 | −100,00 | 0 | |||||
| 2025-05-02 | 13F | United Community Bank | 0 | −100,00 | 0 | |||||
| 2025-07-31 | 13F | Leavell Investment Management, Inc. | 39 469 | 7,92 | 845 | 14,99 | ||||
| 2025-08-14 | 13F | TT Capital Management LLC | 10 478 | 216 | ||||||
| 2025-08-01 | 13F | Austin Private Wealth, LLC | 174 244 | 59,46 | 3 729 | 70,00 | ||||
| 2025-07-17 | 13F | Tempus Wealth Planning, LLC | 44 983 | 1,99 | 963 | 8,70 | ||||
| 2025-07-17 | 13F | Raleigh Capital Management Inc. | 48 111 | 3,44 | 1 030 | 10,29 | ||||
| 2025-04-10 | 13F | Contravisory Investment Management, Inc. | 0 | −100,00 | 0 | |||||
| 2025-07-30 | 13F | Bogart Wealth, LLC | 348 | 7 | ||||||
| 2025-08-14 | 13F | Susquehanna International Group, Llp | 0 | −100,00 | 0 | |||||
| 2025-08-12 | 13F | Steward Partners Investment Advisory, Llc | 3 029 | 14,26 | 65 | 20,75 | ||||
| 2025-08-14 | 13F | Treasure Coast Financial Planning | 49 483 | 1,75 | 1 059 | 8,40 | ||||
| 2025-07-18 | 13F | TruNorth Capital Management, LLC | 252 | 0,00 | 5 | 0,00 | ||||
| 2025-07-24 | 13F | IFP Advisors, Inc | 19 093 | −19,89 | 409 | −14,64 | ||||
| 2025-07-25 | 13F | Cwm, Llc | 1 501 | −13,19 | 0 | |||||
| 2025-08-13 | 13F | Mackenzie Financial Corp | 101 793 | 11,89 | 2 178 | 19,34 | ||||
| 2025-08-01 | 13F | Rossby Financial, LCC | 232 | 0,00 | 5 | 0,00 | ||||
| 2025-05-16 | 13F | Ascent Group, LLC | 0 | −100,00 | 0 | |||||
| 2025-08-11 | 13F | Morling Financial Advisors, LLC | 0 | −100,00 | 0 | |||||
| 2025-08-13 | 13F | Providence Capital Advisors, LLC | 379 | 8 | ||||||
| 2025-07-30 | 13F | Bleakley Financial Group, LLC | 48 783 | 101,34 | 1 044 | 114,61 | ||||
| 2025-07-25 | 13F | McNamara Financial Services, Inc. | 44 754 | 1,63 | 958 | 8,38 | ||||
| 2025-08-05 | 13F | Lifeworks Advisors, LLC | 21 104 | −0,87 | 452 | 5,62 | ||||
| 2025-07-28 | 13F | RFG Advisory, LLC | 24 356 | −1,28 | 521 | 5,25 | ||||
| 2025-08-27 | NP | Brighthouse Funds Trust I - SSGA Growth ETF Portfolio Class A | 516 548 | −2,75 | 11 054 | 3,70 | ||||
| 2025-07-31 | 13F | Jackson Hole Capital Partners, LLC | 534 | 0,00 | 11 | 10,00 | ||||
| 2025-07-14 | 13F | Capital CS Group, LLC | 24 677 | −8,11 | 528 | −2,04 | ||||
| 2025-08-12 | 13F | Jpmorgan Chase & Co | 26 242 | 4,51 | 562 | 11,53 | ||||
| 2025-08-11 | 13F | WPG Advisers, LLC | 3 352 | −4,37 | 72 | 1,43 | ||||
| 2025-05-15 | 13F/A | Orion Portfolio Solutions, LLC | 13 641 | −35,49 | 274 | −33,74 | ||||
| 2025-08-12 | 13F | Global Retirement Partners, LLC | 375 | −31,94 | 8 | −20,00 | ||||
| 2025-08-14 | 13F | Citadel Advisors Llc | 0 | −100,00 | 0 | |||||
| 2025-05-02 | 13F | Armor Investment Advisors, LLC | 0 | −100,00 | 0 | |||||
| 2025-05-09 | 13F | NBZ Investment Advisors LLC | 0 | −100,00 | 0 | |||||
| 2025-08-14 | 13F | Transamerica Financial Advisors, Inc. | 167 | 0,00 | 4 | |||||
| 2025-04-15 | 13F | Kelly Financial Services LLC | 0 | −100,00 | 0 | |||||
| 2025-08-01 | 13F | James Investment Research Inc | 10 136 | 217 | ||||||
| 2025-08-14 | 13F | D. E. Shaw & Co., Inc. | 346 600 | 31,44 | 7 417 | 40,15 | ||||
| 2025-05-09 | 13F | GeoWealth Management, LLC | 0 | −100,00 | 0 | |||||
| 2025-07-09 | 13F | Breakwater Investment Management | 4 660 | 0,00 | 100 | 6,45 | ||||
| 2025-07-17 | 13F | Halbert Hargrove Global Advisors, Llc | 0 | −100,00 | 0 | |||||
| 2025-08-06 | 13F | Ironwood Wealth Management, LLC. | 3 441 | 0,00 | 74 | 5,80 | ||||
| 2025-08-08 | 13F | Empower Advisory Group, LLC | 24 148 386 | 3,77 | 516 775 | 10,64 | ||||
| 2025-08-07 | 13F | Allworth Financial LP | 1 420 | −49,88 | 30 | −48,28 | ||||
| 2025-08-05 | 13F | Landmark Wealth Management, Inc. | 53 274 | 5,47 | 1 140 | 12,54 | ||||
| 2025-07-16 | 13F | Perigon Wealth Management, LLC | 78 223 | −0,25 | 1 674 | 6,36 | ||||
| 2025-08-14 | 13F | Smartleaf Asset Management LLC | 1 224 | −9,73 | 26 | −3,70 | ||||
| 2025-08-28 | NP | INKM - SPDR SSGA Income Allocation ETF This fund is a listed as child fund of State Street Corp and if that institution has disclosed ownership in this security, then these positions will not be double counted when calculating total shares and total value | 161 194 | −10,21 | 3 450 | −4,27 | ||||
| 2025-07-24 | 13F | Ronald Blue Trust, Inc. | 279 | 6 | ||||||
| 2025-05-16 | 13F/A | Kestra Investment Management, LLC | 0 | −100,00 | 0 | |||||
| 2025-07-28 | 13F | Harbour Investments, Inc. | 20 819 | 1,37 | 446 | 8,01 | ||||
| 2025-09-15 | 13F/A | Migdal Insurance & Financial Holdings Ltd. | 1 665 | 0,00 | 0 | |||||
| 2025-07-17 | 13F | Wolff Wiese Magana Llc | 14 | 0 | ||||||
| 2025-08-27 | NP | Brighthouse Funds Trust I - SSGA Growth and Income ETF Portfolio Class A | 1 960 870 | −2,72 | 41 963 | 3,73 | ||||
| 2025-08-15 | 13F | Provenance Wealth Advisors, LLC | 0 | −100,00 | 0 | |||||
| 2025-08-12 | 13F | Howe & Rusling Inc | 1 618 | 1 738,64 | 35 | 3 300,00 | ||||
| 2025-08-12 | 13F | Wayfinding Financial, LLC | 0 | −100,00 | 0 | |||||
| 2025-08-12 | 13F | Bokf, Na | 0 | −100,00 | 0 | |||||
| 2025-08-07 | 13F | 1620 Investment Advisors, Inc. | 620 | 0,00 | 13 | 8,33 | ||||
| 2025-09-04 | 13F/A | Advisor Group Holdings, Inc. | 76 668 | 343,65 | 1 578 | 355,78 | ||||
| 2025-07-11 | 13F | Farther Finance Advisors, LLC | 76 408 | −5,01 | 1 635 | 1,74 | ||||
| 2025-07-15 | 13F | Fifth Third Bancorp | 212 | 5 | ||||||
| 2025-08-06 | 13F | Legacy Wealth Managment, LLC/ID | 0 | −100,00 | 0 | |||||
| 2025-07-28 | 13F | Kiker Wealth Management, LLC | 0 | −100,00 | 0 | |||||
| 2025-07-31 | 13F | CNB Bank | 30 | 0,00 | 1 | |||||
| 2025-08-28 | NP | Northern Lights Fund Trust - Sierra Tactical Risk Spectrum 70 Fund Investor Class | 10 600 | 227 | ||||||
| 2025-08-13 | 13F | Avos Capital Management, LLC | 209 014 | 27,23 | 4 473 | 35,68 | ||||
| 2025-08-14 | 13F | Ameriprise Financial Inc | 50 340 | 3,52 | 1 078 | 10,56 | ||||
| 2025-05-14 | 13F | Caitlin John, LLC | 0 | −100,00 | 0 | |||||
| 2025-07-31 | 13F | CVA Family Office, LLC | 13 | 0,00 | 0 | |||||
| 2025-07-16 | 13F | St Germain D J Co Inc | 0 | −100,00 | 0 | |||||
| 2025-05-12 | 13F | Aveo Capital Partners, LLC | 0 | −100,00 | 0 | |||||
| 2025-07-30 | 13F | Exencial Wealth Advisors, Llc | 12 273 | −3,25 | 263 | 3,15 | ||||
| 2025-04-22 | 13F | Castleview Partners, Llc | 0 | −100,00 | 0 | |||||
| 2025-08-14 | 13F | Mariner, LLC | 12 928 | −4,17 | 277 | 2,22 | ||||
| 2025-04-23 | 13F | VisionPoint Advisory Group, LLC | 0 | −100,00 | 0 | |||||
| 2025-08-29 | 13F | Total Investment Management Inc | 86 | 2 | ||||||
| 2025-08-11 | 13F | Aptus Capital Advisors, LLC | 1 401 | 5,18 | 30 | 11,54 | ||||
| 2025-08-29 | 13F | Evolution Wealth Management Inc. | 47 | 1 | ||||||
| 2025-08-14 | 13F | Sei Investments Co | 1 874 342 | −4,02 | 40 112 | 2,36 | ||||
| 2025-05-06 | 13F | USAdvisors Wealth Management, LLC | 0 | −100,00 | 0 | |||||
| 2025-05-15 | 13F | Barclays Plc | 0 | −100,00 | 0 | |||||
| 2025-08-06 | 13F | AE Wealth Management LLC | 12 181 | −0,32 | 261 | 6,12 | ||||
| 2025-05-07 | 13F | Brown Wealth Management, Llc | 0 | −100,00 | 0 | |||||
| 2025-05-09 | 13F | Atria Wealth Solutions, Inc. | 0 | −100,00 | 0 | |||||
| 2025-08-05 | 13F | Dravo Bay Llc | 22 683 | −0,87 | 485 | 5,66 | ||||
| 2025-04-23 | 13F | Golden State Wealth Management, LLC | 0 | −100,00 | 0 | |||||
| 2025-08-08 | 13F | Hibernia Wealth Partners, LLC | 209 403 | 96,36 | 4 481 | 109,39 | ||||
| 2025-05-14 | 13F | Atomi Financial Group, Inc. | 0 | −100,00 | 0 | |||||
| 2025-07-08 | 13F | Parallel Advisors, LLC | 1 040 | −13,62 | 22 | −8,33 | ||||
| 2025-08-12 | 13F | Ci Investments Inc. | 3 325 253 | 305,61 | 71 | 343,75 | ||||
| 2025-05-05 | 13F | Csenge Advisory Group | 0 | −100,00 | 0 | −100,00 | ||||
| 2025-08-12 | 13F | Richard W. Paul & Associates, LLC | 2 927 | −2,92 | 63 | 3,33 | ||||
| 2025-04-10 | 13F | Iams Wealth Management, Llc | 0 | −100,00 | 0 | |||||
| 2025-08-12 | 13F | Summit Global Investments | 228 442 | 6,40 | 5 | 0,00 | ||||
| 2025-08-12 | 13F | Coldstream Capital Management Inc | 0 | −100,00 | 0 | |||||
| 2025-07-10 | 13F | Global Financial Private Client, LLC | 0 | −100,00 | 0 | |||||
| 2025-08-06 | 13F | Commonwealth Equity Services, Llc | 9 913 | 0 | ||||||
| 2025-08-05 | 13F | Bank Of Montreal /can/ | 405 | 63,97 | 9 | 100,00 | ||||
| 2025-07-22 | 13F | Wealthcare Advisory Partners LLC | 0 | −100,00 | 0 | |||||
| 2025-08-15 | 13F | Fsb Premier Wealth Management, Inc. | 17 737 | −0,47 | 380 | 6,16 | ||||
| 2025-08-01 | 13F | Envestnet Asset Management Inc | 478 821 | 4,34 | 10 247 | 11,25 | ||||
| 2025-07-15 | 13F | MCF Advisors LLC | 525 | 0,00 | 11 | 10,00 | ||||
| 2025-08-06 | 13F | Spurstone Advisory Services, LLC | 10 | 0,00 | 0 | |||||
| 2025-05-15 | 13F | Tower Research Capital LLC (TRC) | 0 | −100,00 | 0 | |||||
| 2025-08-08 | 13F | Larson Financial Group LLC | 2 198 | 4 784,44 | 47 | |||||
| 2025-08-01 | 13F | Red Lighthouse Investment Management, Llc | 29 427 | −55,69 | 630 | −53,78 | ||||
| 2025-06-30 | 13F/A | Deutsche Bank Ag\ | 0 | −100,00 | 0 | |||||
| 2025-08-15 | 13F | Morgan Stanley | 48 390 | 4,49 | 1 036 | 11,41 | ||||
| 2025-08-14 | 13F | Jane Street Group, Llc | 0 | −100,00 | 0 | |||||
| 2025-05-15 | 13F | Old Mission Capital Llc | 0 | −100,00 | 0 | |||||
| 2025-07-25 | 13F | Richardson Financial Services Inc. | 6 821 | −15,51 | 145 | −10,49 | ||||
| 2025-08-08 | 13F | Capital Investment Advisory Services, LLC | 215 | 0,47 | 5 | 0,00 | ||||
| 2025-08-12 | 13F | AlphaCore Capital LLC | 415 | 134,46 | 9 | 166,67 | ||||
| 2025-08-14 | 13F | Stonehaven Wealth & Tax Solutions, Llc | 19 886 | 13,48 | 426 | 21,08 | ||||
| 2025-07-17 | 13F | Keystone Global Partners, LLC | 0 | −100,00 | 0 | |||||
| 2025-08-12 | 13F | Charles Schwab Investment Management Inc | 40 552 150 | −3,95 | 867 816 | 2,42 | ||||
| 2025-08-13 | 13F | Safe Harbor Fiduciary, LLC | 141 | 3,68 | 3 | 50,00 | ||||
| 2025-07-18 | 13F | Bartlett & Co. Wealth Management Llc | 254 | 0,00 | 5 | 0,00 | ||||
| 2025-08-14 | 13F | GWM Advisors LLC | 85 757 | 1,05 | 1 835 | 7,75 | ||||
| 2025-04-29 | 13F | Element Wealth, LLC | 0 | −100,00 | 0 | |||||
| 2025-05-14 | 13F | Van Hulzen Asset Management, LLC | 0 | −100,00 | 0 | |||||
| 2025-08-13 | 13F | Jones Financial Companies Lllp | 1 397 | 95,11 | 30 | 107,14 | ||||
| 2025-08-14 | 13F | Boston Private Wealth Llc | 0 | −100,00 | 0 | |||||
| 2025-08-19 | 13F | Cape Investment Advisory, Inc. | 6 | 0,00 | 0 | |||||
| 2025-05-16 | 13F | Coppell Advisory Solutions LLC | 0 | −100,00 | 0 | |||||
| 2025-08-14 | 13F | Guardian Wealth Advisors, Llc / Nc | 0 | −100,00 | 0 | |||||
| 2025-08-13 | 13F | Hsbc Holdings Plc | 281 807 | 0,23 | 6 031 | 6,86 | ||||
| 2025-08-12 | 13F | Founders Financial Alliance, LLC | 66 | 0,00 | 1 | 0,00 | ||||
| 2025-08-04 | 13F | Creative Financial Designs Inc /adv | 7 341 | 50,80 | 157 | 61,86 | ||||
| 2025-08-04 | 13F | Hantz Financial Services, Inc. | 0 | 0 | ||||||
| 2025-08-15 | 13F | Binnacle Investments Inc | 945 | −1,36 | 20 | 5,26 | ||||
| 2025-07-24 | 13F | Us Bancorp \de\ | 239 | −82,18 | 5 | −80,77 | ||||
| 2025-07-14 | 13F | Farmers & Merchants Investments Inc | 0 | −100,00 | 0 | |||||
| 2025-07-30 | 13F | First Citizens Bank & Trust Co | 144 386 | 37,41 | 3 090 | 46,54 | ||||
| 2025-05-15 | 13F | Rakuten Investment Management, Inc. | 29 340 | 587 | ||||||
| 2025-08-11 | 13F | Citigroup Inc | 37 | −77,58 | 1 | −100,00 | ||||
| 2025-08-12 | 13F | CIBC Private Wealth Group, LLC | 178 | −94,79 | 4 | −95,45 | ||||
| 2025-07-14 | 13F | AdvisorNet Financial, Inc | 450 | 0,00 | 10 | 0,00 | ||||
| 2025-07-22 | 13F | Merit Financial Group, LLC | 82 535 | 195,31 | 1 766 | 215,36 | ||||
| 2025-07-29 | 13F | Balboa Wealth Partners | 10 511 | 0,04 | 225 | 6,67 | ||||
| 2025-07-24 | 13F | Blair William & Co/il | 126 | 0,80 | 3 | 0,00 | ||||
| 2025-08-14 | 13F | Novus Advisors, Llc | 18 743 | −4,31 | 401 | 2,04 | ||||
| 2025-08-05 | 13F | Westside Investment Management, Inc. | 214 | 0,00 | 5 | 0,00 | ||||
| 2025-08-13 | 13F | Northwestern Mutual Wealth Management Co | 1 815 | −14,83 | 39 | −9,52 | ||||
| 2025-07-23 | 13F | West Paces Advisors Inc. | 0 | −100,00 | 0 | |||||
| 2025-07-10 | 13F | Sharkey, Howes & Javer | 58 159 | −8,88 | 1 245 | −2,81 | ||||
| 2025-07-30 | 13F | Eqis Capital Management, Inc. | 13 995 | −5,87 | 299 | 0,34 | ||||
| 2025-08-05 | 13F | Integrity Financial Corp /WA | 4 | 0,00 | 0 | |||||
| 2025-07-23 | 13F | Valmark Advisers, Inc. | 290 665 | 4,31 | 6 220 | 11,23 | ||||
| 2025-03-24 | 13F | Mascagni Wealth Management, Inc. | 1 036 | 20 | ||||||
| 2025-08-01 | 13F | Solstein Capital, LLC | 17 | 0 | ||||||
| 2025-08-14 | 13F | Wells Fargo & Company/mn | 303 319 | 19,70 | 6 491 | 27,65 | ||||
| 2025-08-07 | 13F | Varma Mutual Pension Insurance Co | 700 000 | 250,00 | 14 980 | 273,19 | ||||
| 2025-08-05 | 13F | Key FInancial Inc | 0 | −100,00 | 0 | |||||
| 2025-08-14 | 13F | Raymond James Financial Inc | 14 024 | −16,27 | 300 | −10,71 | ||||
| 2025-08-12 | 13F | Argent Trust Co | 12 243 | −1,91 | 262 | 4,80 | ||||
| 2025-05-01 | 13F | Quest 10 Wealth Builders, Inc. | 18 | −98,83 | 0 | −100,00 | ||||
| 2025-08-11 | 13F | TD Waterhouse Canada Inc. | 1 960 | 0,00 | 42 | 5,13 | ||||
| 2025-08-14 | 13F | DecisionPoint Financial, LLC | 62 | 1 | ||||||
| 2025-08-11 | 13F | Elequin Capital Lp | 6 317 | 135 | ||||||
| 2025-05-22 | 13F | Mattson Financial Services, LLC | 0 | −100,00 | 0 | |||||
| 2025-08-11 | 13F | Hexagon Capital Partners LLC | 0 | −100,00 | 0 | |||||
| 2025-05-14 | 13F | Truvestments Capital Llc | 0 | −100,00 | 0 | |||||
| 2025-07-14 | 13F | Pacifica Partners Inc. | 1 335 | 0,00 | 28 | 7,69 | ||||
| 2025-08-13 | 13F | Baird Financial Group, Inc. | 0 | −100,00 | 0 | −100,00 | ||||
| 2025-08-04 | 13F | Assetmark, Inc | 288 146 | −2,63 | 6 166 | 3,82 | ||||
| 2025-08-14 | 13F | CoreCap Advisors, LLC | 6 202 | 70,67 | 133 | 83,33 | ||||
| 2025-07-14 | 13F | Park Avenue Securities Llc | 253 555 | −1,27 | 5 | 0,00 | ||||
| 2025-07-22 | 13F | Simplicity Wealth,LLC | 43 782 | 937 | ||||||
| 2025-08-14 | 13F | UBS Group AG | 143 152 | 5,20 | 3 063 | 12,16 | ||||
| 2025-05-16 | 13F | Financial Strategies Group, Inc. | 0 | −100,00 | 0 | |||||
| 2025-07-07 | 13F | Upper Left Wealth Management, LLC | 26 192 | −3,08 | 561 | 3,32 | ||||
| 2025-08-11 | 13F | Strategic Wealth Partners, Ltd. | 220 | 5 | ||||||
| 2025-08-14 | 13F | Ancora Advisors, LLC | 0 | −100,00 | 0 | |||||
| 2025-08-15 | 13F | Equitable Holdings, Inc. | 41 968 | 33,26 | 898 | 42,09 | ||||
| 2025-08-11 | 13F | Principal Securities, Inc. | 2 523 | −42,53 | 54 | −37,65 | ||||
| 2025-07-15 | 13F | Genesis Wealth Advisors, LLC | 183 145 | 3,78 | 3 919 | 10,67 | ||||
| 2025-07-28 | 13F | Axxcess Wealth Management, Llc | 10 379 | −1,22 | 222 | 5,71 | ||||
| 2025-08-13 | 13F | Continuum Advisory, LLC | 0 | −100,00 | 0 | |||||
| 2025-08-14 | 13F | First Citizens Asset Management, Inc. | 0 | −100,00 | 0 | |||||
| 2025-08-11 | 13F | Covestor Ltd | 13 | −7,14 | 0 | |||||
| 2025-08-12 | 13F | Proequities, Inc. | 0 | 0 | ||||||
| 2025-07-31 | 13F/A | Avion Wealth | 251 | 0,00 | 0 | |||||
| 2025-08-28 | NP | GAL - SPDR SSGA Global Allocation ETF This fund is a listed as child fund of State Street Corp and if that institution has disclosed ownership in this security, then these positions will not be double counted when calculating total shares and total value | 182 180 | 0,61 | 3 899 | 7,26 | ||||
| 2025-08-11 | 13F | HighTower Advisors, LLC | 54 983 | 2,53 | 1 177 | 9,29 | ||||
| 2025-08-05 | 13F | Huntington National Bank | 10 | |||||||
| 2025-08-11 | 13F | Synergy Investment Management, LLC | 0 | −100,00 | 0 | |||||
| 2025-08-13 | 13F | Townsquare Capital Llc | 0 | −100,00 | 0 | |||||
| 2025-08-14 | 13F | Sunbelt Securities, Inc. | 30 | 0,00 | 1 | |||||
| 2025-07-31 | 13F | Optimum Investment Advisors | 728 | −4,84 | 16 | 0,00 | ||||
| 2025-08-08 | 13F | SBI Securities Co., Ltd. | 9 460 | 464,44 | 202 | 512,12 | ||||
| 2025-08-07 | 13F | LFA - Lugano Financial Advisors SA | 7 185 | 0,00 | 152 | 5,56 | ||||
| 2025-08-08 | 13F | Creative Planning | 24 683 | −8,10 | 528 | −2,04 | ||||
| 2025-07-10 | 13F | Signal Advisors Wealth, LLC | 30 991 | −30,80 | 663 | −26,17 | ||||
| 2025-08-11 | 13F | FSA Wealth Management LLC | 414 | 546,88 | 9 | 700,00 | ||||
| 2025-08-14 | 13F | Comerica Bank | 791 121 | 15 659,38 | 16 930 | 16 829,00 | ||||
| 2025-08-11 | 13F | Private Advisor Group, LLC | 0 | −100,00 | 0 | |||||
| 2025-08-27 | 13F/A | Brinker Capital Investments, LLC | 20 332 | 49,05 | 435 | 59,34 | ||||
| 2025-07-16 | 13F | Highline Wealth Partners Llc | 33 | 1 | ||||||
| 2025-08-08 | 13F | Pnc Financial Services Group, Inc. | 2 880 | −14,69 | 62 | −8,96 | ||||
| 2025-08-15 | 13F | Kestra Advisory Services, LLC | 16 459 | 352 | ||||||
| 2025-08-08 | 13F | Cetera Investment Advisers | 86 875 | 10,28 | 1 859 | 17,58 | ||||
| 2025-05-15 | 13F | Human Investing LLC | 0 | −100,00 | 0 | |||||
| 2025-07-16 | 13F | Diversified Enterprises, LLC | 16 059 | −0,21 | 344 | 6,52 | ||||
| 2025-07-14 | 13F | Hoey Investments, Inc | 483 | 10 | ||||||
| 2025-07-18 | 13F | Lockerman Financial Group, Inc. | 11 838 | 7,46 | 253 | 14,48 | ||||
| 2025-08-08 | 13F | Tortoise Investment Management, LLC | 4 050 | 0,00 | 87 | 6,17 | ||||
| 2025-08-07 | 13F | CENTRAL TRUST Co | 6 | 0 | ||||||
| 2025-05-09 | 13F | Goldman Sachs Group Inc | 0 | −100,00 | 0 | |||||
| 2025-07-21 | 13F | Rainey & Randall Investment Management Inc. | 46 538 | 3,66 | 996 | 10,43 | ||||
| 2025-07-25 | 13F | NorthRock Partners, LLC | 266 | 0,38 | 6 | 0,00 | ||||
| 2025-08-28 | NP | SSIZX - Sierra Tactical Core Income Fund Class A Shares | 348 300 | 7 454 | ||||||
| 2025-07-23 | 13F | REAP Financial Group, LLC | 111 | 0,00 | 2 | 0,00 | ||||
| 2025-08-12 | 13F | LPL Financial LLC | 753 921 | −12,08 | 16 134 | −6,26 | ||||
| 2025-07-08 | 13F | Lowe Wealth Advisors, LLC | 1 040 | 0,00 | 22 | 10,00 | ||||
| 2025-07-30 | 13F | Fairway Wealth LLC | 0 | −100,00 | 0 | |||||
| 2025-08-07 | 13F | Winthrop Capital Management, LLC | 41 | 0,00 | 0 | |||||
| 2025-08-14 | 13F | State Street Corp | 2 595 955 | −15,51 | 55 553 | −9,91 | ||||
| 2025-07-31 | 13F | City State Bank | 205 414 | 0,01 | 4 396 | 6,62 | ||||
| 2025-07-10 | 13F | Wealth Enhancement Advisory Services, Llc | 39 819 | −5,27 | 851 | 0,83 | ||||
| 2025-08-26 | NP | BNGLX - Ubs Global Allocation Fund Class A | 274 954 | 5 884 | ||||||
| 2025-07-29 | NP | SGPGX - SGI Prudent Growth Fund Class I Shares | 33 790 | 14,00 | 706 | 18,69 | ||||
| 2025-08-12 | 13F | MAI Capital Management | 20 | −84,85 | 0 | −100,00 | ||||
| 2025-08-04 | 13F | MeadowBrook Investment Advisors LLC | 1 176 | 25 | ||||||
| 2025-08-04 | 13F | Econ Financial Services Corp | 102 446 | −15,00 | 2 192 | −9,35 | ||||
| 2025-08-12 | 13F | O'shaughnessy Asset Management, Llc | 231 | 0,43 | 5 | 0,00 | ||||
| 2025-04-22 | 13F | Synergy Financial Management, LLC | 0 | −100,00 | 0 | |||||
| 2025-08-14 | 13F | Bank Of America Corp /de/ | 487 775 | 29,86 | 10 438 | 38,47 | ||||
| 2025-05-12 | 13F | Sandy Spring Bank | 0 | −100,00 | 0 | |||||
| 2025-07-29 | 13F | Stratos Wealth Partners, LTD. | 30 504 | −32,26 | 653 | −27,80 | ||||
| 2025-08-11 | 13F | Brown Brothers Harriman & Co | 12 | 0 | ||||||
| 2025-08-13 | 13F | EverSource Wealth Advisors, LLC | 14 | 0 | ||||||
| 2025-07-07 | 13F | Investors Research Corp | 139 | 0,00 | 3 | 0,00 | ||||
| 2025-07-29 | 13F | Private Trust Co Na | 217 | −3,12 | 5 | 0,00 | ||||
| 2025-05-09 | 13F | Investment Counsel Co Of Nevada | 0 | −100,00 | 0 | |||||
| 2025-08-14 | 13F | Mercer Global Advisors Inc /adv | 11 310 | −34,58 | 242 | −30,06 | ||||
| 2025-05-14 | 13F | Flow Traders U.s. Llc | 0 | −100,00 | 0 | |||||
| 2025-05-14 | 13F | BOK Financial Private Wealth, Inc. | 0 | −100,00 | 0 | |||||
| 2025-07-22 | 13F | Aspire Private Capital, LLC | 135 854 | −0,07 | 2 907 | 6,56 | ||||
| 2025-07-17 | 13F | Capital Insight Partners, Llc | 0 | −100,00 | 0 | |||||
| 2025-08-14 | 13F | Bnp Paribas Arbitrage, Sa | 122 | 3 | ||||||
| 2025-08-12 | 13F | SRS Capital Advisors, Inc. | 731 | 0,00 | 16 | 7,14 | ||||
| 2025-07-25 | 13F | Envestnet Portfolio Solutions, Inc. | 804 720 | 7,28 | 17 221 | 14,39 | ||||
| 2025-08-14 | 13F | Royal Bank Of Canada | 21 050 | 12,38 | 450 | 19,68 | ||||
| 2025-08-12 | 13F | Change Path, LLC | 14 832 | 9,13 | 317 | 16,54 | ||||
| 2025-08-13 | 13F | Transce3nd, LLC | 336 | 86,67 | 7 | 133,33 | ||||
| 2025-08-14 | 13F | Glenmede Investment Management, LP | 232 | 5 | ||||||
| 2025-07-17 | 13F | K2 Financial Inc. | 11 240 | −1,07 | 237 | 2,16 | ||||
| 2025-07-31 | 13F | Wealthfront Advisers Llc | 45 603 | 197,71 | 976 | 217,59 | ||||
| 2025-07-24 | 13F | rebel Financial LLC | 230 338 | 4 929 | ||||||
| 2025-07-07 | 13F | Versant Capital Management, Inc | 4 298 | 0,00 | 92 | 5,81 | ||||
| 2025-08-14 | 13F | Fmr Llc | 6 762 | 23,46 | 145 | 32,11 | ||||
| 2025-05-02 | 13F | Transcendent Capital Group LLC | 0 | −100,00 | 0 | |||||
| 2025-07-18 | 13F | USA Financial Portformulas Corp | 45 692 | 978 | ||||||
| 2025-08-05 | 13F | Fourth Dimension Wealth, LLC | 34 331 | 12,31 | 735 | 19,74 | ||||
| 2025-08-08 | 13F | Hartland & Co., LLC | 93 | 0,00 | 2 | 0,00 | ||||
| 2025-08-14 | 13F | EP Wealth Advisors, Inc. | 0 | −100,00 | 0 | |||||
| 2025-08-18 | 13F | Geneos Wealth Management Inc. | 17 523 | −6,97 | 375 | −1,06 | ||||
| 2025-07-29 | 13F | Salomon & Ludwin, LLC | 31 | 0,00 | 1 | |||||
| 2025-07-31 | 13F | Cambridge Investment Research Advisors, Inc. | 85 140 | 9,48 | 2 | 0,00 | ||||
| 2025-07-15 | 13F | Financial Management Professionals, Inc. | 31 | 0,00 | 1 | |||||
| 2025-08-13 | 13F | Capital Analysts, Inc. | 2 038 | −0,20 | 0 |
Other Listings
| MX:EBND |