Grundläggande statistik
| Institutionella ägare | 146 total, 146 long only, 0 short only, 0 long/short - change of 5,04% MRQ |
| Genomsnittlig portföljallokering | 0.3697 % - change of 2,68% MRQ |
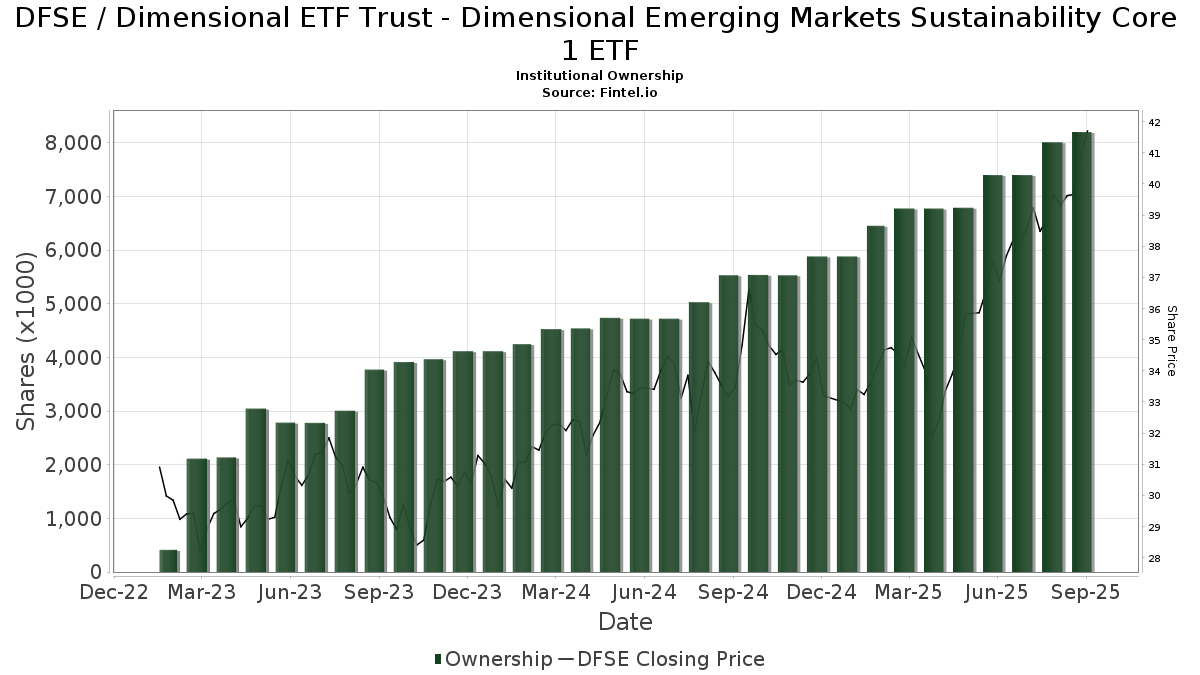
| Institutionella aktier (lång) | 8 202 538 (ex 13D/G) - change of 0,80MM shares 10,84% MRQ |
| Institutionellt värde (lång) | $ 303 830 USD ($1000) |
Institutionellt ägande och aktieägare
Dimensional ETF Trust - Dimensional Emerging Markets Sustainability Core 1 ETF (US:DFSE) har 146 Institutionella ägare och aktieägare som har lämnat in 13D/G- eller 13F-formulär till Securities Exchange Commission (SEC). Dessa institut innehar totalt 8,202,538 aktier. Största aktieägare inkluderar Awm Capital, Llc, Quantum Financial Advisors, LLC, Maseco Llp, Colony Group, LLC, Forum Financial Management, LP, Five Oceans Advisors, Abacus Wealth Partners, LLC, Citrine Capital LLC, LongView Asset Management LLC, and Retirement Solution Inc. .
Dimensional ETF Trust - Dimensional Emerging Markets Sustainability Core 1 ETF (ARCA:DFSE) Institutionell ägarstruktur visar institutioners och fonders nuvarande positioner i företaget, samt de senaste förändringarna i positionernas storlek. Större aktieägare kan vara enskilda investerare, fonder, hedgefonder eller institutioner. Bilaga 13D visar att investeraren äger (eller ägde) mer än 5% av företaget och avser (eller avsåg) att aktivt eftersträva en förändring av affärsstrategin. Schedule 13G indikerar en passiv investering på över 5%.
The share price as of September 16, 2025 is 41,54 / share. Previously, on September 17, 2024, the share price was 33,49 / share. This represents an increase of 24,04% over that period.
Fondsentimentets poäng
Fondsentimentet poängen(fka Ägarackumulation-poäng) visar vilka aktier som är mest köpta av fonder. Det är resultatet av en sofistikerad kvantitativ flerfaktormodell som identifierar företag med de högsta nivåerna av institutionell ackumulering. Poängsättningsmodellen använder en kombination av den totala ökningen av redovisade ägare, förändringarna i portföljallokeringarna för dessa ägare och andra mått. Siffran sträcker sig från 0 till 100, där högre siffror indikerar en högre nivå av ackumulering i förhållande till sina konkurrenter, och 50 är genomsnittet.
Uppdateringsfrekvens: Dagligen
Se Ownership Explorer, som innehåller en lista över de högst rankade företagen.
Institutionell sälj/köp-kvot
Förutom att rapportera vanliga eget kapital- och skuldemissioner måste institutioner med mer än 100MM tillgångar under förvaltning också avslöja sina innehav av sälj- och köpoptioner. Eftersom säljoptioner i allmänhet indikerar ett negativt sentiment och köpoptioner indikerar ett positivt sentiment, kan vi få en uppfattning om det övergripande institutionella sentimentet genom att plotta förhållandet mellan säljoptioner och köpoptioner. Diagrammet till höger visar det historiska förhållandet mellan sälj- och köpoptioner för detta instrument.
Genom att använda sälj/köp-kvoten som en indikator på aktieägarnas sentiment undviker man en av de största bristerna med att använda det totala institutionella ägandet, nämligen att en betydande del av de förvaltade tillgångarna investeras passivt för att följa index. Passivt förvaltade fonder köper vanligtvis inte optioner, så indikatorn för sälj/köp-kvoten ger en bättre bild av stämningen i aktivt förvaltade fonder.
13F- och NPORT-arkiveringar
Detaljer om 13F-arkiveringar är gratis. Detaljer om NP-arkiveringar kräver ett premiummedlemskap. Gröna rader indikerar nya positioner. Röda rader indikerar stängda positioner. Klicka på länk symbolen för att se hela transaktionshistoriken.
Uppgradera
för att låsa upp premiumdata och exportera till Excel ![]() .
.
| Fil Datum | Källa | Investerare | Typ | Genomsnittligt pris (beräknat) |
Aktier | Δ Aktier (%) |
Rapporterat värde (1000 USD) |
Δ Värde (%) |
Portföljallokering (%) |
|
|---|---|---|---|---|---|---|---|---|---|---|
| 2025-07-11 | 13F | Farther Finance Advisors, LLC | 16 222 | 1,66 | 617 | 14,26 | ||||
| 2025-08-14 | 13F | GWM Advisors LLC | 12 071 | 0,02 | 459 | 13,05 | ||||
| 2025-09-04 | 13F/A | Advisor Group Holdings, Inc. | 1 559 | 0,00 | 59 | 13,46 | ||||
| 2025-07-23 | 13F | Quarry Hill Advisors, Llc | 30 796 | 6,98 | 1 172 | 20,95 | ||||
| 2025-07-31 | 13F | Aspen Capital Management, LLC | 18 254 | 695 | ||||||
| 2025-07-10 | 13F | Wealth Enhancement Advisory Services, Llc | 96 572 | −3,17 | 3 712 | 10,51 | ||||
| 2025-08-11 | 13F | von Borstel & Associates, Inc. | 0 | −100,00 | 0 | |||||
| 2025-07-15 | 13F | Cordant, Inc. | 32 121 | −2,96 | 1 223 | 9,69 | ||||
| 2025-07-28 | 13F | Harbour Investments, Inc. | 9 453 | 5,38 | 360 | 18,87 | ||||
| 2025-07-15 | 13F | Level Financial Advisors, Inc. | 7 996 | 8,36 | 304 | 22,58 | ||||
| 2025-07-25 | 13F | Apollon Wealth Management, LLC | 6 890 | 0,00 | 262 | 12,93 | ||||
| 2025-07-08 | 13F | Henrickson Nauta Wealth Advisors, Inc. | 17 625 | 1,08 | 671 | 22,71 | ||||
| 2025-07-31 | 13F | Brighton Jones Llc | 71 492 | 10,87 | 2 721 | 25,29 | ||||
| 2025-08-11 | 13F | Babb Wealth Advisors LLC | 9 272 | 0,21 | 353 | 13,18 | ||||
| 2025-07-18 | 13F | Pure Financial Advisors, Inc. | 72 913 | 64,20 | 2 775 | 85,62 | ||||
| 2025-07-03 | 13F | Fiduciary Financial Group, Llc | 8 849 | 6,99 | 337 | 30,12 | ||||
| 2025-08-12 | 13F | Passive Capital Management, LLC. | 0 | −100,00 | 0 | |||||
| 2025-07-29 | 13F | Flagstone Financial Management | 8 359 | 10,97 | 318 | 25,69 | ||||
| 2025-08-11 | 13F | Compass Capital Corp /ma/ /adv | 6 247 | −1,73 | 244 | 18,54 | ||||
| 2025-08-15 | 13F | North Ridge Wealth Advisors, Inc. | 11 204 | −10,58 | 426 | 1,19 | ||||
| 2025-07-25 | 13F | Wealth Architects, LLC | 141 811 | 17,29 | 5 397 | 32,54 | ||||
| 2025-07-31 | 13F | Buckingham Strategic Partners | 46 573 | −2,55 | 1 773 | 10,13 | ||||
| 2025-08-07 | 13F | Allworth Financial LP | 3 900 | 0,46 | 148 | 12,98 | ||||
| 2025-08-07 | 13F | Addison Advisors LLC | 21 443 | 3,44 | 816 | 16,91 | ||||
| 2025-05-12 | 13F | Citigroup Inc | 0 | −100,00 | 0 | |||||
| 2025-08-12 | 13F | Cook Wealth Management Group Llc | 0 | −100,00 | 0 | |||||
| 2025-07-22 | 13F | Awm Capital, Llc | 627 225 | −28,90 | 23 872 | −19,66 | ||||
| 2025-08-08 | 13F | Truepoint, Inc. | 31 701 | −4,34 | 1 207 | 8,06 | ||||
| 2025-08-07 | 13F | Nwam Llc | 19 553 | −15,23 | 744 | −4,12 | ||||
| 2025-08-15 | 13F | CI Private Wealth, LLC | 33 684 | −49,00 | 1 282 | −42,36 | ||||
| 2025-09-09 | 13F | Cambridge Financial Group, LLC | 23 530 | −29,54 | 896 | −20,52 | ||||
| 2025-07-22 | 13F | Simplicity Wealth,LLC | 0 | −100,00 | 0 | |||||
| 2025-07-23 | 13F | Heck Capital Advisors, LLC | 11 517 | −0,04 | 438 | 12,89 | ||||
| 2025-08-14 | 13F | Colony Group, LLC | 537 973 | 71,98 | 20 475 | 94,35 | ||||
| 2025-07-16 | 13F | Strategic Investment Solutions, Inc. /IL | 77 | 1,32 | 3 | 0,00 | ||||
| 2025-08-01 | 13F | Envestnet Asset Management Inc | 6 315 | 240 | ||||||
| 2025-08-12 | 13F | Proequities, Inc. | 0 | 0 | ||||||
| 2025-08-14 | 13F | Jane Street Group, Llc | 187 337 | −6,83 | 7 130 | 5,29 | ||||
| 2025-08-06 | 13F | Modera Wealth Management, LLC | 16 745 | −0,58 | 637 | 12,35 | ||||
| 2025-05-02 | 13F | MB Generational Wealth, LLC | 16 780 | −5,07 | 565 | −3,42 | ||||
| 2025-08-01 | 13F | Financial Counselors Inc | 0 | −100,00 | 0 | |||||
| 2025-08-13 | 13F | Cerity Partners LLC | 29 778 | 1 168 | ||||||
| 2025-07-14 | 13F | Northland Capital Management LLC | 21 400 | 1,46 | 814 | 14,65 | ||||
| 2025-07-25 | 13F | Sequoia Financial Advisors, LLC | 15 102 | 0,31 | 575 | 13,21 | ||||
| 2025-08-01 | 13F | Cobblestone Capital Advisors Llc /ny/ | 5 422 | 206 | ||||||
| 2025-08-06 | 13F | Savant Capital, LLC | 126 792 | 2,73 | 4 826 | 16,10 | ||||
| 2025-08-06 | 13F | North Capital, Inc. | 1 000 | −50,00 | 38 | −43,28 | ||||
| 2025-07-31 | 13F | LongView Asset Management LLC | 264 706 | 21,44 | 10 075 | 37,23 | ||||
| 2025-07-16 | 13F | Jentner Corp | 8 551 | 3,34 | 325 | 16,91 | ||||
| 2025-07-24 | 13F | Wealth Advisors Northwest LLC | 6 631 | 4,10 | 252 | 17,76 | ||||
| 2025-08-12 | 13F | Jpmorgan Chase & Co | 961 | 8,47 | 37 | 24,14 | ||||
| 2025-08-14 | 13F | Fmr Llc | 32 | 1 | ||||||
| 2025-08-11 | 13F | Rockbridge Investment Management, LCC | 13 482 | −7,10 | 513 | 5,12 | ||||
| 2025-08-14 | 13F | Navigoe, LLC | 34 734 | 0,00 | 1 | 0,00 | ||||
| 2025-07-17 | 13F | Vermillion Wealth Management, Inc. | 4 102 | 6,82 | 156 | 20,93 | ||||
| 2025-07-30 | 13F | Rehmann Capital Advisory Group | 7 255 | 0,00 | 276 | 13,11 | ||||
| 2025-08-12 | 13F | LPL Financial LLC | 12 032 | 44,93 | 458 | 63,80 | ||||
| 2025-08-14 | 13F | EP Wealth Advisors, Inc. | 16 707 | −20,97 | 636 | −10,69 | ||||
| 2025-07-16 | 13F | Signature Resources Capital Management, LLC | 75 | 3 | ||||||
| 2025-08-11 | 13F | HighTower Advisors, LLC | 7 766 | 296 | ||||||
| 2025-08-01 | 13F | Equita Financial Network, Inc. | 12 747 | 93,93 | 485 | 119,46 | ||||
| 2025-08-13 | 13F | Parkworth Wealth Management, Inc. | 3 405 | 4,03 | 130 | 17,27 | ||||
| 2025-07-21 | 13F | Trellis Wealth Advisors LLC | 16 284 | 0,66 | 620 | 13,79 | ||||
| 2025-07-25 | 13F | RHS Financial, LLC | 9 308 | −19,28 | 354 | −8,76 | ||||
| 2025-08-14 | 13F | Old Mission Capital Llc | 207 019 | 7 879 | ||||||
| 2025-04-17 | 13F | Vista Wealth Management Group, LLC | 210 308 | 1,91 | 7 083 | 3,61 | ||||
| 2025-07-14 | 13F | Abacus Wealth Partners, LLC | 336 694 | −35,93 | 12 815 | −27,60 | ||||
| 2025-08-07 | 13F | Midwest Trust Co | 6 253 | 238 | ||||||
| 2025-08-05 | 13F | Allodium Investment Consultants, LLC | 60 540 | −0,95 | 2 304 | 11,95 | ||||
| 2025-07-15 | 13F | Maseco Llp | 548 175 | 20 864 | ||||||
| 2025-08-15 | 13F | WealthCollab, LLC | 1 467 | 0,00 | 56 | 12,24 | ||||
| 2025-08-11 | 13F | Morling Financial Advisors, LLC | 19 960 | 0,08 | 760 | 13,11 | ||||
| 2025-08-04 | 13F | Syverson Strege & Co | 14 790 | 0,04 | 563 | 13,08 | ||||
| 2025-07-31 | 13F | Orion Capital Management LLC | 2 315 | −12,01 | 88 | 0,00 | ||||
| 2025-07-30 | 13F | Exencial Wealth Advisors, Llc | 14 563 | 0,00 | 554 | 13,06 | ||||
| 2025-07-29 | 13F | Wealthstream Advisors, Inc. | 12 892 | 6,24 | 491 | 20,10 | ||||
| 2025-08-11 | 13F | Aptus Capital Advisors, LLC | 55 | 0,00 | 2 | 100,00 | ||||
| 2025-08-13 | 13F | Momentous Wealth Management, Inc. | 21 636 | 7,88 | 823 | 21,93 | ||||
| 2025-08-05 | 13F | Cassaday & Co Wealth Management LLC | 7 205 | 0,00 | 274 | 13,22 | ||||
| 2025-07-30 | 13F | Drive Wealth Management, Llc | 57 274 | 2,04 | 2 180 | 15,29 | ||||
| 2025-08-01 | 13F | Red Lighthouse Investment Management, Llc | 1 224 | 28,17 | 47 | 53,33 | ||||
| 2025-07-17 | 13F | Elser Financial Planning, Inc | 124 892 | 4 787 | ||||||
| 2025-07-17 | 13F | Willow Creek Wealth Management Inc. | 163 365 | −10,42 | 6 218 | 1,24 | ||||
| 2025-07-18 | 13F | Citrine Capital LLC | 305 892 | 1,12 | 11 642 | 14,27 | ||||
| 2025-07-22 | 13F | Red Tortoise LLC | 1 851 | 0,00 | 70 | 12,90 | ||||
| 2025-08-06 | 13F | Commonwealth Equity Services, Llc | 10 247 | 4,50 | 0 | |||||
| 2025-08-07 | 13F | Retirement Solution Inc. | 264 639 | 0,67 | 10 072 | 13,77 | ||||
| 2025-07-30 | 13F | Parcion Private Wealth LLC | 10 097 | 19,52 | 384 | 35,21 | ||||
| 2025-07-30 | 13F | Blume Capital Management, Inc. | 800 | 166,67 | 30 | 200,00 | ||||
| 2025-07-21 | 13F | Creative Capital Management Investments LLC | 9 657 | −2,68 | 368 | 9,88 | ||||
| 2025-04-14 | 13F | Greenspring Advisors, LLC | 74 120 | −44,44 | 2 496 | −43,53 | ||||
| 2025-07-14 | 13F | UMA Financial Services, Inc. | 4 808 | −3,28 | 183 | 8,98 | ||||
| 2025-04-21 | 13F | Nelson, Van Denburg & Campbell Wealth Management Group, LLC | 0 | −100,00 | 0 | |||||
| 2025-07-10 | 13F | Waypoint Wealth Partners Inc. | 30 733 | 34,03 | 1 170 | 51,42 | ||||
| 2025-08-08 | 13F | Schwarz Dygos Wheeler Investment Advisors Llc | 9 535 | 0,00 | 363 | 12,77 | ||||
| 2025-07-16 | 13F | TCI Wealth Advisors, Inc. | 46 837 | 1 783 | ||||||
| 2025-08-14 | 13F | Betterment LLC | 16 083 | −22,75 | 1 | |||||
| 2025-08-13 | 13F | Townsquare Capital Llc | 0 | −100,00 | 0 | |||||
| 2025-07-31 | 13F | Cardinal Point Capital Management, ULC | 19 500 | −15,24 | 742 | −4,13 | ||||
| 2025-07-18 | 13F | Bridge Generations Wealth Management Llc | 4 884 | −54,03 | 186 | −48,18 | ||||
| 2025-07-22 | 13F | Hill Island Financial Llc | 55 089 | 2 097 | ||||||
| 2025-08-08 | 13F | Tortoise Investment Management, LLC | 1 720 | 0,00 | 65 | 14,04 | ||||
| 2025-08-14 | 13F | Seven Mile Advisory | 21 695 | 0,00 | 826 | 13,01 | ||||
| 2025-07-24 | 13F | Jfs Wealth Advisors, Llc | 648 | 0,00 | 25 | 14,29 | ||||
| 2025-08-14 | 13F | Cardiff Park Advisors, Llc | 1 368 | 0,74 | 52 | 15,56 | ||||
| 2025-08-13 | 13F | United Wealth Management, LLC | 5 411 | 206 | ||||||
| 2025-07-14 | 13F | Sellwood Investment Partners LLC | 7 261 | 276 | ||||||
| 2025-07-31 | 13F | Glass Jacobson Investment Advisors llc | 145 | 0,69 | 6 | 25,00 | ||||
| 2025-07-30 | 13F | Forum Financial Management, LP | 396 139 | 0,13 | 15 077 | 13,16 | ||||
| 2025-07-31 | 13F | Curio Wealth, Llc | 1 180 | 58 900,00 | 45 | 12,82 | ||||
| 2025-08-14 | 13F | Raymond James Financial Inc | 0 | −100,00 | 0 | |||||
| 2025-07-08 | 13F | Apella Capital, LLC | 51 928 | 8,53 | 1 966 | 29,17 | ||||
| 2025-07-17 | 13F | DiNuzzo Private Wealth, Inc. | 4 629 | −2,01 | 176 | 10,69 | ||||
| 2025-07-29 | 13F | Chicago Partners Investment Group LLC | 6 772 | 0,00 | 266 | 13,73 | ||||
| 2025-05-15 | 13F | Wealth Management Strategies, Inc. | 7 440 | 251 | ||||||
| 2025-07-28 | 13F | Delap Wealth Advisory, Llc | 0 | −100,00 | 0 | |||||
| 2025-07-08 | 13F | Zrc Wealth Management, Llc | 458 | 0,66 | 17 | 13,33 | ||||
| 2025-08-26 | 13F/A | Thrivent Financial For Lutherans | 122 146 | 5 | ||||||
| 2025-07-16 | 13F | Five Oceans Advisors | 351 894 | 5,86 | 13 393 | 19,63 | ||||
| 2025-07-18 | 13F | Heritage Financial Services, LLC | 60 784 | −0,16 | 2 313 | 12,83 | ||||
| 2025-07-25 | 13F | Ruedi Wealth Management, Inc. | 0 | −100,00 | 0 | |||||
| 2025-08-11 | 13F | Foundation Wealth Management, LLC\PA | 6 312 | 0,59 | 240 | 13,74 | ||||
| 2025-07-14 | 13F | AdvisorNet Financial, Inc | 11 592 | 9,67 | 441 | 24,23 | ||||
| 2025-08-12 | 13F | Triune Financial Partners, LLC | 47 098 | 1 793 | ||||||
| 2025-08-12 | 13F | Pathstone Holdings, LLC | 222 203 | 34,03 | 8 457 | 51,50 | ||||
| 2025-07-21 | 13F | Keystone Financial Group, Inc. | 1 504 | 0,74 | 58 | 11,54 | ||||
| 2025-07-07 | 13F | New Capital Management LP | 74 936 | 8,20 | 2 852 | 22,30 | ||||
| 2025-08-14 | 13F | C M Bidwell & Associates Ltd | 800 | 0,00 | 30 | 15,38 | ||||
| 2025-08-11 | 13F | Root Financial Partners, LLC | 0 | −100,00 | 0 | |||||
| 2025-08-14 | 13F | Premier Financial Group | 12 943 | 511 | ||||||
| 2025-07-16 | 13F | Perigon Wealth Management, LLC | 43 944 | 2,15 | 1 673 | 15,47 | ||||
| 2025-07-28 | 13F | Arlington Financial Advisors, LLC | 0 | −100,00 | 0 | |||||
| 2025-08-19 | 13F | Asset Dedication, LLC | 80 064 | −0,16 | 3 047 | 12,85 | ||||
| 2025-07-25 | 13F | Cwm, Llc | 1 137 | 0,00 | 0 | |||||
| 2025-05-15 | 13F | CAPROCK Group, Inc. | 10 395 | 0,00 | 350 | 1,74 | ||||
| 2025-08-06 | 13F | Geometric Wealth Advisors | 0 | −100,00 | 0 | |||||
| 2025-07-30 | 13F | Mills Wealth Advisors LLC | 5 268 | 200 | ||||||
| 2025-07-24 | 13F | IFP Advisors, Inc | 236 | −4,84 | 9 | 0,00 | ||||
| 2025-08-12 | 13F | Hill Investment Group Partners, LLC | 6 966 | 0,00 | 265 | 13,25 | ||||
| 2025-08-06 | 13F | Longview Financial Advisors LLC | 31 932 | 5,99 | 1 215 | 19,82 | ||||
| 2025-08-14 | 13F | Citadel Advisors Llc | 7 498 | −46,73 | 285 | −39,87 | ||||
| 2025-07-14 | 13F | BetterWealth, LLC | 13 808 | 1,23 | 526 | 14,38 | ||||
| 2025-08-14 | 13F | Balanced Rock Investment Advisor | 89 766 | 3,05 | 3 416 | 16,47 | ||||
| 2025-08-14 | 13F | Freedom Financial Partners LLC | 10 217 | 25,29 | 389 | 41,61 | ||||
| 2025-07-31 | 13F | Planning Center, Inc. | 42 127 | 3,12 | 1 603 | 16,58 | ||||
| 2025-07-24 | 13F | Grand Wealth Management, Llc | 6 560 | 0,44 | 250 | 13,70 | ||||
| 2025-07-11 | 13F | Quantum Financial Advisors, LLC | 573 927 | −1,71 | 21 844 | 11,07 | ||||
| 2025-08-07 | 13F | Resources Investment Advisors, LLC. | 64 715 | −4,93 | 2 463 | 7,46 | ||||
| 2025-07-31 | 13F | Schoolcraft Capital LLC | 148 343 | 154,58 | 5 646 | 187,72 | ||||
| 2025-07-10 | 13F | Klaas Financial Asset Advisors, LLC | 49 829 | 8,39 | 1 896 | 22,48 | ||||
| 2025-08-14 | 13F | Bank Of America Corp /de/ | 5 738 | −1,07 | 218 | 11,79 | ||||
| 2025-08-11 | 13F | Private Advisor Group, LLC | 5 445 | 207 | ||||||
| 2025-08-13 | 13F | RW Investment Management LLC | 27 435 | 0,02 | 1 044 | 13,11 | ||||
| 2025-07-30 | 13F | EnRich Financial Partners LLC | 9 285 | −9,45 | 353 | 2,32 | ||||
| 2025-08-08 | 13F | Francis Financial, Inc. | 0 | −100,00 | 0 | |||||
| 2025-07-18 | 13F | Meritas Wealth Management, LLC | 16 037 | 0,61 | 610 | 13,81 | ||||
| 2025-08-12 | 13F | Coston, McIsaac & Partners | 454 | 0,22 | 0 | |||||
| 2025-08-08 | 13F | Pinney & Scofield, Inc. | 1 031 | 0,00 | 39 | 14,71 | ||||
| 2025-08-08 | 13F | RAM Investment Partners, LLC | 66 500 | 17,44 | 2 531 | 32,67 | ||||
| 2025-08-14 | 13F | Smartleaf Asset Management LLC | 777 | 346,55 | 29 | 480,00 | ||||
| 2025-08-14 | 13F | Royal Bank Of Canada | 294 | 292,00 | 11 | 266,67 | ||||
| 2025-07-18 | 13F | Tanager Wealth Management LLP | 6 074 | 231 |