Grundläggande statistik
| Institutionella ägare | 202 total, 202 long only, 0 short only, 0 long/short - change of 5,21% MRQ |
| Genomsnittlig portföljallokering | 0.5480 % - change of 0,97% MRQ |
| Institutionella aktier (lång) | 24 687 341 (ex 13D/G) - change of −1,67MM shares −6,32% MRQ |
| Institutionellt värde (lång) | $ 705 412 USD ($1000) |
Institutionellt ägande och aktieägare
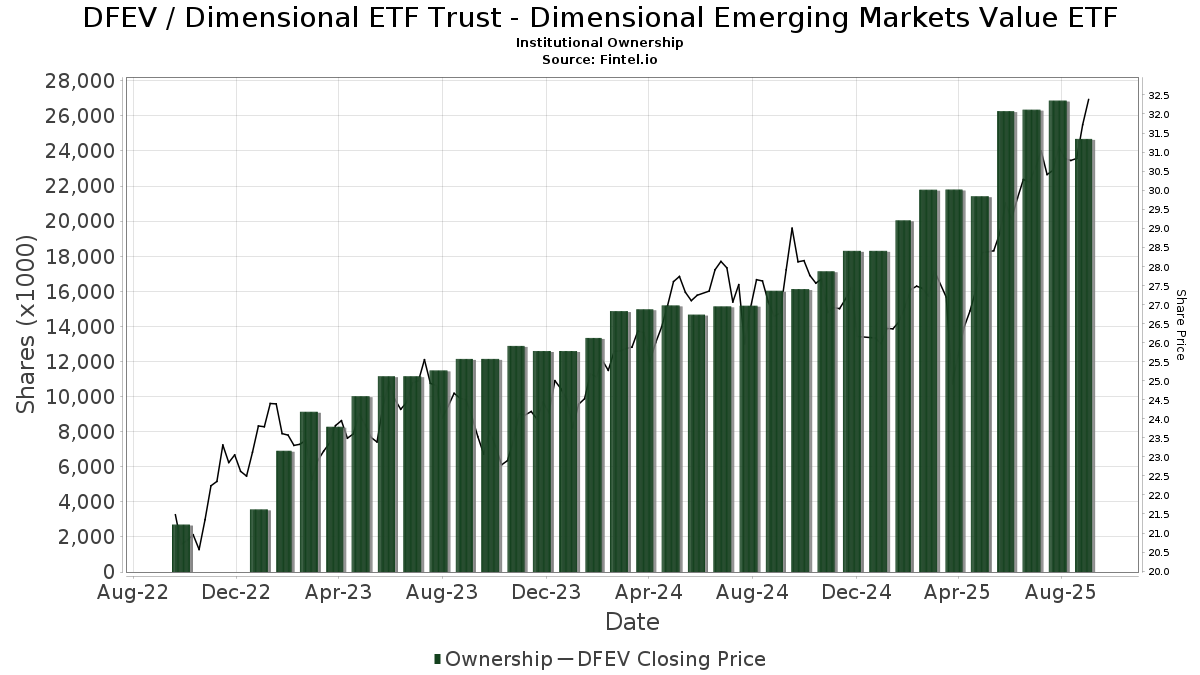
Dimensional ETF Trust - Dimensional Emerging Markets Value ETF (US:DFEV) har 202 Institutionella ägare och aktieägare som har lämnat in 13D/G- eller 13F-formulär till Securities Exchange Commission (SEC). Dessa institut innehar totalt 24,687,341 aktier. Största aktieägare inkluderar Asset Dedication, LLC, Ritholtz Wealth Management, Jones Financial Companies Lllp, HighTower Advisors, LLC, Raymond James Financial Inc, Fmr Llc, True Wealth Design, LLC, Sensible Money, LLC, Marquette Asset Management, LLC, and Beacon Pointe Advisors, LLC .
Dimensional ETF Trust - Dimensional Emerging Markets Value ETF (ARCA:DFEV) Institutionell ägarstruktur visar institutioners och fonders nuvarande positioner i företaget, samt de senaste förändringarna i positionernas storlek. Större aktieägare kan vara enskilda investerare, fonder, hedgefonder eller institutioner. Bilaga 13D visar att investeraren äger (eller ägde) mer än 5% av företaget och avser (eller avsåg) att aktivt eftersträva en förändring av affärsstrategin. Schedule 13G indikerar en passiv investering på över 5%.
The share price as of September 9, 2025 is 31,43 / share. Previously, on September 10, 2024, the share price was 26,67 / share. This represents an increase of 17,86% over that period.
Fondsentimentets poäng
Fondsentimentet poängen(fka Ägarackumulation-poäng) visar vilka aktier som är mest köpta av fonder. Det är resultatet av en sofistikerad kvantitativ flerfaktormodell som identifierar företag med de högsta nivåerna av institutionell ackumulering. Poängsättningsmodellen använder en kombination av den totala ökningen av redovisade ägare, förändringarna i portföljallokeringarna för dessa ägare och andra mått. Siffran sträcker sig från 0 till 100, där högre siffror indikerar en högre nivå av ackumulering i förhållande till sina konkurrenter, och 50 är genomsnittet.
Uppdateringsfrekvens: Dagligen
Se Ownership Explorer, som innehåller en lista över de högst rankade företagen.
Institutionell sälj/köp-kvot
Förutom att rapportera vanliga eget kapital- och skuldemissioner måste institutioner med mer än 100MM tillgångar under förvaltning också avslöja sina innehav av sälj- och köpoptioner. Eftersom säljoptioner i allmänhet indikerar ett negativt sentiment och köpoptioner indikerar ett positivt sentiment, kan vi få en uppfattning om det övergripande institutionella sentimentet genom att plotta förhållandet mellan säljoptioner och köpoptioner. Diagrammet till höger visar det historiska förhållandet mellan sälj- och köpoptioner för detta instrument.
Genom att använda sälj/köp-kvoten som en indikator på aktieägarnas sentiment undviker man en av de största bristerna med att använda det totala institutionella ägandet, nämligen att en betydande del av de förvaltade tillgångarna investeras passivt för att följa index. Passivt förvaltade fonder köper vanligtvis inte optioner, så indikatorn för sälj/köp-kvoten ger en bättre bild av stämningen i aktivt förvaltade fonder.
13D/G-Arkiveringar
Vi presenterar 13D/G-arkiveringar separat från 13F-arkiveringar på grund av att de behandlas olika av SEC. 13D/G-arkiveringar kan lämnas in av grupper av investerare (med en ledare), medan 13F-arkiveringar inte kan det. Detta leder till situationer där en investerare kan lämna in en 13D/G-ansökan med ett värde för de totala aktierna (vilket motsvarar alla aktier som ägs av investerargruppen), men sedan lämna in en 13F-ansökan med ett annat värde för de totala aktierna (vilket motsvarar enbart deras eget ägande). Detta innebär att aktieägandet i 13D/G-arkiveringar och 13F-arkiveringar ofta inte är direkt jämförbara, så vi presenterar dem separat.
Notera: Från och med den 16 maj 2021 visar vi inte längre ägare som inte har lämnat in en 13D/G under det senaste året. Tidigare visade vi hela historiken för 13D/G-arkiveringar. I allmänhet måste enheter som är skyldiga att lämna in 13D/G-arkiveringar lämna in minst en gång per år innan de lämnar in en stängningsarkivering. Fonder avslutar dock ibland positioner utan att lämna in en avslutande arkivering (dvs. de avvecklar), så att visa hela historiken resulterade ibland i förvirring om det nuvarande ägandet. För att förhindra förvirring visar vi nu endast "nuvarande" ägare - det vill säga ägare som har lämnat in en ansökan under det senaste året.
Upgrade to unlock premium data.
13F- och NPORT-arkiveringar
Detaljer om 13F-arkiveringar är gratis. Detaljer om NP-arkiveringar kräver ett premiummedlemskap. Gröna rader indikerar nya positioner. Röda rader indikerar stängda positioner. Klicka på länk symbolen för att se hela transaktionshistoriken.
Uppgradera
för att låsa upp premiumdata och exportera till Excel ![]() .
.
| Fil Datum | Källa | Investerare | Typ | Genomsnittligt pris (beräknat) |
Aktier | Δ Aktier (%) |
Rapporterat värde (1000 USD) |
Δ Värde (%) |
Portföljallokering (%) |
|
|---|---|---|---|---|---|---|---|---|---|---|
| 2025-07-11 | 13F | Farther Finance Advisors, LLC | 71 734 | 15,56 | 2 151 | 27,50 | ||||
| 2025-07-24 | 13F | Us Bancorp \de\ | 0 | −100,00 | 0 | |||||
| 2025-08-08 | 13F | Smithfield Trust Co | 1 996 | 0,00 | 0 | |||||
| 2025-08-13 | 13F | SageView Advisory Group, LLC | 8 041 | −1,97 | 246 | 10,86 | ||||
| 2025-07-17 | 13F | Applied Capital LLC | 51 695 | −15,76 | 1 550 | −6,57 | ||||
| 2025-07-07 | 13F | Versant Capital Management, Inc | 57 306 | 8,58 | 1 719 | 20,39 | ||||
| 2025-07-28 | 13F | RCS Financial Planning, LLC | 11 982 | −30,36 | 359 | −22,80 | ||||
| 2025-08-13 | 13F | Jones Financial Companies Lllp | 1 214 257 | 166,65 | 36 221 | 193,48 | ||||
| 2025-08-08 | 13F | Your Advocates Ltd., LLP | 427 | 0,00 | 13 | 9,09 | ||||
| 2025-08-14 | 13F | Great Valley Advisor Group, Inc. | 6 956 | 209 | ||||||
| 2025-08-15 | 13F | Kestra Advisory Services, LLC | 33 722 | −11,69 | 1 011 | −2,03 | ||||
| 2025-07-28 | 13F | Harbour Investments, Inc. | 156 | 5 | ||||||
| 2025-07-29 | 13F | Two West Capital Advisors LLC | 16 507 | 0,74 | 509 | 21,53 | ||||
| 2025-07-15 | 13F | Marquette Asset Management, LLC | 654 800 | 1,85 | 19 637 | 12,92 | ||||
| 2025-08-15 | 13F | CI Private Wealth, LLC | 103 445 | −26,07 | 3 102 | −18,02 | ||||
| 2025-07-22 | 13F | Gemmer Asset Management LLC | 7 396 | −2,00 | 222 | 8,33 | ||||
| 2025-08-14 | 13F | Monograph Wealth Advisors, Llc | 34 685 | 0,00 | 1 040 | 10,87 | ||||
| 2025-07-17 | 13F | XY Planning Network, Inc. | 9 687 | 291 | ||||||
| 2025-08-14 | 13F | Colony Group, LLC | 12 580 | −5,20 | 377 | 5,31 | ||||
| 2025-08-12 | 13F | Landing Point Financial Group, LLC | 20 212 | 29,37 | 606 | 43,60 | ||||
| 2025-07-14 | 13F | Maryland Capital Advisors Inc. | 126 576 | 3,53 | 3 796 | 14,79 | ||||
| 2025-07-14 | 13F | Shearwater Capital LLC | 6 967 | 209 | ||||||
| 2025-07-28 | 13F | Sterling Financial Planning, Inc. | 185 640 | 5,68 | 5 567 | 17,18 | ||||
| 2025-05-02 | 13F | Capital A Wealth Management, LLC | 12 | 0 | ||||||
| 2025-08-14 | 13F/A | Skopos Labs, Inc. | 2 867 | 86 | ||||||
| 2025-08-12 | 13F | Global Retirement Partners, LLC | 773 | 0,65 | 23 | 15,00 | ||||
| 2025-05-16 | 13F | Coppell Advisory Solutions LLC | 0 | −100,00 | 0 | |||||
| 2025-08-01 | 13F | Envestnet Asset Management Inc | 137 323 | 4,53 | 4 118 | 15,90 | ||||
| 2025-08-01 | 13F | Motco | 6 472 | 195 | ||||||
| 2025-08-08 | 13F | Avantax Advisory Services, Inc. | 8 208 | −24,45 | 246 | −16,04 | ||||
| 2025-08-12 | 13F | Jpmorgan Chase & Co | 56 216 | −20,50 | 1 686 | −11,87 | ||||
| 2025-07-17 | 13F | Porter White Investment Advisors, Inc. | 31 917 | −19,87 | 957 | −11,14 | ||||
| 2025-04-07 | 13F | GoalVest Advisory LLC | 0 | −100,00 | 0 | |||||
| 2025-07-25 | 13F | Sequoia Financial Advisors, LLC | 69 128 | −11,35 | 2 073 | −1,71 | ||||
| 2025-08-12 | 13F | McGrath & Associates, Inc. | 62 685 | −2,81 | 1 880 | 7,74 | ||||
| 2025-04-21 | 13F | Envestnet Portfolio Solutions, Inc. | 0 | −100,00 | 0 | |||||
| 2025-08-11 | 13F | Citigroup Inc | 17 649 | 84,84 | 529 | 105,04 | ||||
| 2025-07-09 | 13F | Bruce G. Allen Investments, LLC | 4 703 | 0,00 | 141 | 11,02 | ||||
| 2025-07-22 | 13F | Firethorn Wealth Partners, Llc | 12 702 | −3,65 | 381 | 6,74 | ||||
| 2025-07-25 | 13F | Tranquility Partners, LLC | 15 724 | 2,28 | 472 | 13,49 | ||||
| 2025-08-14 | 13F | Jane Street Group, Llc | 193 883 | −71,20 | 5 815 | −68,07 | ||||
| 2025-08-05 | 13F | Astra Wealth Partners LLC | 77 931 | −5,79 | 2 337 | 4,47 | ||||
| 2025-08-12 | 13F | LPL Financial LLC | 29 079 | 36,43 | 872 | 51,39 | ||||
| 2025-08-13 | 13F | GeoWealth Management, LLC | 0 | −100,00 | 0 | |||||
| 2025-07-22 | 13F | Wealthcare Advisory Partners LLC | 9 832 | 1,48 | 295 | 12,21 | ||||
| 2025-08-11 | 13F | HighTower Advisors, LLC | 942 664 | 3,81 | 28 270 | 15,09 | ||||
| 2025-07-10 | 13F | Oliver Lagore Vanvalin Investment Group | 0 | −100,00 | 0 | |||||
| 2025-08-21 | 13F | Aveo Capital Partners, LLC | 0 | −100,00 | 0 | |||||
| 2025-07-15 | 13F | Family Investment Center, Inc. | 104 279 | 3,40 | 3 127 | 14,67 | ||||
| 2025-08-13 | 13F | Ark & Tlk Investments, Llc | 10 461 | 314 | ||||||
| 2025-08-12 | 13F | Rather & Kittrell, Inc. | 28 074 | 38,54 | 842 | 53,47 | ||||
| 2025-08-13 | 13F | Natixis Advisors, L.p. | 42 466 | 157,21 | 1 | |||||
| 2025-08-13 | 13F | Baird Financial Group, Inc. | 28 680 | 26,86 | 860 | 40,75 | ||||
| 2025-08-14 | 13F | EP Wealth Advisors, Inc. | 19 890 | −56,30 | 596 | −51,58 | ||||
| 2025-07-21 | 13F | Financial Architects, LLC | 254 015 | 0,11 | 7 618 | 10,99 | ||||
| 2025-07-30 | 13F | Exencial Wealth Advisors, Llc | 539 495 | 9,93 | 16 179 | 21,88 | ||||
| 2025-08-14 | 13F | Wells Fargo & Company/mn | 867 | 510,56 | 26 | 766,67 | ||||
| 2025-07-14 | 13F | UMA Financial Services, Inc. | 1 721 | 0,00 | 52 | 10,87 | ||||
| 2025-08-01 | 13F | Red Lighthouse Investment Management, Llc | 4 398 | 0,00 | 132 | 14,91 | ||||
| 2025-08-14 | 13F | Bank Of America Corp /de/ | 90 008 | 93,53 | 2 699 | 114,55 | ||||
| 2025-04-17 | 13F | Retirement Solution Inc. | 0 | −100,00 | 0 | −100,00 | ||||
| 2025-07-11 | 13F | Rockwood Wealth Management, LLC | 9 818 | 0,00 | 294 | 10,94 | ||||
| 2025-08-13 | 13F | Northwestern Mutual Wealth Management Co | 758 | 23 | ||||||
| 2025-07-29 | 13F | Schubert & Co | 19 115 | −44,27 | 573 | −38,19 | ||||
| 2025-07-23 | 13F | Matisse Capital | 39 760 | 0,00 | 1 192 | 10,88 | ||||
| 2025-07-18 | 13F | Truist Financial Corp | 253 346 | 0,08 | 7 598 | 10,95 | ||||
| 2025-07-29 | 13F | Unison Advisors LLC | 18 813 | −4,52 | 564 | 6,02 | ||||
| 2025-08-13 | 13F | EverSource Wealth Advisors, LLC | 26 018 | 780 | ||||||
| 2025-08-14 | 13F | Glen Eagle Advisors, LLC | 4 960 | 0,00 | 149 | 10,45 | ||||
| 2025-08-14 | 13F | Raymond James Financial Inc | 877 088 | 5,14 | 26 304 | 16,57 | ||||
| 2025-08-06 | 13F | Commonwealth Equity Services, Llc | 57 335 | −6,95 | 2 | 0,00 | ||||
| 2025-08-13 | 13F | Beacon Pointe Advisors, LLC | 548 406 | −0,96 | 16 447 | 9,80 | ||||
| 2025-07-30 | 13F | Blume Capital Management, Inc. | 260 708 | 1,42 | 7 819 | 12,44 | ||||
| 2025-08-05 | 13F | Cherry Tree Wealth Management, LLC | 454 | 0,00 | 14 | 8,33 | ||||
| 2025-08-14 | 13F | Royal Bank Of Canada | 25 687 | −0,96 | 770 | 9,69 | ||||
| 2025-07-03 | 13F | Lam Group, Inc. | 84 585 | 0,59 | 2 537 | 11,52 | ||||
| 2025-07-17 | 13F | Eagle Wealth Strategies Llc | 470 016 | −0,32 | 14 096 | 10,51 | ||||
| 2025-07-21 | 13F | Mattern Capital Management, Llc | 7 513 | 225 | ||||||
| 2025-08-11 | 13F | Dorsey & Whitney Trust CO LLC | 21 719 | 0,00 | 651 | 10,90 | ||||
| 2025-08-14 | 13F | Acorn Wealth Advisors, LLC | 10 265 | 14,90 | 308 | 27,39 | ||||
| 2025-07-24 | 13F | Jfs Wealth Advisors, Llc | 20 335 | 0,00 | 610 | 10,73 | ||||
| 2025-07-28 | 13F | Pettinga Financial Advisors, LLC | 36 207 | 122,68 | 1 086 | 147,15 | ||||
| 2025-07-29 | 13F | Chicago Partners Investment Group LLC | 83 980 | 2,84 | 2 606 | 16,55 | ||||
| 2025-08-14 | 13F | Comerica Bank | 1 363 | −63,29 | 41 | −60,00 | ||||
| 2025-07-30 | 13F | Rehmann Capital Advisory Group | 10 668 | 8,60 | 320 | 20,38 | ||||
| 2025-07-25 | 13F | Concord Wealth Partners | 74 | 0,00 | 2 | 100,00 | ||||
| 2025-08-05 | 13F | Dravo Bay Llc | 97 142 | −0,89 | 2 990 | 12,75 | ||||
| 2025-08-05 | 13F | Dunhill Financial, LLC | 158 | 5 | ||||||
| 2025-08-14 | 13F | Susquehanna International Group, Llp | 325 631 | 316,81 | 9 766 | 362,14 | ||||
| 2025-08-13 | 13F | Millstone Evans Group, LLC | 605 | −65,09 | 18 | −60,87 | ||||
| 2025-08-13 | 13F | United Wealth Management, LLC | 152 898 | 2,26 | 4 585 | 13,38 | ||||
| 2025-07-23 | 13F | Sax Wealth Advisors, Llc | 69 332 | 28,86 | 2 079 | 42,89 | ||||
| 2025-08-12 | 13F | Accredited Wealth Management, LLC | 400 | 0,00 | 12 | 10,00 | ||||
| 2025-07-15 | 13F | Verum Partners LLC | 89 314 | −2,09 | 2 679 | 8,55 | ||||
| 2025-08-04 | 13F | Bay Colony Advisory Group, Inc d/b/a Bay Colony Advisors | 9 617 | 288 | ||||||
| 2025-08-11 | 13F | Foundation Wealth Management, LLC\PA | 35 944 | −19,92 | 1 078 | −11,29 | ||||
| 2025-07-30 | 13F | Mills Wealth Advisors LLC | 150 625 | 15,78 | 4 517 | 28,36 | ||||
| 2025-08-04 | 13F | Integrity Alliance, Llc. | 99 612 | −0,56 | 2 987 | 10,26 | ||||
| 2025-07-18 | 13F | Heritage Financial Services, LLC | 86 021 | −1,66 | 2 580 | 9,00 | ||||
| 2025-07-09 | 13F | Christopher J. Hasenberg, Inc | 338 | 10 | ||||||
| 2025-08-12 | 13F | Pathstone Holdings, LLC | 112 915 | −7,14 | 3 386 | 3,23 | ||||
| 2025-08-27 | 13F/A | Brinker Capital Investments, LLC | 56 937 | 567,10 | 1 708 | 642,17 | ||||
| 2025-07-23 | 13F | Abel Hall, LLC | 54 856 | −6,79 | 1 645 | 3,33 | ||||
| 2025-07-17 | 13F | Oceanside Advisors LLC | 28 109 | −9,20 | 843 | 0,72 | ||||
| 2025-08-11 | 13F | Root Financial Partners, LLC | 239 147 | −37,21 | 7 172 | −30,37 | ||||
| 2025-05-15 | 13F/A | Orion Portfolio Solutions, LLC | 8 535 | 231 | ||||||
| 2025-08-14 | 13F | C M Bidwell & Associates Ltd | 1 026 | 91,78 | 31 | 114,29 | ||||
| 2025-07-09 | 13F | Alesco Advisors Llc | 320 787 | 14,22 | 9 620 | 26,65 | ||||
| 2025-08-14 | 13F | Mml Investors Services, Llc | 71 626 | 54,37 | 2 | 100,00 | ||||
| 2025-07-22 | 13F | Sutton Place Investors Llc | 10 454 | 18,73 | 314 | 31,51 | ||||
| 2025-08-14 | 13F | Mariner, LLC | 7 884 | 4,94 | 236 | 16,26 | ||||
| 2025-08-14 | 13F | DecisionPoint Financial, LLC | 910 | 0,00 | 27 | 12,50 | ||||
| 2025-08-01 | 13F | Heritage Wealth Management, Inc./Texas | 0 | −100,00 | 0 | |||||
| 2025-08-01 | 13F | SwitchPoint Financial Planning, LLC | 13 697 | 0,00 | 411 | 10,81 | ||||
| 2025-07-30 | 13F | Clune & Associates, Ltd. | 11 897 | 0,57 | 357 | 11,60 | ||||
| 2025-08-11 | 13F | von Borstel & Associates, Inc. | 251 390 | 2,69 | 8 | 16,67 | ||||
| 2025-07-10 | 13F | White Wing Wealth Management | 72 883 | −1,61 | 2 186 | 14,34 | ||||
| 2025-08-05 | 13F | Bank Of Montreal /can/ | 44 624 | −0,36 | 1 338 | 10,49 | ||||
| 2025-05-15 | 13F | Evergreen Capital Management Llc | 0 | −100,00 | 0 | |||||
| 2025-08-05 | 13F | Golden Bell Financial Planning LLC | 66 575 | −0,38 | 1 997 | 10,46 | ||||
| 2025-08-07 | 13F | Resources Investment Advisors, LLC. | 90 899 | −3,05 | 2 726 | 7,49 | ||||
| 2025-08-08 | 13F | Pinney & Scofield, Inc. | 44 174 | −0,12 | 1 325 | 10,70 | ||||
| 2025-08-12 | 13F | Howe & Rusling Inc | 112 | 3 | ||||||
| 2025-05-12 | 13F | C2P Capital Advisory Group, LLC d.b.a. Prosperity Capital Advisors | 0 | −100,00 | 0 | −100,00 | ||||
| 2025-07-15 | 13F | Cordant, Inc. | 162 708 | −10,38 | 4 880 | −0,63 | ||||
| 2025-07-23 | 13F | First Financial Group Corp | 9 380 | 23,75 | 281 | 37,07 | ||||
| 2025-08-08 | 13F | Tortoise Investment Management, LLC | 181 634 | 12,16 | 5 447 | 24,36 | ||||
| 2025-07-28 | 13F | Eq Wealth Advisors, Llc | 101 460 | 18,37 | 3 043 | 31,23 | ||||
| 2025-07-17 | 13F | Avondale Wealth Management | 2 000 | 0,00 | 60 | 9,26 | ||||
| 2025-07-16 | 13F | Tru Independence Asset Management 2, Llc | 33 647 | 12,64 | 1 009 | 24,88 | ||||
| 2025-07-30 | 13F | Phillips Financial Management, Llc | 5 534 | 0,34 | 166 | 10,74 | ||||
| 2025-08-06 | 13F | Vestmark Advisory Solutions, Inc. | 421 062 | 107,54 | 12 628 | 130,13 | ||||
| 2025-07-18 | 13F | PBMares Wealth Management LLC | 168 304 | −4,39 | 5 047 | 6,01 | ||||
| 2025-07-31 | 13F | Opes Wealth Management LLC | 335 130 | 1,35 | 10 051 | 12,37 | ||||
| 2025-07-14 | 13F | U.S. Capital Wealth Advisors, LLC | 26 992 | −5,90 | 809 | 4,39 | ||||
| 2025-08-07 | 13F | Allworth Financial LP | 73 565 | −3,17 | 2 206 | 8,56 | ||||
| 2025-07-31 | 13F | Buckingham Strategic Partners | 16 450 | −3,12 | 493 | 7,41 | ||||
| 2025-09-09 | 13F | Cambridge Financial Group, LLC | 510 972 | 11,11 | 15 324 | 23,18 | ||||
| 2025-07-25 | 13F | Index Fund Advisors, Inc. | 365 272 | 9,62 | 10 954 | 21,54 | ||||
| 2025-08-14 | 13F | Warren Averett Asset Management, LLC | 184 984 | −6,69 | 5 548 | 3,45 | ||||
| 2025-08-14 | 13F | UBS Group AG | 314 | −19,49 | 9 | −10,00 | ||||
| 2025-07-28 | 13F | Ritholtz Wealth Management | 1 247 799 | 23,74 | 37 421 | 37,19 | ||||
| 2025-08-14 | 13F | Principia Wealth Advisory, LLC | 1 310 | −6,43 | 39 | 14,71 | ||||
| 2025-07-03 | 13F | Fiduciary Financial Group, Llc | 12 307 | 0,22 | 370 | 21,31 | ||||
| 2025-08-12 | 13F | Vestor Capital, Llc | 27 470 | 642,43 | 3 | |||||
| 2025-07-21 | 13F | Family CFO Inc | 15 413 | 408,68 | 462 | 470,37 | ||||
| 2025-07-22 | 13F | Simplicity Wealth,LLC | 0 | −100,00 | 0 | |||||
| 2025-08-06 | 13F | Savant Capital, LLC | 93 378 | −12,14 | 2 800 | −2,57 | ||||
| 2025-08-14 | 13F | NCM Capital Management, LLC | 13 950 | 11,60 | 419 | 23,67 | ||||
| 2025-08-15 | 13F | Morgan Stanley | 7 407 | −40,84 | 222 | −34,32 | ||||
| 2025-08-14 | 13F | Beaird Harris Wealth Management, LLC | 645 | 19 | ||||||
| 2025-08-14 | 13F | Cardiff Park Advisors, Llc | 44 914 | 1,54 | 1 347 | 12,54 | ||||
| 2025-08-08 | 13F | Sittner & Nelson, Llc | 362 | −41,89 | 11 | −37,50 | ||||
| 2025-08-14 | 13F | Citadel Advisors Llc | 0 | −100,00 | 0 | |||||
| 2025-07-16 | 13F | Vestia Personal Wealth Advisors | 96 718 | 7,96 | 2 900 | 19,69 | ||||
| 2025-07-16 | 13F | Blue Oak Capital, LLC | 85 789 | 5,40 | 2 573 | 16,86 | ||||
| 2025-08-01 | 13F | Austin Private Wealth, LLC | 13 242 | 14,70 | 397 | 27,24 | ||||
| 2025-07-09 | 13F | Graves-Light Private Wealth Management, Inc. | 323 304 | 2,85 | 9 696 | 14,02 | ||||
| 2025-07-24 | 13F | Wealth Advisors Northwest LLC | 85 045 | 2,92 | 2 550 | 14,09 | ||||
| 2025-08-04 | 13F | Spire Wealth Management | 46 762 | −2,32 | 1 402 | 8,35 | ||||
| 2025-07-09 | 13F | Efficient Frontier Advisors LLC | 32 975 | 0,00 | 989 | 10,89 | ||||
| 2025-07-29 | 13F | Grunden Financial Advisory, Inc. | 32 628 | 25,00 | 979 | 38,53 | ||||
| 2025-08-14 | 13F | Integrated Wealth Concepts LLC | 9 736 | 0,80 | 292 | 11,49 | ||||
| 2025-08-14 | 13F | Fmr Llc | 847 228 | −77,34 | 25 408 | −74,88 | ||||
| 2025-08-05 | 13F | Sensible Money, LLC | 688 611 | 8,11 | 20 651 | 19,86 | ||||
| 2025-08-14 | 13F | Old Mission Capital Llc | 118 958 | 3 568 | ||||||
| 2025-07-18 | 13F | TruNorth Capital Management, LLC | 198 | 0,00 | 6 | 0,00 | ||||
| 2025-07-30 | 13F | Eqis Capital Management, Inc. | 403 824 | −5,51 | 12 111 | 4,76 | ||||
| 2025-07-24 | 13F | Vantage Point Financial LLC | 46 844 | 6,75 | 1 405 | 18,28 | ||||
| 2025-08-13 | 13F | American Investment Services, Inc. | 11 064 | −5,37 | 332 | 4,75 | ||||
| 2025-07-17 | 13F | Janney Montgomery Scott LLC | 474 303 | 2,85 | 14 | 16,67 | ||||
| 2025-07-15 | 13F | Evanson Asset Management, LLC | 476 845 | 4,06 | 14 301 | 15,37 | ||||
| 2025-08-13 | 13F | Daner Wealth Management, LLC | 11 072 | −7,19 | 344 | 8,20 | ||||
| 2025-08-12 | 13F | Steward Partners Investment Advisory, Llc | 82 770 | 29,69 | 2 482 | 43,80 | ||||
| 2025-08-15 | 13F | Equitable Holdings, Inc. | 7 324 | −26,76 | 220 | −18,89 | ||||
| 2025-08-14 | 13F | GWM Advisors LLC | 144 796 | −4,33 | 4 342 | 6,08 | ||||
| 2025-08-12 | 13F | Hanover Advisors Inc | 18 394 | 1,62 | 552 | 12,68 | ||||
| 2025-07-23 | 13F | Gentry Private Wealth, Llc | 0 | −100,00 | 0 | −100,00 | ||||
| 2025-08-14 | 13F | Betterment LLC | 205 777 | 2,54 | 6 | 20,00 | ||||
| 2025-07-21 | 13F | Triad Wealth Partners, LLC | 9 790 | 294 | ||||||
| 2025-07-14 | 13F | Ridgewood Investments LLC | 396 | 12 | ||||||
| 2025-07-25 | 13F | Gibson Capital, LLC | 32 021 | 0,12 | 960 | 10,98 | ||||
| 2025-08-07 | 13F | Timonier Family Office, LTD. | 139 155 | 10,14 | 4 173 | 22,12 | ||||
| 2025-08-08 | 13F | Schwarz Dygos Wheeler Investment Advisors Llc | 82 305 | 0,62 | 2 468 | 11,57 | ||||
| 2025-07-23 | 13F | Mraz, Amerine & Associates, Inc. | 9 070 | 0,00 | 272 | 11,02 | ||||
| 2025-08-14 | 13F | Ancora Advisors, LLC | 3 051 | −16,82 | 91 | −8,08 | ||||
| 2025-07-14 | 13F | Park Avenue Securities Llc | 0 | −100,00 | 0 | |||||
| 2025-08-13 | 13F | Providence Capital Advisors, LLC | 289 | 9 | ||||||
| 2025-07-31 | 13F | Strata Wealth Advisors, LLC | 537 847 | 12,90 | 16 130 | 25,17 | ||||
| 2025-07-16 | 13F | BOS Asset Management, LLC | 18 420 | 0,03 | 552 | 10,84 | ||||
| 2025-08-01 | 13F | Clark Asset Management, LLC | 40 644 | 5,41 | 1 219 | 16,89 | ||||
| 2025-07-09 | 13F | Breakwater Capital Group | 149 737 | −4,31 | 4 491 | 6,07 | ||||
| 2025-07-10 | 13F | Pacific Asset Management, LLC | 9 733 | 0,58 | 292 | 11,49 | ||||
| 2025-07-31 | 13F | Glass Jacobson Investment Advisors llc | 84 609 | 11,44 | 2 537 | 27,55 | ||||
| 2025-08-14 | 13F | McIlrath & Eck, LLC | 793 | 0,00 | 24 | 9,52 | ||||
| 2025-08-06 | 13F | True Wealth Design, LLC | 746 985 | −7,32 | 22 402 | 2,75 | ||||
| 2025-05-15 | 13F | Wealth Management Nebraska | 0 | −100,00 | 0 | |||||
| 2025-07-30 | 13F | Forum Financial Management, LP | 32 209 | 0,00 | 966 | 10,79 | ||||
| 2025-07-17 | 13F | Lazari Capital Management, Inc. | 7 667 | −7,76 | 230 | 2,23 | ||||
| 2025-07-17 | 13F | DiNuzzo Private Wealth, Inc. | 225 906 | 2,99 | 6 775 | 14,17 | ||||
| 2025-04-18 | 13F | Edge Financial Advisors LLC | 0 | −100,00 | 0 | |||||
| 2025-08-12 | 13F | Proequities, Inc. | 0 | 0 | ||||||
| 2025-07-15 | 13F | BKA Wealth Consulting, Inc. | 67 175 | −22,22 | 2 015 | −13,78 | ||||
| 2025-08-12 | 13F | O'shaughnessy Asset Management, Llc | 8 457 | 53,88 | 254 | 70,95 | ||||
| 2025-07-29 | 13F | Wingate Wealth Advisors, Inc. | 8 661 | 0,62 | 260 | 11,64 | ||||
| 2025-08-06 | 13F | Cloud Capital Management, LLC | 7 477 | 5,41 | 0 | |||||
| 2025-07-16 | 13F | Perigon Wealth Management, LLC | 52 354 | −12,43 | 1 570 | −2,91 | ||||
| 2025-08-14 | 13F | Main Street Financial Solutions, LLC | 79 354 | 2,70 | 2 380 | 13,83 | ||||
| 2025-07-17 | 13F | Halbert Hargrove Global Advisors, Llc | 0 | −100,00 | 0 | |||||
| 2025-08-19 | 13F | Asset Dedication, LLC | 2 556 229 | 1,24 | 76 661 | 12,24 | ||||
| 2025-08-08 | 13F | Altiora Financial Group, LLC | 22 676 | 0,00 | 680 | 10,93 | ||||
| 2025-07-24 | 13F | IFP Advisors, Inc | 30 | −54,55 | 1 | −100,00 | ||||
| 2025-05-12 | 13F | Hantz Financial Services, Inc. | 0 | −100,00 | 0 | |||||
| 2025-08-06 | 13F | AE Wealth Management LLC | 301 362 | 12,71 | 9 038 | 24,96 | ||||
| 2025-05-14 | 13F | Lionshead Wealth Management, LLC | 0 | −100,00 | 0 | |||||
| 2025-08-14 | 13F | Css Llc/il | 27 631 | 17,78 | 829 | 30,60 | ||||
| 2025-07-30 | 13F | EnRich Financial Partners LLC | 51 213 | −3,95 | 1 536 | 6,45 | ||||
| 2025-07-31 | 13F | Cambridge Investment Research Advisors, Inc. | 22 930 | 117,37 | 1 | |||||
| 2025-05-08 | 13F | IFG Advisory, LLC | 0 | −100,00 | 0 | |||||
| 2025-07-03 | 13F | Garde Capital, Inc. | 1 035 | 25,76 | 31 | 40,91 | ||||
| 2025-07-23 | 13F | Elevate Wealth Advisory, Inc | 3 507 | 0,00 | 105 | 11,70 | ||||
| 2025-04-16 | 13F | Wealth Enhancement Advisory Services, Llc | 0 | −100,00 | 0 | |||||
| 2025-07-24 | 13F | Grand Wealth Management, Llc | 552 | 122,58 | 17 | 166,67 | ||||
| 2025-07-16 | 13F | Moisand Fitzgerald Tamayo, LLC | 18 151 | −2,07 | 544 | 8,58 | ||||
| 2025-09-04 | 13F/A | Advisor Group Holdings, Inc. | 42 396 | −37,74 | 1 272 | −30,94 |