Grundläggande statistik
| Institutionella ägare | 263 total, 263 long only, 0 short only, 0 long/short - change of −2,22% MRQ |
| Genomsnittlig portföljallokering | 0.1364 % - change of −23,13% MRQ |
| Institutionella aktier (lång) | 11 695 236 (ex 13D/G) - change of 0,37MM shares 3,27% MRQ |
| Institutionellt värde (lång) | $ 523 548 USD ($1000) |
Institutionellt ägande och aktieägare
iShares Trust - iShares Core 40/60 Moderate Allocation ETF (US:AOM) har 263 Institutionella ägare och aktieägare som har lämnat in 13D/G- eller 13F-formulär till Securities Exchange Commission (SEC). Dessa institut innehar totalt 11,695,236 aktier. Största aktieägare inkluderar BlackRock, Inc., LPL Financial LLC, Foundations Investment Advisors, LLC, Morgan Stanley, Ameriprise Financial Inc, TCG Advisory Services, LLC, Weitzel Financial Services, Inc., Royal Bank Of Canada, Kavar Capital Partners Group, Llc, and Wells Fargo & Company/mn .
iShares Trust - iShares Core 40/60 Moderate Allocation ETF (ARCA:AOM) Institutionell ägarstruktur visar institutioners och fonders nuvarande positioner i företaget, samt de senaste förändringarna i positionernas storlek. Större aktieägare kan vara enskilda investerare, fonder, hedgefonder eller institutioner. Bilaga 13D visar att investeraren äger (eller ägde) mer än 5% av företaget och avser (eller avsåg) att aktivt eftersträva en förändring av affärsstrategin. Schedule 13G indikerar en passiv investering på över 5%.
The share price as of September 12, 2025 is 47,41 / share. Previously, on September 16, 2024, the share price was 44,82 / share. This represents an increase of 5,78% over that period.

Fondsentimentets poäng
Fondsentimentet poängen(fka Ägarackumulation-poäng) visar vilka aktier som är mest köpta av fonder. Det är resultatet av en sofistikerad kvantitativ flerfaktormodell som identifierar företag med de högsta nivåerna av institutionell ackumulering. Poängsättningsmodellen använder en kombination av den totala ökningen av redovisade ägare, förändringarna i portföljallokeringarna för dessa ägare och andra mått. Siffran sträcker sig från 0 till 100, där högre siffror indikerar en högre nivå av ackumulering i förhållande till sina konkurrenter, och 50 är genomsnittet.
Uppdateringsfrekvens: Dagligen
Se Ownership Explorer, som innehåller en lista över de högst rankade företagen.
Institutionell sälj/köp-kvot
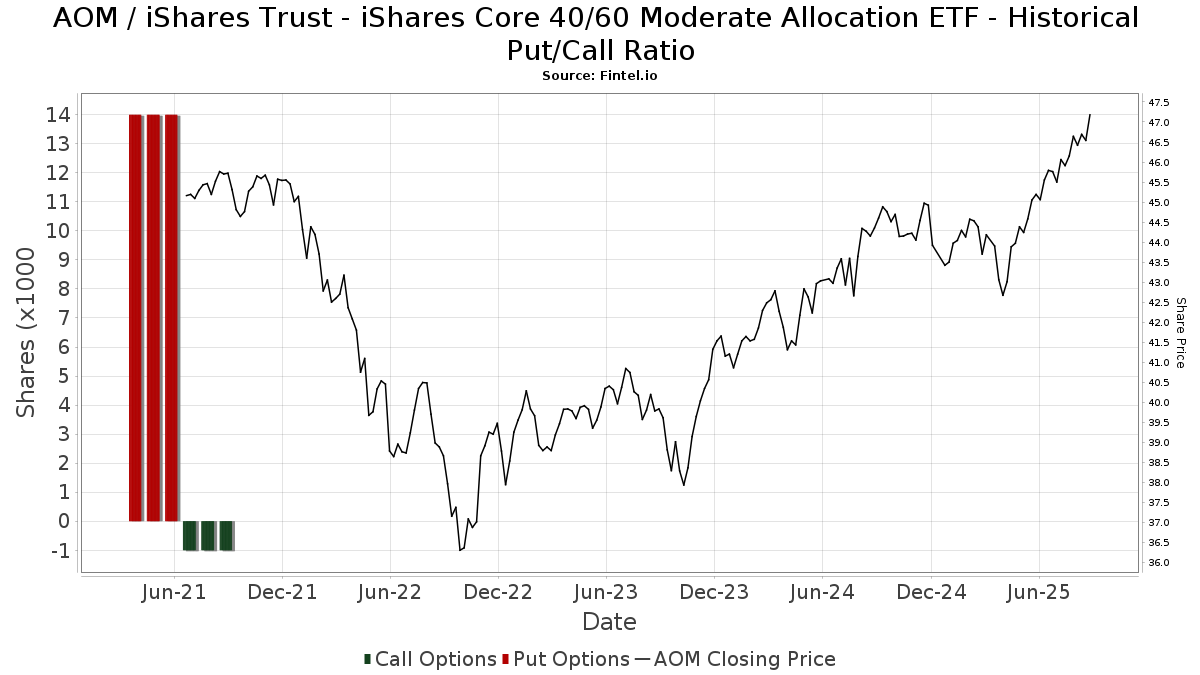
Förutom att rapportera vanliga eget kapital- och skuldemissioner måste institutioner med mer än 100MM tillgångar under förvaltning också avslöja sina innehav av sälj- och köpoptioner. Eftersom säljoptioner i allmänhet indikerar ett negativt sentiment och köpoptioner indikerar ett positivt sentiment, kan vi få en uppfattning om det övergripande institutionella sentimentet genom att plotta förhållandet mellan säljoptioner och köpoptioner. Diagrammet till höger visar det historiska förhållandet mellan sälj- och köpoptioner för detta instrument.
Genom att använda sälj/köp-kvoten som en indikator på aktieägarnas sentiment undviker man en av de största bristerna med att använda det totala institutionella ägandet, nämligen att en betydande del av de förvaltade tillgångarna investeras passivt för att följa index. Passivt förvaltade fonder köper vanligtvis inte optioner, så indikatorn för sälj/köp-kvoten ger en bättre bild av stämningen i aktivt förvaltade fonder.
13D/G-Arkiveringar
Vi presenterar 13D/G-arkiveringar separat från 13F-arkiveringar på grund av att de behandlas olika av SEC. 13D/G-arkiveringar kan lämnas in av grupper av investerare (med en ledare), medan 13F-arkiveringar inte kan det. Detta leder till situationer där en investerare kan lämna in en 13D/G-ansökan med ett värde för de totala aktierna (vilket motsvarar alla aktier som ägs av investerargruppen), men sedan lämna in en 13F-ansökan med ett annat värde för de totala aktierna (vilket motsvarar enbart deras eget ägande). Detta innebär att aktieägandet i 13D/G-arkiveringar och 13F-arkiveringar ofta inte är direkt jämförbara, så vi presenterar dem separat.
Notera: Från och med den 16 maj 2021 visar vi inte längre ägare som inte har lämnat in en 13D/G under det senaste året. Tidigare visade vi hela historiken för 13D/G-arkiveringar. I allmänhet måste enheter som är skyldiga att lämna in 13D/G-arkiveringar lämna in minst en gång per år innan de lämnar in en stängningsarkivering. Fonder avslutar dock ibland positioner utan att lämna in en avslutande arkivering (dvs. de avvecklar), så att visa hela historiken resulterade ibland i förvirring om det nuvarande ägandet. För att förhindra förvirring visar vi nu endast "nuvarande" ägare - det vill säga ägare som har lämnat in en ansökan under det senaste året.
Upgrade to unlock premium data.
| Fil Datum | Formulär | Investerare | Föregående aktier |
Senaste aktier |
Δ Aktier (Procent) |
Ägande (Procent) |
Δ Ägande (Procent) |
|
|---|---|---|---|---|---|---|---|---|
| 2025-04-22 | BlackRock, Inc. | 2,729,495 | 0 | -100.00 | 0.00 | -100.00 | ||
| 2025-04-15 | BlackRock Portfolio Management LLC | 2,910,257 | 8.80 |
13F- och NPORT-arkiveringar
Detaljer om 13F-arkiveringar är gratis. Detaljer om NP-arkiveringar kräver ett premiummedlemskap. Gröna rader indikerar nya positioner. Röda rader indikerar stängda positioner. Klicka på länk symbolen för att se hela transaktionshistoriken.
Uppgradera
för att låsa upp premiumdata och exportera till Excel ![]() .
.
| Fil Datum | Källa | Investerare | Typ | Genomsnittligt pris (beräknat) |
Aktier | Δ Aktier (%) |
Rapporterat värde (1000 USD) |
Δ Värde (%) |
Portföljallokering (%) |
|
|---|---|---|---|---|---|---|---|---|---|---|
| 2025-07-29 | 13F | MPS Loria Financial Planners, LLC | 9 657 | 20,32 | 445 | 26,14 | ||||
| 2025-08-13 | 13F | Vermillion & White Wealth Management Group, LLC | 30 | 1 | ||||||
| 2025-08-11 | 13F | Summit Wealth Partners, LLC | 16 939 | −3,22 | 780 | 1,43 | ||||
| 2025-08-11 | 13F | Delta Asset Management Llc/tn | 465 | −2,11 | 21 | 5,00 | ||||
| 2025-08-12 | 13F | Weaver Consulting Group | 161 042 | 0,62 | 7 414 | 5,58 | ||||
| 2025-07-07 | 13F | RDA Financial Network | 25 915 | −0,67 | 1 193 | 4,28 | ||||
| 2025-08-14 | 13F | Bnp Paribas Arbitrage, Sa | 25 | 1 | ||||||
| 2025-07-22 | 13F | BridgePort Financial Solutions, LLC | 11 158 | 1,44 | 514 | 6,43 | ||||
| 2025-07-23 | 13F | Elevate Wealth Advisory, Inc | 11 | 1 000,00 | 1 | |||||
| 2025-07-31 | 13F | AlTi Global, Inc. | 17 704 | −41,34 | 815 | −38,44 | ||||
| 2025-08-12 | 13F | Gladstone Institutional Advisory LLC | 8 193 | −15,98 | 377 | −11,71 | ||||
| 2025-07-31 | 13F | Buckingham Strategic Partners | 6 607 | 0,15 | 304 | 5,19 | ||||
| 2025-08-01 | 13F | Gwn Securities Inc. | 15 481 | −8,61 | 713 | −4,17 | ||||
| 2025-07-23 | 13F | Armstrong, Fleming & Moore, Inc | 12 042 | 554 | ||||||
| 2025-05-12 | 13F | Hantz Financial Services, Inc. | 0 | −100,00 | 0 | |||||
| 2025-08-14 | 13F | Colony Group, LLC | 81 764 | 1,11 | 3 764 | 6,09 | ||||
| 2025-08-18 | 13F/A | National Bank Of Canada /fi/ | 19 883 | 4,54 | 914 | 9,47 | ||||
| 2025-08-13 | 13F | RFP Financial Group LLC | 5 544 | −10,39 | 255 | −5,90 | ||||
| 2025-08-12 | 13F | Steward Partners Investment Advisory, Llc | 14 834 | 0,45 | 683 | 5,41 | ||||
| 2025-07-28 | 13F | Ritholtz Wealth Management | 19 699 | −3,58 | 907 | 1,12 | ||||
| 2025-05-14 | 13F | Renaissance Technologies Llc | 0 | −100,00 | 0 | |||||
| 2025-08-14 | 13F | Raymond James Financial Inc | 77 212 | −14,91 | 3 555 | −10,73 | ||||
| 2025-07-28 | 13F | Axxcess Wealth Management, Llc | 18 639 | 149,62 | 858 | 162,39 | ||||
| 2025-07-21 | 13F | Ascent Group, LLC | 8 241 | 0,00 | 379 | 4,99 | ||||
| 2025-04-22 | 13F/A | NorthRock Partners, LLC | 0 | −100,00 | 0 | |||||
| 2025-07-25 | 13F | Investment Advisory Group, LLC | 140 861 | 3,52 | 6 485 | 8,63 | ||||
| 2025-08-14 | 13F | Mariner, LLC | 12 445 | 10,93 | 573 | 16,26 | ||||
| 2025-04-22 | 13F | Crews Bank & Trust | 0 | −100,00 | 0 | |||||
| 2025-08-18 | 13F | Geneos Wealth Management Inc. | 1 237 | 47,26 | 57 | 55,56 | ||||
| 2025-07-10 | 13F | Global Financial Private Client, LLC | 20 101 | 0,00 | 925 | 4,88 | ||||
| 2025-07-22 | 13F | Beacon Financial Advisory LLC | 43 451 | −1,64 | 2 000 | 3,20 | ||||
| 2025-07-30 | 13F | Bogart Wealth, LLC | 595 | 0,00 | 27 | 3,85 | ||||
| 2025-08-05 | 13F | Sigma Planning Corp | 13 836 | −31,25 | 637 | −27,86 | ||||
| 2025-08-13 | 13F | Northwestern Mutual Wealth Management Co | 809 | −2,06 | 37 | 2,78 | ||||
| 2025-08-12 | 13F | Boreal Capital Management LLC | 371 | 17 | ||||||
| 2025-08-14 | 13F | Susquehanna International Group, Llp | 49 712 | 69,05 | 2 289 | 77,36 | ||||
| 2025-07-31 | 13F | Cambridge Investment Research Advisors, Inc. | 132 219 | 0,08 | 6 | 20,00 | ||||
| 2025-07-23 | 13F | WestEnd Advisors, LLC | 631 | 1 007,02 | 29 | 1 350,00 | ||||
| 2025-08-12 | 13F | Weitzel Financial Services, Inc. | 277 568 | −0,90 | 12 843 | 6,04 | ||||
| 2025-07-11 | 13F/A | Umb Bank N A/mo | 1 130 | 52 | ||||||
| 2025-08-13 | 13F | Summit Financial, LLC | 0 | −100,00 | 0 | |||||
| 2025-07-29 | 13F | Empirical Asset Management, LLC | 5 538 | −1,05 | 255 | 3,67 | ||||
| 2025-07-23 | 13F | 1 North Wealth Services Llc | 1 683 | 9,43 | 77 | 14,93 | ||||
| 2025-08-12 | 13F | Waterloo Capital, L.P. | 8 108 | 48,36 | 373 | 56,07 | ||||
| 2025-07-08 | 13F | Zrc Wealth Management, Llc | 284 | 0,71 | 13 | 8,33 | ||||
| 2025-08-14 | 13F | Mml Investors Services, Llc | 21 120 | 8,45 | 1 | |||||
| 2025-07-24 | 13F | Ronald Blue Trust, Inc. | 3 379 | 0,00 | 156 | 4,73 | ||||
| 2025-08-14 | 13F | Sunbelt Securities, Inc. | 2 554 | −1,16 | 111 | −2,65 | ||||
| 2025-07-09 | 13F | Dynamic Advisor Solutions LLC | 5 667 | 1,21 | 261 | 6,12 | ||||
| 2025-07-22 | 13F | Bay Harbor Wealth Management, LLC | 7 889 | −1,45 | 363 | 3,42 | ||||
| 2025-08-12 | 13F | MAI Capital Management | 14 851 | −7,79 | 684 | −3,26 | ||||
| 2025-07-18 | 13F | Philip James Wealth Mangement, LLC | 4 805 | 0,36 | 221 | 5,24 | ||||
| 2025-07-17 | 13F | Worth Financial Advisory Group, LLC | 0 | −100,00 | 0 | |||||
| 2025-08-14 | 13F | Money Concepts Capital Corp | 12 818 | 590 | ||||||
| 2025-05-14 | 13F | Van Hulzen Asset Management, LLC | 0 | −100,00 | 0 | −100,00 | ||||
| 2025-08-14 | 13F | Wells Fargo & Company/mn | 251 200 | −0,90 | 11 565 | 3,98 | ||||
| 2025-07-23 | 13F | Steel Peak Wealth Management LLC | 15 115 | 0,03 | 696 | 4,83 | ||||
| 2025-07-02 | 13F | Dentgroup LLC | 13 310 | 0,00 | 613 | 4,79 | ||||
| 2025-04-22 | 13F | Bright Futures Wealth Management, LLC. | 7 629 | 2,10 | 324 | −1,82 | ||||
| 2025-08-01 | 13F | Envestnet Asset Management Inc | 93 421 | 15,46 | 4 301 | 21,15 | ||||
| 2025-07-24 | 13F | Jfs Wealth Advisors, Llc | 4 847 | −3,43 | 223 | 1,36 | ||||
| 2025-07-15 | 13F | Beacon Investment Advisory Services, Inc. | 18 029 | 3,09 | 830 | 8,21 | ||||
| 2025-08-15 | 13F | Tower Research Capital LLC (TRC) | 0 | −100,00 | 0 | |||||
| 2025-08-19 | 13F | Advisory Services Network, LLC | 7 734 | −18,71 | 354 | −15,11 | ||||
| 2025-07-08 | 13F | Parallel Advisors, LLC | 1 554 | −5,88 | 72 | −1,39 | ||||
| 2025-08-13 | 13F | Transce3nd, LLC | 786 | −40,54 | 36 | −37,93 | ||||
| 2025-08-15 | 13F | Captrust Financial Advisors | 24 917 | 176,30 | 1 147 | 190,38 | ||||
| 2025-07-14 | 13F | Proathlete Wealth Management Llc | 3 627 | 0,19 | 167 | 5,70 | ||||
| 2025-08-04 | 13F | Mesirow Financial Investment Management, Inc. | 14 285 | −0,24 | 658 | 4,62 | ||||
| 2025-08-14 | 13F | Citadel Advisors Llc | 4 851 | −25,12 | 223 | −21,48 | ||||
| 2025-07-17 | 13F | Halbert Hargrove Global Advisors, Llc | 115 | −0,86 | 5 | 0,00 | ||||
| 2025-08-15 | 13F | First Heartland Consultants, Inc. | 7 641 | 0,00 | 262 | −22,09 | ||||
| 2025-08-08 | 13F | Cetera Investment Advisers | 165 931 | 7,26 | 7 639 | 12,54 | ||||
| 2025-08-05 | 13F | Milestone Asset Management, Llc | 34 039 | −0,60 | 1 567 | 4,33 | ||||
| 2025-07-22 | 13F | Ellenbecker Investment Group | 49 991 | 1,21 | 2 302 | 6,18 | ||||
| 2025-07-22 | 13F | HFM Investment Advisors, LLC | 2 617 | 1,32 | 120 | 6,19 | ||||
| 2025-08-14 | 13F | Federation des caisses Desjardins du Quebec | 11 612 | 26,80 | 535 | 33,17 | ||||
| 2025-07-17 | 13F | Patton Albertson Miller Group, Llc | 45 977 | 6,07 | 2 117 | 11,31 | ||||
| 2025-08-29 | 13F | Centaurus Financial, Inc. | 8 797 | 2,68 | 0 | |||||
| 2025-07-10 | 13F | Wealth Enhancement Advisory Services, Llc | 91 624 | −20,48 | 4 200 | −16,93 | ||||
| 2025-08-05 | 13F | American Capital Advisory, LLC | 135 | 0,00 | 6 | 20,00 | ||||
| 2025-08-12 | 13F | LPL Financial LLC | 990 640 | −0,48 | 45 609 | 4,42 | ||||
| 2025-08-08 | 13F | Hartland & Co., LLC | 30 | 0,00 | 1 | 0,00 | ||||
| 2025-08-12 | 13F | Franklin Resources Inc | 1 163 | 54 | ||||||
| 2025-07-10 | 13F | Kmg Fiduciary Partners, Llc | 21 410 | 9,01 | 986 | 14,40 | ||||
| 2025-08-12 | 13F | J.w. Cole Advisors, Inc. | 29 261 | 12,48 | 1 347 | 18,05 | ||||
| 2025-08-12 | 13F | Founders Financial Alliance, LLC | 1 958 | 0,00 | 90 | 5,88 | ||||
| 2025-08-14 | 13F | McIlrath & Eck, LLC | 1 785 | 1,83 | 82 | 7,89 | ||||
| 2025-08-14 | 13F | Wiley Bros.-aintree Capital, Llc | 5 356 | 247 | ||||||
| 2025-08-08 | 13F | Larson Financial Group LLC | 0 | −100,00 | 0 | |||||
| 2025-04-10 | 13F | Retireful, LLC | 0 | −100,00 | 0 | |||||
| 2025-08-11 | 13F | HighTower Advisors, LLC | 19 391 | −0,83 | 893 | 3,96 | ||||
| 2025-07-15 | 13F | Sightline Wealth Advisors, LLC | 5 388 | 248 | ||||||
| 2025-08-06 | 13F | Columbia River Financial Group, LLC | 0 | −100,00 | 0 | |||||
| 2025-07-23 | 13F | High Note Wealth, LLC | 1 | 0,00 | 0 | |||||
| 2025-08-14 | 13F | Comerica Bank | 0 | −100,00 | 0 | |||||
| 2025-07-17 | 13F | Janney Montgomery Scott LLC | 4 494 | −64,89 | 0 | |||||
| 2025-08-05 | 13F | Bank Of Montreal /can/ | 6 137 | −12,04 | 283 | −7,84 | ||||
| 2025-05-02 | 13F | Kingsview Wealth Management, LLC | 0 | −100,00 | 0 | |||||
| 2025-07-15 | 13F | Fort Henry Capital, LLC | 22 006 | 0,07 | 1 013 | 5,08 | ||||
| 2025-08-14 | 13F | First Commonwealth Financial Corp /pa/ | 5 000 | 0,00 | 230 | 5,02 | ||||
| 2025-07-25 | 13F | Lodestar Private Asset Management Llc | 122 171 | 9,81 | 5 625 | 15,22 | ||||
| 2025-08-08 | 13F | IMA Wealth, Inc. | 11 244 | 19,78 | 498 | 26,40 | ||||
| 2025-08-11 | 13F | Estate Counselors, LLC | 5 325 | 0,00 | 245 | 5,15 | ||||
| 2025-08-12 | 13F | Archer Investment Corp | 627 | 0,32 | 29 | 3,70 | ||||
| 2025-04-22 | 13F | Duncker Streett & Co Inc | 0 | −100,00 | 0 | −100,00 | ||||
| 2025-07-29 | 13F | Aspiriant, Llc | 38 787 | 30,91 | 1 786 | 37,31 | ||||
| 2025-07-23 | 13F | West Paces Advisors Inc. | 0 | −100,00 | 0 | |||||
| 2025-08-12 | 13F | Global Retirement Partners, LLC | 2 345 | −10,15 | 108 | −5,31 | ||||
| 2025-07-18 | 13F/A | MJT & Associates Financial Advisory Group, Inc. | 65 | 0,00 | 3 | 0,00 | ||||
| 2025-08-01 | 13F | Rossby Financial, LCC | 1 236 | 0,00 | 57 | 5,66 | ||||
| 2025-07-17 | 13F | Northwest Wealth Management, Llc | 4 814 | 0,08 | 222 | 4,74 | ||||
| 2025-08-11 | 13F | FSA Wealth Management LLC | 30 | 0,00 | 2 | 0,00 | ||||
| 2025-08-14 | 13F | Ancora Advisors, LLC | 96 | 0,00 | 4 | 0,00 | ||||
| 2025-08-14 | 13F | Mercer Global Advisors Inc /adv | 0 | −100,00 | 0 | |||||
| 2025-08-04 | 13F | Spire Wealth Management | 427 | −33,49 | 20 | −32,14 | ||||
| 2025-08-07 | 13F | Wealth Forward, LLC | 8 782 | −0,19 | 404 | 4,66 | ||||
| 2025-07-01 | 13F | Private Client Services, Llc | 5 529 | 7,05 | 255 | 12,39 | ||||
| 2025-07-25 | 13F | Concurrent Investment Advisors, LLC | 12 229 | 563 | ||||||
| 2025-08-14 | 13F | Stifel Financial Corp | 17 131 | 33,03 | 789 | 39,47 | ||||
| 2025-07-24 | 13F | Stonebridge Financial Group, LLC | 4 707 | 0,41 | 217 | 5,37 | ||||
| 2025-07-11 | 13F | Farther Finance Advisors, LLC | 1 937 | 85,18 | 89 | 97,78 | ||||
| 2025-08-12 | 13F | SRS Capital Advisors, Inc. | 7 343 | 1,27 | 338 | 6,29 | ||||
| 2025-07-15 | 13F | FLP Wealth Management, LLC | 0 | −100,00 | 0 | |||||
| 2025-07-17 | 13F | Nelson, Van Denburg & Campbell Wealth Management Group, LLC | 20 317 | 3,59 | 935 | 8,72 | ||||
| 2025-08-14 | 13F/A | Barclays Plc | 5 000 | 0 | ||||||
| 2025-08-13 | 13F | Nicolet Advisory Services, Llc | 7 714 | −4,30 | 353 | 3,53 | ||||
| 2025-07-07 | 13F | Thurston, Springer, Miller, Herd & Titak, Inc. | 31 476 | 2 551,73 | 1 449 | 2 686,54 | ||||
| 2025-08-14 | 13F | Ausdal Financial Partners, Inc. | 12 534 | −14,29 | 577 | −9,98 | ||||
| 2025-07-21 | 13F | Ameritas Advisory Services, LLC | 128 093 | 18,26 | 5 897 | 24,10 | ||||
| 2025-08-19 | 13F | Asset Dedication, LLC | 0 | −100,00 | 0 | |||||
| 2025-07-22 | 13F | Unique Wealth, Llc | 14 286 | −8,34 | 658 | −3,81 | ||||
| 2025-07-25 | 13F | Cwm, Llc | 3 944 | −18,80 | 0 | |||||
| 2025-08-12 | 13F | Insigneo Advisory Services, Llc | 27 882 | 0,09 | 1 284 | 4,99 | ||||
| 2025-08-05 | 13F | Integrity Financial Corp /WA | 12 462 | −6,18 | 574 | −1,55 | ||||
| 2025-07-22 | 13F | Mascoma Wealth Management LLC | 128 | −60,37 | 6 | −64,29 | ||||
| 2025-05-12 | 13F | Aveo Capital Partners, LLC | 0 | −100,00 | 0 | |||||
| 2025-07-28 | 13F | Harbour Investments, Inc. | 22 970 | 28,56 | 1 058 | 34,99 | ||||
| 2025-07-09 | 13F | Westmount Partners, LLC | 4 367 | −8,79 | 201 | −4,29 | ||||
| 2025-09-03 | 13F | American Trust | 98 085 | 4 516 | ||||||
| 2025-07-30 | 13F | Mason & Associates, LLC | 8 271 | −25,89 | 381 | −22,29 | ||||
| 2025-08-11 | 13F | Aptus Capital Advisors, LLC | 111 | −3,48 | 5 | 0,00 | ||||
| 2025-07-14 | 13F | AdvisorNet Financial, Inc | 3 908 | 6,49 | 180 | 11,18 | ||||
| 2025-08-12 | 13F | Seeds Investor Llc | 70 234 | 897,78 | 3 234 | 949,68 | ||||
| 2025-08-14 | 13F | Ameriprise Financial Inc | 281 931 | 6,74 | 12 995 | 11,70 | ||||
| 2025-05-13 | 13F | CacheTech Inc. | 0 | −100,00 | 0 | |||||
| 2025-05-14 | 13F | Orion Portfolio Solutions, LLC | 10 630 | 0,00 | 462 | 0,00 | ||||
| 2025-05-30 | NP | ERNZ - TrueShares Active Yield ETF | 3 154 | 138 | ||||||
| 2025-07-23 | 13F | TPG Financial Advisors, LLC | 4 903 | −3,54 | 226 | 0,90 | ||||
| 2025-08-11 | 13F | Nomura Asset Management Co Ltd | 5 500 | 0,00 | 253 | 4,98 | ||||
| 2025-07-25 | 13F | Atria Wealth Solutions, Inc. | 14 784 | −29,26 | 681 | −25,85 | ||||
| 2025-07-28 | 13F | RFG Advisory, LLC | 11 763 | 0,95 | 542 | 5,87 | ||||
| 2025-07-11 | 13F | Mkd Wealth Coaches, Llc | 6 528 | 7,53 | 301 | 12,78 | ||||
| 2025-07-17 | 13F | Wolff Wiese Magana Llc | 629 | 0,32 | 29 | 3,70 | ||||
| 2025-08-12 | 13F | Proequities, Inc. | 0 | 0 | ||||||
| 2025-05-02 | 13F | Capital A Wealth Management, LLC | 1 011 | −27,27 | 44 | −26,67 | ||||
| 2025-07-15 | 13F | Legacy Financial Group LLC | 16 388 | 3,79 | 755 | 8,96 | ||||
| 2025-08-06 | 13F | Golden State Wealth Management, LLC | 0 | −100,00 | 0 | |||||
| 2025-08-08 | 13F | Investment Partners, Ltd. | 9 552 | 0,58 | 440 | 5,53 | ||||
| 2025-08-18 | 13F | Pacific Center for Financial Services | 1 554 | 0,58 | 72 | 5,97 | ||||
| 2025-07-08 | 13F | Nbc Securities, Inc. | 200 | −78,95 | 0 | |||||
| 2025-07-24 | 13F | McKinley Carter Wealth Services, Inc. | 6 078 | −0,51 | 280 | 4,10 | ||||
| 2025-07-18 | 13F | SOA Wealth Advisors, LLC. | 2 659 | −17,68 | 122 | −13,48 | ||||
| 2025-08-04 | 13F | Pensionmark Financial Group, Llc | 18 254 | 19,79 | 840 | 25,75 | ||||
| 2025-07-24 | 13F | JNBA Financial Advisors | 1 027 | −0,77 | 47 | 4,44 | ||||
| 2025-08-13 | 13F | Lido Advisors, LLC | 8 005 | 0,20 | 369 | 5,14 | ||||
| 2025-08-07 | 13F | Runnymede Capital Advisors, Inc. | 0 | −100,00 | 0 | |||||
| 2025-07-17 | 13F | Kavar Capital Partners Group, Llc | 267 607 | 12 321 | ||||||
| 2025-08-01 | 13F | Brinker Capital Investments, LLC | 0 | −100,00 | 0 | −100,00 | ||||
| 2025-08-08 | 13F | Avantax Advisory Services, Inc. | 21 422 | 6,58 | 986 | 11,79 | ||||
| 2025-08-14 | 13F | Harwood Advisory Group, LLC | 2 526 | −9,85 | 116 | −4,13 | ||||
| 2025-08-08 | 13F | Thrive Capital Management, LLC | 27 346 | 1 259 | ||||||
| 2025-08-04 | 13F | Jim Saulnier & Associates, Llc | 27 651 | −3,00 | 1 273 | 1,84 | ||||
| 2025-08-06 | 13F | AE Wealth Management LLC | 104 045 | 452,08 | 4 790 | 479,90 | ||||
| 2025-08-07 | 13F | CENTRAL TRUST Co | 10 117 | −8,05 | 466 | −3,53 | ||||
| 2025-07-30 | 13F | Onyx Bridge Wealth Group LLC | 76 073 | −0,52 | 3 502 | 4,38 | ||||
| 2025-08-06 | 13F | Richard Bernstein Advisors LLC | 57 | 1 325,00 | 3 | |||||
| 2025-07-18 | 13F | SimpliFi, Inc. | 8 443 | 0,40 | 389 | 5,43 | ||||
| 2025-08-14 | 13F | Mendel Capital Management LLC | 9 280 | 0,00 | 427 | 4,91 | ||||
| 2025-08-01 | 13F | Taylor Financial Group, Inc. | 68 457 | 13,50 | 3 152 | 19,09 | ||||
| 2025-08-08 | 13F | Foundations Investment Advisors, LLC | 502 887 | 17,78 | 23 153 | 23,58 | ||||
| 2025-07-31 | 13F | Ssa Swiss Advisors Ag | 4 433 | −93,75 | 204 | −93,44 | ||||
| 2025-08-13 | 13F | Scotia Capital Inc. | 5 934 | 8,21 | 273 | 13,75 | ||||
| 2025-08-11 | 13F | Cornerstone Planning Group LLC | 4 081 | −7,82 | 188 | −1,58 | ||||
| 2025-08-14 | 13F | Bank Of America Corp /de/ | 200 005 | 0,55 | 9 208 | 5,50 | ||||
| 2025-07-17 | 13F | Sound Income Strategies, LLC | 1 032 | 48 | ||||||
| 2025-08-13 | 13F | StoneX Group Inc. | 9 582 | −7,90 | 441 | −3,29 | ||||
| 2025-07-15 | 13F | RTD Financial Advisors, Inc. | 8 771 | 0,09 | 404 | 4,95 | ||||
| 2025-08-13 | 13F | Plan Group Financial, LLC | 16 103 | −2,84 | 741 | 1,93 | ||||
| 2025-08-14 | 13F | Eight 31 Financial Llc | 21 517 | 1,09 | 991 | 6,00 | ||||
| 2025-07-23 | 13F | Clear Creek Financial Management, LLC | 13 248 | −4,18 | 610 | 0,50 | ||||
| 2025-08-15 | 13F | Equitable Holdings, Inc. | 7 057 | 18,70 | 325 | 24,62 | ||||
| 2025-07-28 | 13F | Sagespring Wealth Partners, Llc | 6 803 | −0,38 | 313 | 4,68 | ||||
| 2025-08-14 | 13F | Gould Capital, LLC | 95 | −94,31 | 4 | −94,52 | ||||
| 2025-07-24 | 13F | IFP Advisors, Inc | 411 | 0,00 | 19 | 0,00 | ||||
| 2025-07-29 | 13F | Signature Estate & Investment Advisors Llc | 4 364 | 201 | ||||||
| 2025-08-13 | 13F | Jones Financial Companies Lllp | 17 606 | 39,14 | 808 | 45,67 | ||||
| 2025-09-04 | 13F/A | Advisor Group Holdings, Inc. | 231 706 | 2,58 | 10 666 | 7,61 | ||||
| 2025-08-14 | 13F | Sentinus, LLC | 20 891 | 35,85 | 962 | 42,58 | ||||
| 2025-07-09 | 13F | LifePlan Financial, LLC | 37 643 | −0,89 | 1 733 | 4,02 | ||||
| 2025-08-14 | 13F | IHT Wealth Management, LLC | 7 938 | −7,02 | 365 | −2,41 | ||||
| 2025-08-14 | 13F | Fmr Llc | 3 867 | 31,13 | 178 | 37,98 | ||||
| 2025-08-14 | 13F | Royal Bank Of Canada | 277 462 | 0,75 | 12 774 | 5,71 | ||||
| 2025-08-08 | 13F | Creative Planning | 6 202 | 25,44 | 286 | 31,94 | ||||
| 2025-08-04 | 13F | Syverson Strege & Co | 7 353 | 1,11 | 339 | 5,96 | ||||
| 2025-04-22 | 13F | Castleview Partners, Llc | 0 | −100,00 | 0 | |||||
| 2025-08-15 | 13F | Kestra Advisory Services, LLC | 43 206 | 8,66 | 1 989 | 14,05 | ||||
| 2025-08-11 | 13F | Private Advisor Group, LLC | 45 927 | 441,91 | 2 114 | 469,81 | ||||
| 2025-08-12 | 13F | Hanover Advisors Inc | 5 890 | 271 | ||||||
| 2025-08-08 | 13F | Comprehensive Financial Planning, Inc./PA | 1 177 | 0,68 | 54 | 5,88 | ||||
| 2025-08-14 | 13F | Warren Averett Asset Management, LLC | 77 284 | 2,98 | 3 558 | 8,08 | ||||
| 2025-08-14 | 13F | Visionary Wealth Advisors | 7 921 | 7,07 | 365 | 12,35 | ||||
| 2025-08-11 | 13F | Brown Brothers Harriman & Co | 1 645 | 76 | ||||||
| 2025-08-13 | 13F | Capital Analysts, Inc. | 373 | −1,58 | 0 | |||||
| 2025-08-04 | 13F | Creekmur Asset Management LLC | 209 | 0,00 | 10 | 0,00 | ||||
| 2025-05-13 | 13F | Compass Financial Group, INC/SD | 0 | −100,00 | 0 | |||||
| 2025-07-14 | 13F | Financial Enhancement Group LLC | 6 246 | 0,00 | 285 | 6,37 | ||||
| 2025-08-04 | 13F | Creative Financial Designs Inc /adv | 425 | 507,14 | 20 | 533,33 | ||||
| 2025-05-12 | 13F | Independent Advisor Alliance | 0 | −100,00 | 0 | |||||
| 2025-05-08 | 13F | Great Valley Advisor Group, Inc. | 0 | −100,00 | 0 | −100,00 | ||||
| 2025-07-18 | 13F | Northstar Group, Inc. | 18 100 | −1,66 | 833 | 3,22 | ||||
| 2025-04-01 | 13F | First Financial Bank - Trust Division | 0 | −100,00 | 0 | |||||
| 2025-08-08 | 13F | CFO4Life Group, LLC | 7 935 | 0,00 | 365 | 4,89 | ||||
| 2025-08-14 | 13F | Smartleaf Asset Management LLC | 239 | 11 | ||||||
| 2025-07-23 | 13F | Nbt Bank N A /ny | 75 | 0,00 | 3 | 0,00 | ||||
| 2025-08-14 | 13F | TCG Advisory Services, LLC | 280 175 | 2,32 | 12 899 | 7,36 | ||||
| 2025-08-14 | 13F | Integrated Wealth Concepts LLC | 19 319 | 170,76 | 889 | 184,03 | ||||
| 2025-08-11 | 13F | Pineridge Advisors LLC | 955 | 0,21 | 44 | 4,88 | ||||
| 2025-07-31 | 13F | Heirloom Wealth Management | 9 528 | 11,48 | 439 | 16,80 | ||||
| 2025-07-10 | 13F | Focus Financial Network, Inc. | 97 221 | −23,04 | 4 476 | −19,25 | ||||
| 2025-07-30 | 13F | Brookstone Capital Management | 74 295 | −8,99 | 3 421 | −4,52 | ||||
| 2025-07-31 | 13F | Glass Jacobson Investment Advisors llc | 0 | −100,00 | 0 | |||||
| 2025-08-15 | 13F | High Falls Advisors, Inc | 0 | −100,00 | 0 | |||||
| 2025-07-16 | 13F | Leading Edge Financial Planning LLC | 7 370 | 0,00 | 339 | 4,95 | ||||
| 2025-07-03 | 13F | Fiduciary Financial Group, Llc | 4 914 | 0,53 | 226 | 9,22 | ||||
| 2025-08-15 | 13F | Morgan Stanley | 408 327 | −27,90 | 18 799 | −24,36 | ||||
| 2025-07-31 | 13F | Cardinal Point Capital Management, ULC | 4 384 | 202 | ||||||
| 2025-08-08 | 13F | Gts Securities Llc | 41 627 | 77,73 | 1 917 | 86,56 | ||||
| 2025-08-01 | 13F | Austin Private Wealth, LLC | 6 955 | 0,00 | 320 | 4,92 | ||||
| 2025-07-17 | 13F | Tempus Wealth Planning, LLC | 8 394 | −3,65 | 386 | 1,05 | ||||
| 2025-08-08 | 13F | Capital Investment Advisory Services, LLC | 1 883 | −22,00 | 87 | −18,10 | ||||
| 2025-08-11 | 13F | Bellwether Advisors, LLC | 372 | 5,38 | 17 | 13,33 | ||||
| 2025-08-05 | 13F | Integrity Wealth Solutions LLC | 4 466 | 206 | ||||||
| 2025-08-14 | 13F | Aqr Capital Management Llc | 4 894 | 225 | ||||||
| 2025-07-21 | 13F | Consilium Wealth Advisory, LLC | 92 966 | 10,39 | 4 280 | 15,83 | ||||
| 2025-08-18 | 13F | N.E.W. Advisory Services LLC | 0 | −100,00 | 0 | |||||
| 2025-07-22 | 13F | Wealthcare Advisory Partners LLC | 5 898 | 0,77 | 272 | 5,86 | ||||
| 2025-08-13 | 13F | Royal Fund Management, LLC | 106 655 | 2,41 | 4 910 | 7,23 | ||||
| 2025-07-18 | 13F | Truist Financial Corp | 90 280 | 0,13 | 4 156 | 5,06 | ||||
| 2025-07-01 | 13F | Harbor Investment Advisory, Llc | 1 487 | 1,71 | 68 | 6,25 | ||||
| 2025-07-25 | 13F | Concord Wealth Partners | 186 | 0,54 | 9 | 0,00 | ||||
| 2025-08-12 | 13F | Archvest Wealth Advisors, Inc. | 5 615 | 2,74 | 259 | 7,95 | ||||
| 2025-08-12 | 13F | Jpmorgan Chase & Co | 45 472 | 148,26 | 2 094 | 160,65 | ||||
| 2025-08-12 | 13F | Financial Advocates Investment Management | 89 455 | 3,45 | 4 119 | 8,54 | ||||
| 2025-08-12 | 13F | BlueStem Wealth Partners, LLC | 28 606 | −9,29 | 1 317 | −4,77 | ||||
| 2025-08-15 | 13F | Kestra Investment Management, LLC | 900 | 0,00 | 39 | 0,00 | ||||
| 2025-07-15 | 13F | Garrett Investment Advisors LLC | 5 414 | −7,56 | 249 | −3,11 | ||||
| 2025-08-12 | 13F | Wayfinding Financial, LLC | 0 | −100,00 | 0 | |||||
| 2025-08-13 | 13F | Townsquare Capital Llc | 0 | −100,00 | 0 | |||||
| 2025-08-14 | 13F | Qube Research & Technologies Ltd | 355 | −85,32 | 16 | −84,91 | ||||
| 2025-07-24 | 13F | Brandywine Oak Private Wealth Llc | 0 | −100,00 | 0 | |||||
| 2025-05-13 | 13F | Adams Wealth Management | 0 | −100,00 | 0 | |||||
| 2025-08-04 | 13F | Atria Investments Llc | 4 683 | 216 | ||||||
| 2025-08-04 | 13F | Assetmark, Inc | 868 | 191,28 | 40 | 200,00 | ||||
| 2025-04-15 | 13F | Noble Wealth Management PBC | 13 | 0,00 | 1 | |||||
| 2025-08-11 | 13F | One Capital Management, LLC | 33 141 | −48,34 | 1 526 | −45,83 | ||||
| 2025-08-14 | 13F | CoreCap Advisors, LLC | 3 783 | 9,34 | 174 | 15,23 | ||||
| 2025-04-11 | 13F | Congress Asset Management Co /ma | 0 | −100,00 | 0 | |||||
| 2025-08-07 | 13F | Allworth Financial LP | 3 287 | −2,26 | 151 | 3,42 | ||||
| 2025-08-11 | 13F | United Capital Financial Advisers, Llc | 8 881 | −1,82 | 409 | 3,03 | ||||
| 2025-08-11 | 13F | TRUE Private Wealth Advisors | 58 524 | −2,81 | 2 694 | 1,97 | ||||
| 2025-07-08 | 13F | Gallacher Capital Management LLC | 25 528 | 3,25 | 1 175 | 8,39 | ||||
| 2025-07-17 | 13F | Smith Anglin Financial, LLC | 51 096 | −2,15 | 2 352 | 2,66 | ||||
| 2025-08-07 | 13F | Resources Investment Advisors, LLC. | 6 963 | 321 | ||||||
| 2025-07-25 | 13F | Sovereign Financial Group, Inc. | 20 735 | 2,95 | 955 | 8,04 | ||||
| 2025-07-29 | 13F | Salomon & Ludwin, LLC | 1 780 | 0,00 | 82 | 3,85 | ||||
| 2025-08-06 | 13F | Vestmark Advisory Solutions, Inc. | 0 | −100,00 | 0 | |||||
| 2025-08-05 | 13F | Atlas Private Wealth Advisors | 8 392 | 0,00 | 386 | 4,89 | ||||
| 2025-07-17 | 13F | Archford Capital Strategies, LLC | 7 407 | −5,58 | 341 | −0,87 | ||||
| 2025-08-11 | 13F | Elite Financial, Inc. | 0 | −100,00 | 0 | |||||
| 2025-08-12 | 13F | BlackRock, Inc. | 2 926 402 | 0,55 | 134 732 | 5,50 | ||||
| 2025-07-18 | 13F | Marino, Stram & Associates Llc | 17 494 | −0,31 | 805 | 4,68 | ||||
| 2025-08-14 | 13F | Oxford Financial Group Ltd | 552 | 0,00 | 25 | 4,17 | ||||
| 2025-08-14 | 13F | Fort Point Capital Partners LLC | 9 951 | −4,49 | 458 | 0,22 | ||||
| 2025-08-14 | 13F | GWM Advisors LLC | 19 186 | 0,78 | 883 | 5,75 | ||||
| 2025-05-14 | 13F | Zacks Investment Management | 0 | −100,00 | 0 | |||||
| 2025-07-14 | 13F | UMA Financial Services, Inc. | 2 047 | 94 | ||||||
| 2025-05-02 | 13F | Transcendent Capital Group LLC | 0 | −100,00 | 0 | |||||
| 2025-07-29 | 13F | Stratos Wealth Partners, LTD. | 10 504 | 2,46 | 484 | 7,57 | ||||
| 2025-07-28 | 13F | Mutual Advisors, LLC | 69 302 | 0,29 | 3 197 | 5,93 | ||||
| 2025-08-13 | 13F | GeoWealth Management, LLC | 16 584 | −51,93 | 763 | −49,57 | ||||
| 2025-08-14 | 13F | Godshalk Welsh Capital Management, Inc. | 17 821 | 0,14 | 820 | 5,13 | ||||
| 2025-07-17 | 13F | Moss Adams Wealth Advisors LLC | 9 179 | 0,38 | 423 | 5,24 | ||||
| 2025-04-14 | 13F | NewSquare Capital LLC | 0 | −100,00 | 0 | |||||
| 2025-07-16 | 13F/A | CX Institutional | 234 | 0,00 | 0 | |||||
| 2025-07-23 | 13F | Venturi Wealth Management, LLC | 5 655 | 9,83 | 260 | 15,56 | ||||
| 2025-07-31 | 13F | United Community Bank | 500 | 0,00 | 23 | 9,52 | ||||
| 2025-07-31 | 13F | Oppenheimer Asset Management Inc. | 0 | −100,00 | 0 | |||||
| 2025-08-05 | 13F | Carolinas Wealth Consulting Llc | 0 | −100,00 | 0 | −100,00 | ||||
| 2025-08-12 | 13F | Wood Tarver Financial Group, LLC | 465 | −8,28 | 0 | −100,00 | ||||
| 2025-08-05 | 13F | Claro Advisors LLC | 6 350 | 0,79 | 292 | 5,80 | ||||
| 2025-08-06 | 13F | Commonwealth Equity Services, Llc | 141 683 | 1,84 | 7 | 0,00 | ||||
| 2025-08-14 | 13F | Aprio Wealth Management, LLC | 5 700 | 0,00 | 262 | 4,80 | ||||
| 2025-08-06 | 13F | SOUTH STATE Corp | 1 019 | −56,86 | 47 | −55,34 | ||||
| 2025-04-22 | 13F | Flagship Harbor Advisors, Llc | 0 | −100,00 | 0 | |||||
| 2025-08-05 | 13F | Prosperity Consulting Group, LLC | 28 849 | 16,43 | 1 328 | 22,17 | ||||
| 2025-08-14 | 13F | UBS Group AG | 35 935 | −37,74 | 1 654 | −34,68 |