Grundläggande statistik
| Institutionella ägare | 257 total, 246 long only, 2 short only, 9 long/short - change of 21,13% MRQ |
| Genomsnittlig portföljallokering | 0.1802 % - change of 48,32% MRQ |
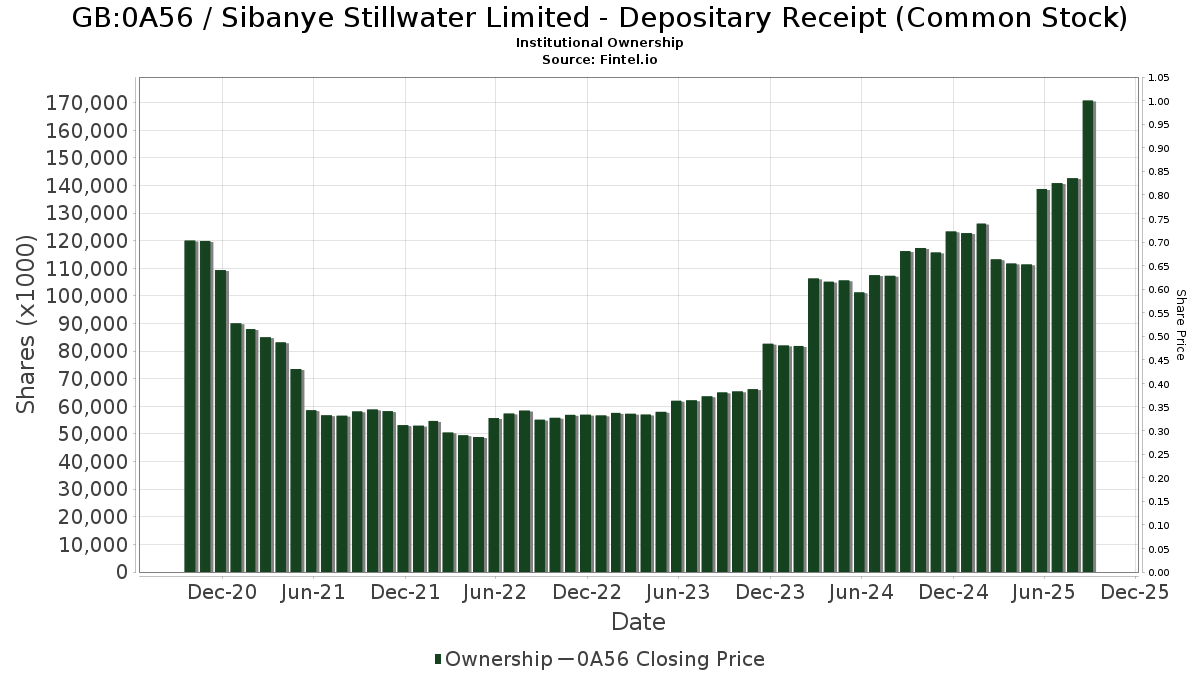
| Institutionella aktier (lång) | 170 806 693 (ex 13D/G) - change of 34,29MM shares 25,12% MRQ |
| Institutionellt värde (lång) | $ 1 180 760 USD ($1000) |
Institutionellt ägande och aktieägare
Sibanye Stillwater Limited - Depositary Receipt (Common Stock) (GB:0A56) har 257 Institutionella ägare och aktieägare som har lämnat in 13D/G- eller 13F-formulär till Securities Exchange Commission (SEC). Dessa institut innehar totalt 170,827,776 aktier. Största aktieägare inkluderar Exor Capital LLP, D. E. Shaw & Co., Inc., Nuveen, LLC, Morgan Stanley, Two Sigma Investments, Lp, Jpmorgan Chase & Co, Condire Management, LP, QCSTRX - Stock Account Class R1, Two Sigma Advisers, Lp, and Voloridge Investment Management, Llc .
Sibanye Stillwater Limited - Depositary Receipt (Common Stock) (LSE:0A56) Institutionell ägarstruktur visar institutioners och fonders nuvarande positioner i företaget, samt de senaste förändringarna i positionernas storlek. Större aktieägare kan vara enskilda investerare, fonder, hedgefonder eller institutioner. Bilaga 13D visar att investeraren äger (eller ägde) mer än 5% av företaget och avser (eller avsåg) att aktivt eftersträva en förändring av affärsstrategin. Schedule 13G indikerar en passiv investering på över 5%.
Fondsentimentets poäng
Fondsentimentet poängen(fka Ägarackumulation-poäng) visar vilka aktier som är mest köpta av fonder. Det är resultatet av en sofistikerad kvantitativ flerfaktormodell som identifierar företag med de högsta nivåerna av institutionell ackumulering. Poängsättningsmodellen använder en kombination av den totala ökningen av redovisade ägare, förändringarna i portföljallokeringarna för dessa ägare och andra mått. Siffran sträcker sig från 0 till 100, där högre siffror indikerar en högre nivå av ackumulering i förhållande till sina konkurrenter, och 50 är genomsnittet.
Uppdateringsfrekvens: Dagligen
Se Ownership Explorer, som innehåller en lista över de högst rankade företagen.
13F- och NPORT-arkiveringar
Detaljer om 13F-arkiveringar är gratis. Detaljer om NP-arkiveringar kräver ett premiummedlemskap. Gröna rader indikerar nya positioner. Röda rader indikerar stängda positioner. Klicka på länk symbolen för att se hela transaktionshistoriken.
Uppgradera
för att låsa upp premiumdata och exportera till Excel ![]() .
.
| Fil Datum | Källa | Investerare | Typ | Genomsnittligt pris (beräknat) |
Aktier | Δ Aktier (%) |
Rapporterat värde (1000 USD) |
Δ Värde (%) |
Portföljallokering (%) |
|
|---|---|---|---|---|---|---|---|---|---|---|
| 2025-08-08 | 13F | Abc Arbitrage Sa | 1 119 817 | 8 085 | ||||||
| 2025-08-14 | 13F | Kelly Lawrence W & Associates Inc/ca | 4 547 | 0,00 | 33 | 60,00 | ||||
| 2025-07-21 | 13F | Patriot Financial Group Insurance Agency, LLC | 0 | −100,00 | 0 | |||||
| 2025-08-05 | 13F | BCGM Wealth Management, LLC | 692 934 | 3,93 | 5 003 | 63,84 | ||||
| 2025-08-14 | 13F | Axa S.a. | 422 521 | 0,00 | 3 051 | 57,62 | ||||
| 2025-08-12 | 13F | Coldstream Capital Management Inc | 0 | −100,00 | 0 | −100,00 | ||||
| 2025-05-15 | 13F | Covalis Capital Llp | 0 | −100,00 | 0 | |||||
| 2025-08-04 | 13F | Creekmur Asset Management LLC | 114 | −1,72 | 1 | |||||
| 2025-08-12 | 13F | Resolute Wealth Strategies, LLC | 0 | −100,00 | 0 | |||||
| 2025-08-14 | 13F | Eschler Asset Management LLP | 251 590 | 1 816 | ||||||
| 2025-08-11 | 13F | EntryPoint Capital, LLC | 43 367 | −3,71 | 313 | 51,94 | ||||
| 2025-08-14 | 13F | Linden Advisors Lp | 1 570 808 | 842,81 | 11 341 | 1 386,37 | ||||
| 2025-08-12 | 13F | Global Retirement Partners, LLC | 233 | 2 | ||||||
| 2025-07-24 | 13F | Comprehensive Money Management Services LLC | 35 301 | −12,41 | 255 | 38,04 | ||||
| 2025-08-14 | 13F | GWM Advisors LLC | 11 000 | 120,00 | 79 | 259,09 | ||||
| 2025-05-12 | 13F | Peapack Gladstone Financial Corp | 0 | −100,00 | 0 | |||||
| 2025-08-14 | 13F | Mariner, LLC | 100 731 | 133,43 | 727 | 269,04 | ||||
| 2025-08-05 | 13F | Westside Investment Management, Inc. | 2 080 | 15 | ||||||
| 2025-08-04 | 13F | Beirne Wealth Consulting Services, LLC | 15 472 | 112 | ||||||
| 2025-07-11 | 13F | Farther Finance Advisors, LLC | 6 805 | 745,34 | 49 | 1 533,33 | ||||
| 2025-08-14 | 13F | Point72 Asset Management, L.P. | 383 800 | 44,99 | 2 771 | 128,63 | ||||
| 2025-08-01 | 13F | Petra Financial Advisors Inc | 56 445 | 4,84 | 408 | 65,45 | ||||
| 2025-08-12 | 13F | Virtu Financial LLC | 49 536 | 0 | ||||||
| 2025-08-08 | 13F | Avantax Advisory Services, Inc. | 20 359 | 15,29 | 147 | 82,50 | ||||
| 2025-08-11 | 13F | Citigroup Inc | 7 272 | −82,39 | 53 | −72,49 | ||||
| 2025-08-13 | 13F | FORA Capital, LLC | 0 | −100,00 | 0 | |||||
| 2025-08-26 | NP | GOAU - U.S. Global GO GOLD and Precious Metal Miners ETF | 556 542 | −9,74 | 4 018 | 38,36 | ||||
| 2025-08-14 | 13F | Aqr Capital Management Llc | 161 226 | 303,98 | 1 164 | 539,56 | ||||
| 2025-08-14 | 13F | Two Sigma Securities, Llc | 21 248 | −69,52 | 153 | −52,04 | ||||
| 2025-06-26 | NP | DFEM - Dimensional Emerging Markets Core Equity 2 ETF | 150 978 | 0,00 | 702 | 22,09 | ||||
| 2025-08-27 | 13F/A | Squarepoint Ops LLC | Call | 77 100 | 557 | |||||
| 2025-08-14 | 13F | SWAN Capital LLC | 140 | 1 | ||||||
| 2025-08-27 | 13F/A | Squarepoint Ops LLC | Put | 370 000 | −11,01 | 2 671 | 40,28 | |||
| 2025-08-14 | 13F | Hara Capital LLC | 6 813 | −86,75 | 49 | −79,15 | ||||
| 2025-08-27 | 13F/A | Squarepoint Ops LLC | 78 115 | −70,11 | 564 | −52,93 | ||||
| 2025-06-26 | NP | DFEV - Dimensional Emerging Markets Value ETF | 35 053 | −1,81 | 163 | 19,12 | ||||
| 2025-07-31 | 13F | Cambridge Investment Research Advisors, Inc. | 41 993 | 0 | ||||||
| 2025-06-26 | NP | DEXC - Dimensional Emerging Markets ex China Core Equity ETF | 48 386 | 14,51 | 225 | 40,00 | ||||
| 2025-07-09 | 13F | Fermata Advisors, LLC | 12 059 | −26,78 | 87 | 16,00 | ||||
| 2025-08-07 | 13F | Connor, Clark & Lunn Investment Management Ltd. | 12 393 | 89 | ||||||
| 2025-08-13 | 13F | Marshall Wace, Llp | 4 752 858 | 77,04 | 34 316 | 179,10 | ||||
| 2025-08-14 | 13F | Banque Transatlantique SA | 0 | −100,00 | 0 | |||||
| 2025-08-14 | 13F | Wetherby Asset Management Inc | 10 430 | −3,86 | 75 | 114,29 | ||||
| 2025-08-15 | 13F | Morgan Stanley | 7 558 590 | 192,56 | 54 573 | 361,23 | ||||
| 2025-07-31 | 13F | Linden Thomas Advisory Services, LLC | 22 690 | 164 | ||||||
| 2025-08-08 | 13F | SBI Securities Co., Ltd. | 37 417 | −7,06 | 270 | 46,74 | ||||
| 2025-08-14 | 13F | UBS Group AG | 3 193 771 | −71,55 | 23 059 | −55,15 | ||||
| 2025-04-17 | 13F | Exchange Traded Concepts, Llc | 0 | −100,00 | 0 | |||||
| 2025-08-14 | 13F | UBS Group AG | Call | 113 300 | −79,77 | 818 | −68,10 | |||
| 2025-07-30 | NP | LENS - Sarmaya Thematic ETF | 26 815 | 163 | ||||||
| 2025-08-14 | 13F | Balyasny Asset Management Llc | 35 991 | −97,44 | 260 | −95,97 | ||||
| 2025-08-05 | 13F | X-Square Capital, LLC | 42 147 | 0 | ||||||
| 2025-08-13 | 13F | Arrowstreet Capital, Limited Partnership | 3 495 525 | 1 136,51 | 25 238 | 1 850,31 | ||||
| 2025-08-14 | 13F | MIRAE ASSET GLOBAL ETFS HOLDINGS Ltd. | 8 140 | 14,65 | 57 | 83,87 | ||||
| 2025-08-13 | 13F | Invesco Ltd. | 0 | −100,00 | 0 | |||||
| 2025-08-14 | 13F/A | Barclays Plc | 316 865 | 296,08 | 2 | |||||
| 2025-08-01 | 13F | Banco Santander, S.A. | 32 926 | 0,00 | 238 | 58,00 | ||||
| 2025-07-28 | NP | AVSE - Avantis Responsible Emerging Markets Equity ETF | 36 031 | 148,34 | 219 | 376,09 | ||||
| 2025-07-21 | 13F | Hilltop National Bank | 2 102 | 0,00 | 15 | 150,00 | ||||
| 2025-08-13 | 13F | Wealthquest Corp | 0 | −100,00 | 0 | −100,00 | ||||
| 2025-08-11 | 13F | Raiffeisen Bank International AG | 1 534 | 0,00 | 11 | 83,33 | ||||
| 2025-08-12 | 13F | Dimensional Fund Advisors Lp | 2 863 593 | −2,17 | 20 664 | 54,32 | ||||
| 2025-08-13 | 13F | Hartree Partners, LP | 20 000 | 144 | ||||||
| 2025-08-14 | 13F | Condire Management, LP | 6 386 739 | 68,49 | 46 112 | 165,62 | ||||
| 2025-08-28 | NP | GHTA - Goose Hollow Tactical Allocation ETF | 50 000 | 361 | ||||||
| 2025-08-14 | 13F | Two Sigma Investments, Lp | Put | 1 810 600 | 0,00 | 13 073 | 57,65 | |||
| 2025-07-28 | 13F | Kiker Wealth Management, LLC | 20 000 | 0,00 | 144 | 58,24 | ||||
| 2025-08-14 | 13F | Two Sigma Investments, Lp | 7 250 160 | −16,34 | 52 346 | 31,88 | ||||
| 2025-08-18 | 13F/A | National Bank Of Canada /fi/ | 317 714 | 5 573,46 | 2 293 | 9 450,00 | ||||
| 2025-05-13 | 13F | Oak Grove Capital LLC | 0 | −100,00 | 0 | −100,00 | ||||
| 2025-07-08 | 13F | Parallel Advisors, LLC | 5 465 | 26,71 | 39 | 105,26 | ||||
| 2025-08-13 | 13F | Northern Trust Corp | 1 131 472 | 12,38 | 8 169 | 77,16 | ||||
| 2025-08-12 | 13F | Dynamic Technology Lab Private Ltd | 42 178 | 70,49 | 305 | 169,91 | ||||
| 2025-07-16 | 13F | Strategic Investment Solutions, Inc. /IL | 5 000 | 36 | ||||||
| 2025-08-08 | 13F | Pnc Financial Services Group, Inc. | 1 521 | −65,71 | 11 | −50,00 | ||||
| 2025-08-14 | 13F | Group One Trading, L.p. | 720 768 | −34,76 | 5 204 | 2,83 | ||||
| 2025-08-14 | 13F | Susquehanna International Group, Llp | 261 773 | −80,69 | 1 890 | −69,57 | ||||
| 2025-05-14 | 13F | Itau Unibanco Holding S.A. | 0 | −100,00 | 0 | |||||
| 2025-08-14 | 13F | Susquehanna International Group, Llp | Call | 2 417 000 | 116,83 | 17 451 | 241,82 | |||
| 2025-08-14 | 13F | Susquehanna International Group, Llp | Put | 1 051 000 | 4,67 | 7 588 | 65,03 | |||
| 2025-07-30 | 13F | DekaBank Deutsche Girozentrale | 80 000 | 0,00 | 1 | |||||
| 2025-08-05 | 13F | Simplex Trading, Llc | 0 | −100,00 | 0 | |||||
| 2025-08-14 | 13F | Van Eck Associates Corp | 112 405 | 7,00 | 1 | |||||
| 2025-08-14 | 13F | Verition Fund Management LLC | 126 568 | 914 | ||||||
| 2025-08-14 | 13F | Stifel Financial Corp | 281 493 | 10,38 | 2 032 | 74,12 | ||||
| 2025-08-12 | 13F | BlackRock, Inc. | 3 094 380 | 382,62 | 22 341 | 660,93 | ||||
| 2025-08-19 | 13F | Marex Group plc | 18 840 | 136 | ||||||
| 2025-08-18 | 13F | Tactive Advisors, LLC | 0 | −100,00 | 0 | |||||
| 2025-07-31 | 13F | Caitong International Asset Management Co., Ltd | 1 239 | −94,73 | 9 | −92,52 | ||||
| 2025-08-13 | 13F | Panagora Asset Management Inc | 1 030 652 | 7 441 | ||||||
| 2025-08-08 | 13F | Commonwealth Of Pennsylvania Public School Empls Retrmt Sys | 444 870 | 416 | ||||||
| 2025-07-14 | 13F | UMA Financial Services, Inc. | 108 | 1 | ||||||
| 2025-08-12 | 13F | Jefferies Financial Group Inc. | Call | 25 000 | 180 | |||||
| 2025-08-13 | 13F | Russell Investments Group, Ltd. | 75 921 | 532 | ||||||
| 2025-07-16 | 13F | Essex Financial Services, Inc. | 60 699 | 438 | ||||||
| 2025-08-12 | 13F | Jefferies Financial Group Inc. | Put | 12 500 | 90 | |||||
| 2025-08-14 | 13F | Cantor Fitzgerald, L. P. | 36 000 | 260 | ||||||
| 2025-05-09 | 13F | Wealthspire Advisors, LLC | 0 | −100,00 | 0 | |||||
| 2025-08-14 | 13F | Two Sigma Advisers, Lp | 5 785 300 | −5,01 | 41 770 | 49,74 | ||||
| 2025-08-21 | NP | AFK - VanEck Vectors Africa Index ETF | 36 784 | 18,18 | 266 | 86,62 | ||||
| 2025-05-08 | 13F | Jefferies Financial Group Inc. | 0 | −100,00 | 0 | −100,00 | ||||
| 2025-08-06 | 13F | Commonwealth Equity Services, Llc | 58 317 | −24,57 | 0 | |||||
| 2025-05-14 | 13F | Virtus ETF Advisers LLC | 0 | −100,00 | 0 | |||||
| 2025-07-24 | 13F | Morton Brown Family Wealth, LLC | 35 | 0,00 | 0 | |||||
| 2025-08-07 | 13F | Acadian Asset Management Llc | 2 406 432 | 17 | ||||||
| 2025-08-14 | 13F | Raymond James Financial Inc | 1 036 812 | −37,49 | 7 486 | −1,46 | ||||
| 2025-08-13 | 13F | Cerity Partners LLC | 0 | −100,00 | 0 | |||||
| 2025-08-08 | 13F | SG Americas Securities, LLC | 410 626 | 397,90 | 3 | |||||
| 2025-08-06 | 13F | O'Brien Greene & Co. Inc | 10 000 | 0,00 | 72 | 60,00 | ||||
| 2025-07-31 | 13F | Acuitas Investments, LLC | 3 000 | 22 | ||||||
| 2025-08-14 | 13F | Federation des caisses Desjardins du Quebec | 186 950 | 125,92 | 1 350 | 256,88 | ||||
| 2025-04-14 | 13F | IMC-Chicago, LLC | 0 | −100,00 | 0 | |||||
| 2025-08-01 | 13F | Brookwood Investment Group LLC | 0 | −100,00 | 0 | |||||
| 2025-08-15 | 13F | Kestra Advisory Services, LLC | 0 | −100,00 | 0 | |||||
| 2025-08-01 | 13F | Envestnet Asset Management Inc | 25 704 | 186 | ||||||
| 2025-08-05 | 13F | Bank Of Montreal /can/ | 28 821 | −64,27 | 208 | −43,63 | ||||
| 2025-08-14 | 13F | Massar Capital Management, LP | 100 000 | −67,74 | 722 | −49,12 | ||||
| 2025-05-09 | 13F | GeoWealth Management, LLC | 0 | −100,00 | 0 | |||||
| 2025-08-11 | 13F | Private Advisor Group, LLC | 57 593 | −24,67 | 416 | 18,57 | ||||
| 2025-08-14 | 13F | Jain Global LLC | 0 | −100,00 | 0 | |||||
| 2025-06-26 | NP | DFAE - Dimensional Emerging Core Equity Market ETF | 21 424 | 0,00 | 100 | 22,22 | ||||
| 2025-04-21 | 13F | Nelson, Van Denburg & Campbell Wealth Management Group, LLC | 0 | −100,00 | 0 | |||||
| 2025-05-14 | 13F | OMERS ADMINISTRATION Corp | 0 | −100,00 | 0 | |||||
| 2025-08-13 | 13F/A | StoneX Group Inc. | 0 | −100,00 | 0 | −100,00 | ||||
| 2025-07-25 | 13F | Griffin Asset Management, Inc. | 18 800 | 136 | ||||||
| 2025-08-14 | 13F | Tudor Investment Corp Et Al | 96 740 | 698 | ||||||
| 2025-08-18 | 13F/A | Nomura Holdings Inc | 225 593 | 304,29 | 1 629 | 538,43 | ||||
| 2025-07-15 | 13F | MCF Advisors LLC | 10 | 0,00 | 0 | |||||
| 2025-08-13 | 13F | Quantbot Technologies LP | 24 122 | −95,52 | 174 | −92,95 | ||||
| 2025-08-14 | 13F | Jane Street Group, Llc | Put | 93 800 | 119,67 | 677 | 247,18 | |||
| 2025-08-12 | 13F | Nuveen, LLC | 8 962 747 | 64 711 | ||||||
| 2025-08-14 | 13F | Jane Street Group, Llc | Call | 723 800 | 656,32 | 5 226 | 1 092,92 | |||
| 2025-07-25 | 13F | Stonehage Fleming Financial Services Holdings Ltd | 119 235 | 119,40 | 861 | 246,77 | ||||
| 2025-08-14 | 13F | Jane Street Group, Llc | 1 197 521 | 46,12 | 8 646 | 130,38 | ||||
| 2025-08-08 | 13F | Gts Securities Llc | 76 502 | 552 | ||||||
| 2025-08-13 | 13F | Jump Financial, LLC | 2 672 826 | 100,88 | 19 298 | 216,66 | ||||
| 2025-08-12 | 13F | Proequities, Inc. | 0 | 0 | ||||||
| 2025-08-13 | 13F | Pictet Asset Management Holding SA | 591 334 | 4 269 | ||||||
| 2025-07-24 | 13F | Jfs Wealth Advisors, Llc | 448 | 2,75 | 3 | 200,00 | ||||
| 2025-08-07 | 13F | Sierra Ocean, Llc | 8 325 | 324,96 | 60 | 650,00 | ||||
| 2025-08-11 | 13F | Bell Investment Advisors, Inc | 0 | −100,00 | 0 | |||||
| 2025-08-14 | 13F | Sei Investments Co | 65 072 | 470 | ||||||
| 2025-07-22 | NP | GRHIX - Goehring & Rozencwajg Resources Fund Institutional Class Shares | 1 798 412 | 0,00 | 10 952 | 90,93 | ||||
| 2025-05-05 | 13F | J.w. Cole Advisors, Inc. | 0 | −100,00 | 0 | |||||
| 2025-07-29 | 13F | Regions Financial Corp | 194 000 | 454,29 | 1 401 | 775,00 | ||||
| 2025-07-28 | NP | AVEEX - Avantis Emerging Markets Equity Fund Institutional Class This fund is a listed as child fund of American Century Companies Inc and if that institution has disclosed ownership in this security, then these positions will not be double counted when calculating total shares and total value | 93 908 | 0,00 | 572 | 90,97 | ||||
| 2025-08-01 | 13F | SwitchPoint Financial Planning, LLC | 10 880 | 79 | ||||||
| 2025-06-30 | NP | AIM SECTOR FUNDS (INVESCO SECTOR FUNDS) - Invesco Oppenheimer Gold & Special Minerals Fund Class C | 4 442 587 | 0,00 | 20 658 | 22,05 | ||||
| 2025-08-14 | 13F | Royal Bank Of Canada | 620 332 | 9 583,61 | 4 478 | 15 341,38 | ||||
| 2025-08-28 | NP | QCSTRX - Stock Account Class R1 | 6 148 625 | 44 393 | ||||||
| 2025-08-13 | 13F | Renaissance Technologies Llc | 2 967 604 | 129,35 | 21 426 | 261,56 | ||||
| 2025-06-26 | NP | DFA INVESTMENT DIMENSIONS GROUP INC - World ex U.S. Core Equity Portfolio Institutional Class Shares | 9 956 | 0,00 | 46 | 24,32 | ||||
| 2025-08-13 | 13F | Walleye Trading LLC | Call | 176 100 | 73,67 | 1 271 | 173,92 | |||
| 2025-08-13 | 13F | Walleye Trading LLC | Put | 134 600 | 36,79 | 972 | 115,78 | |||
| 2025-08-12 | 13F | Rhumbline Advisers | 0 | −100,00 | 0 | |||||
| 2025-07-25 | 13F | Yousif Capital Management, Llc | 11 217 | 0,00 | 81 | 56,86 | ||||
| 2025-08-01 | 13F | Y-Intercept (Hong Kong) Ltd | 108 888 | 786 | ||||||
| 2025-07-21 | 13F | Ascent Group, LLC | 10 245 | 74 | ||||||
| 2025-08-12 | 13F | CIBC Private Wealth Group, LLC | 439 | 3 | ||||||
| 2025-04-23 | 13F | Legacy Advisors, LLC | 0 | −100,00 | 0 | |||||
| 2025-08-11 | 13F | Sprott Inc. | 11 533 | 10,60 | 83 | 76,60 | ||||
| 2025-08-12 | 13F | Trexquant Investment LP | 571 969 | 4 130 | ||||||
| 2025-08-14 | 13F | Wells Fargo & Company/mn | 687 758 | 24,54 | 4 966 | 96,32 | ||||
| 2025-06-26 | NP | DFAX - Dimensional World ex U.S. Core Equity 2 ETF | 66 418 | 0,00 | 309 | 21,74 | ||||
| 2025-07-24 | 13F | U S Global Investors Inc | 556 542 | 4 018 | ||||||
| 2025-08-13 | 13F | Baird Financial Group, Inc. | 63 850 | 0,00 | 461 | 57,53 | ||||
| 2025-07-30 | 13F | Privium Fund Management B.V. | 34 040 | 0,00 | 248 | 59,35 | ||||
| 2025-08-11 | 13F | TSP Capital Management Group, LLC | 13 145 | 107,33 | ||||||
| 2025-08-18 | 13F | Hollencrest Capital Management | 44 | 0,00 | 0 | |||||
| 2025-08-12 | 13F | Aigen Investment Management, Lp | 0 | −100,00 | 0 | |||||
| 2025-07-28 | NP | AVXC - Avantis Emerging Markets ex-China Equity ETF | 36 837 | 37,49 | 224 | 163,53 | ||||
| 2025-07-28 | NP | NSI - National Security Emerging Markets Index ETF | 2 546 | 38,67 | 16 | 200,00 | ||||
| 2025-08-14 | 13F | Peak6 Llc | Call | 1 314 200 | 9 489 | |||||
| 2025-08-14 | 13F | Slate Path Capital LP | 1 919 000 | 13 855 | ||||||
| 2025-07-24 | 13F | IFP Advisors, Inc | 963 | 0,52 | 7 | 50,00 | ||||
| 2025-08-27 | NP | RYDEX VARIABLE TRUST - Precious Metals Fund Variable Annuity | 65 885 | −20,79 | 476 | 25,00 | ||||
| 2025-08-06 | 13F | True Wealth Design, LLC | 165 | 11,49 | 1 | |||||
| 2025-08-12 | 13F | Steward Partners Investment Advisory, Llc | 2 021 | −22,89 | 15 | 16,67 | ||||
| 2025-08-13 | 13F | Flow Traders U.s. Llc | 12 483 | 0 | ||||||
| 2025-08-04 | 13F | Assetmark, Inc | 86 | 1 | ||||||
| 2025-08-14 | 13F | Voloridge Investment Management, Llc | 4 922 881 | 514,99 | 35 543 | 869,53 | ||||
| 2025-08-14 | 13F | Citadel Advisors Llc | 1 395 314 | −58,09 | 10 074 | −33,93 | ||||
| 2025-07-11 | 13F | Vanguard Capital Wealth Advisors This fund is a listed as child fund of Vanguard Group Inc and if that institution has disclosed ownership in this security, then these positions will not be double counted when calculating total shares and total value | 87 690 | 633 | ||||||
| 2025-08-05 | 13F | Sigma Planning Corp | 111 411 | −1,40 | 804 | 55,51 | ||||
| 2025-08-14 | 13F | Citadel Advisors Llc | Put | 658 100 | −3,48 | 4 751 | 52,18 | |||
| 2025-08-12 | 13F | MAI Capital Management | 1 331 | 10 | ||||||
| 2025-08-14 | 13F | Citadel Advisors Llc | Call | 156 800 | 72,31 | 1 132 | 172,12 | |||
| 2025-07-31 | 13F | Anthracite Investment Company, Inc. | 25 000 | 180 | ||||||
| 2025-07-31 | 13F/A | Avion Wealth | 500 | 0,00 | 0 | |||||
| 2025-08-08 | 13F/A | Sequoia Financial Advisors, LLC | 0 | −100,00 | 0 | |||||
| 2025-08-21 | NP | GMET - VanEck Green Metals ETF | 42 953 | 4,57 | 310 | 64,89 | ||||
| 2025-05-13 | NP | SA FUNDS INVESTMENT TRUST - SA Emerging Markets Value Fund | 1 610 | 0,00 | 7 | 40,00 | ||||
| 2025-08-27 | NP | TIFF INVESTMENT PROGRAM - TIFF Multi-Asset Fund | Short | −21 083 | −44,32 | −152 | −12,14 | |||
| 2025-08-08 | 13F | Meridian Wealth Management, LLC | 14 470 | 4,21 | 104 | 65,08 | ||||
| 2025-08-12 | 13F | LPL Financial LLC | 496 086 | −2,56 | 3 582 | 53,63 | ||||
| 2025-09-04 | 13F/A | Advisor Group Holdings, Inc. | 28 506 | 46,79 | 206 | 132,95 | ||||
| 2025-08-15 | 13F | Equitable Holdings, Inc. | 10 841 | −45,81 | 78 | −14,29 | ||||
| 2025-04-17 | 13F | FNY Investment Advisers, LLC | 0 | −100,00 | 0 | |||||
| 2025-08-13 | 13F | Quadrature Capital Ltd | 58 744 | 424 | ||||||
| 2025-08-14 | 13F | Goldman Sachs Group Inc | 3 146 339 | −12,02 | 22 717 | 38,69 | ||||
| 2025-08-07 | 13F | Profund Advisors Llc | 59 384 | −2,63 | 429 | 53,41 | ||||
| 2025-08-06 | 13F | Pekin Hardy Strauss, Inc. | 31 000 | −41,32 | 224 | −7,47 | ||||
| 2025-08-12 | 13F | NFP Retirement, Inc. | 16 500 | 0,00 | 119 | 58,67 | ||||
| 2025-08-13 | 13F | HAP Trading, LLC | Put | 100 000 | 28 | |||||
| 2025-08-14 | 13F | Optiver Holding B.V. | 0 | −100,00 | 0 | |||||
| 2025-08-15 | 13F | Tower Research Capital LLC (TRC) | 8 218 | −76,72 | 59 | −63,35 | ||||
| 2025-08-08 | 13F | Creative Planning | 105 339 | −5,55 | 761 | 49,02 | ||||
| 2025-08-13 | 13F/A | Claudia M.p. Batlle, Crp (r) Llc | 25 157 | 182 | ||||||
| 2025-08-11 | 13F | Empowered Funds, LLC | 20 367 | 147 | ||||||
| 2025-08-13 | 13F | Bridgewater Associates, LP | 797 716 | −66,58 | 5 760 | −47,32 | ||||
| 2025-08-13 | 13F | ExodusPoint Capital Management, LP | 251 288 | 2 | ||||||
| 2025-08-14 | 13F | Ameriprise Financial Inc | 15 918 | 22,03 | 115 | 93,22 | ||||
| 2025-08-14 | 13F | Evergreen Capital Management Llc | 107 255 | −19,24 | 774 | 27,30 | ||||
| 2025-05-15 | 13F | Old Mission Capital Llc | 0 | −100,00 | 0 | |||||
| 2025-08-12 | 13F | Goehring & Rozencwajg Associates, LLC | 3 348 841 | 21,79 | 24 179 | 100,76 | ||||
| 2025-08-11 | 13F | HighTower Advisors, LLC | 22 181 | −21,22 | 160 | 25,00 | ||||
| 2025-08-15 | 13F | Concentric Capital Strategies, LP | 105 709 | 763 | ||||||
| 2025-06-26 | NP | DAADX - Emerging Markets ex China Core Equity Portfolio Institutional Class | 108 783 | −30,06 | 506 | −14,70 | ||||
| 2025-08-18 | 13F | Geneos Wealth Management Inc. | 0 | −100,00 | 0 | |||||
| 2025-07-11 | 13F | Mandatum Life Insurance Co Ltd | 82 003 | −1,06 | 592 | 56,20 | ||||
| 2025-08-06 | 13F | Savant Capital, LLC | 56 543 | 179,07 | 408 | 343,48 | ||||
| 2025-08-14 | 13F | Manatuck Hill Partners, LLC | 100 000 | 722 | ||||||
| 2025-07-29 | 13F | Aire Advisors, Llc | 80 000 | 14,19 | 578 | 80,31 | ||||
| 2025-08-13 | 13F | Northwestern Mutual Wealth Management Co | 2 481 | 18 | ||||||
| 2025-05-07 | 13F | Dauntless Investment Group, LLC | 0 | −100,00 | 0 | −100,00 | ||||
| 2025-08-27 | NP | RYPMX - Precious Metals Fund Investor Class | 287 549 | −12,92 | 2 076 | 37,30 | ||||
| 2025-08-07 | 13F | Rathbone Brothers plc | 27 936 | −37,97 | 202 | −2,43 | ||||
| 2025-08-14 | 13F | Fmr Llc | 34 698 | 72,79 | 251 | 174,73 | ||||
| 2025-08-14 | 13F/A | Perritt Capital Management Inc | 1 200 | 9 | ||||||
| 2025-06-26 | NP | DFSE - Dimensional Emerging Markets Sustainability Core 1 ETF | 9 200 | 0,00 | 43 | 20,00 | ||||
| 2025-05-05 | 13F | Eagle Bay Advisors LLC | 0 | −100,00 | 0 | |||||
| 2025-05-15 | 13F | Farringdon Capital, Ltd. | 0 | −100,00 | 0 | |||||
| 2025-08-05 | 13F | NewSquare Capital LLC | 264 | 2 | ||||||
| 2025-08-15 | 13F | CI Private Wealth, LLC | 31 424 | 35,08 | 227 | 113,21 | ||||
| 2025-07-31 | 13F | Nisa Investment Advisors, Llc | 1 000 | 0,00 | 7 | 75,00 | ||||
| 2025-08-14 | 13F | Schonfeld Strategic Advisors LLC | 0 | −100,00 | 0 | |||||
| 2025-08-13 | 13F | EverSource Wealth Advisors, LLC | 11 174 | 493,73 | 81 | 900,00 | ||||
| 2025-06-23 | NP | PMPIX - Precious Metals Ultrasector Profund Investor Class | 57 453 | 28,24 | 267 | 57,06 | ||||
| 2025-08-14 | 13F | Bank Of America Corp /de/ | 993 607 | −62,61 | 7 174 | −41,06 | ||||
| 2025-07-14 | 13F | AdvisorNet Financial, Inc | 128 | 1 | ||||||
| 2025-05-15 | 13F | Mak Capital One Llc | 0 | −100,00 | 0 | |||||
| 2025-06-26 | NP | DFA INVESTMENT DIMENSIONS GROUP INC - Emerging Markets Social Core Equity Portfolio Shares | 0 | −100,00 | 0 | −100,00 | ||||
| 2025-04-28 | 13F | Fedenia Advisers LLC | 0 | −100,00 | 0 | |||||
| 2025-07-16 | 13F | ORG Partners LLC | 1 296 | 85,14 | 9 | 200,00 | ||||
| 2025-08-11 | 13F | United Capital Financial Advisers, Llc | 41 231 | 105,66 | 298 | 226,37 | ||||
| 2025-08-13 | 13F | Jones Financial Companies Lllp | 1 216 | −13,64 | 9 | 33,33 | ||||
| 2025-07-29 | 13F | BXM Wealth LLC | 12 290 | 89 | ||||||
| 2025-08-14 | 13F | Man Group plc | 214 800 | 522,61 | 1 551 | 881,01 | ||||
| 2025-08-07 | 13F | CENTRAL TRUST Co | 20 | 0,00 | 0 | |||||
| 2025-06-26 | NP | DFA INVESTMENT DIMENSIONS GROUP INC - World ex U.S. Targeted Value Portfolio Institutional Class This fund is a listed as child fund of Dimensional Fund Advisors Lp and if that institution has disclosed ownership in this security, then these positions will not be double counted when calculating total shares and total value | 33 192 | 0,00 | 154 | 22,22 | ||||
| 2025-08-04 | 13F | Creative Financial Designs Inc /adv | 4 100 | −54,95 | 30 | −29,27 | ||||
| 2025-08-14 | 13F | Bnp Paribas Arbitrage, Sa | 1 069 657 | 83,88 | 7 723 | 189,86 | ||||
| 2025-08-04 | 13F | Strs Ohio | 74 900 | 0,00 | 541 | 57,43 | ||||
| 2025-05-05 | 13F | Lindbrook Capital, Llc | 377 | −69,91 | 2 | −75,00 | ||||
| 2025-05-15 | 13F | Centiva Capital, LP | 0 | −100,00 | 0 | −100,00 | ||||
| 2025-08-12 | 13F | American Century Companies Inc | 1 996 606 | 31,16 | 14 415 | 106,79 | ||||
| 2025-08-13 | 13F | BCJ Capital Management, LLC | 445 131 | 3 214 | ||||||
| 2025-07-14 | 13F | Sowell Financial Services LLC | 88 545 | −49,87 | 639 | −20,92 | ||||
| 2025-05-02 | 13F | Portman Square Capital LLP | Put | 0 | −100,00 | 0 | −100,00 | |||
| 2025-08-08 | 13F | Cetera Investment Advisers | 151 755 | 8,79 | 1 096 | 71,63 | ||||
| 2025-08-12 | 13F | O'shaughnessy Asset Management, Llc | 28 925 | 123,60 | 209 | 252,54 | ||||
| 2025-08-13 | 13F | Exor Capital LLP | 28 430 409 | 0,94 | 205 268 | 59,12 | ||||
| 2025-05-15 | 13F | Hrt Financial Lp | 0 | −100,00 | 0 | |||||
| 2025-08-05 | 13F | Financial Sense Advisors, Inc. | 50 000 | 361 | ||||||
| 2025-08-14 | 13F | Headlands Technologies LLC | 104 724 | 10 564,36 | 756 | 18 800,00 | ||||
| 2025-08-14 | 13F | Brevan Howard Capital Management LP | 0 | −100,00 | 0 | |||||
| 2025-05-13 | 13F | Wells Fargo & Company/mn | Call | 0 | −100,00 | 0 | −100,00 | |||
| 2025-08-13 | 13F | Guggenheim Capital Llc | 96 233 | −82,05 | 695 | −71,72 | ||||
| 2025-07-30 | 13F | D.a. Davidson & Co. | 205 550 | 1 484 | ||||||
| 2025-08-14 | 13F | Boston Private Wealth Llc | 0 | −100,00 | 0 | −100,00 | ||||
| 2025-08-01 | 13F | Ashton Thomas Private Wealth, LLC | 33 725 | 178,81 | 243 | 341,82 | ||||
| 2025-08-14 | 13F | Millennium Management Llc | Call | 50 000 | 361 | |||||
| 2025-08-14 | 13F | Millennium Management Llc | 3 206 774 | 1,11 | 23 153 | 59,38 | ||||
| 2025-06-26 | NP | DFCEX - Emerging Markets Core Equity Portfolio - Institutional Class This fund is a listed as child fund of Dimensional Fund Advisors Lp and if that institution has disclosed ownership in this security, then these positions will not be double counted when calculating total shares and total value | 948 037 | −4,42 | 4 408 | 16,68 | ||||
| 2025-07-14 | 13F | GAMMA Investing LLC | 4 213 | 112,24 | 30 | 233,33 | ||||
| 2025-07-25 | 13F | JustInvest LLC | 43 686 | 120,57 | 315 | 250,00 | ||||
| 2025-08-13 | 13F | New York State Common Retirement Fund | 159 209 | −51,59 | 1 | 0,00 | ||||
| 2025-08-14 | 13F | Cubist Systematic Strategies, LLC | 1 892 299 | −35,08 | 13 662 | 2,34 | ||||
| 2025-08-14 | 13F | Lazard Asset Management Llc | 2 864 | 0,00 | 0 | |||||
| 2025-05-09 | 13F | CenterBook Partners LP | 0 | −100,00 | 0 | |||||
| 2025-07-25 | 13F | Cwm, Llc | 809 | −38,57 | 0 | |||||
| 2025-08-14 | 13F | Vident Advisory, LLC | 194 643 | −10,64 | 1 405 | 40,92 | ||||
| 2025-05-15 | 13F | DZ BANK AG Deutsche Zentral Genossenschafts Bank, Frankfurt am Main | 0 | −100,00 | 0 | |||||
| 2025-07-31 | 13F | Oppenheimer & Co Inc | 52 391 | 378 | ||||||
| 2025-07-28 | NP | AVES - Avantis Emerging Markets Value ETF This fund is a listed as child fund of American Century Companies Inc and if that institution has disclosed ownership in this security, then these positions will not be double counted when calculating total shares and total value | 137 121 | 28,94 | 835 | 146,31 | ||||
| 2025-07-30 | NP | APIE - ActivePassive International Equity ETF | 79 872 | 486 | ||||||
| 2025-07-18 | 13F/A | MJT & Associates Financial Advisory Group, Inc. | 350 | 0,00 | 3 | 100,00 | ||||
| 2025-08-12 | 13F | Atlas Capital Advisors Llc | 4 736 | 34 | ||||||
| 2025-08-04 | 13F | Hantz Financial Services, Inc. | 0 | −100,00 | 0 | |||||
| 2025-08-14 | 13F | CIBC World Markets Inc. | 37 889 | −24,70 | 274 | 18,70 | ||||
| 2025-08-14 | 13F | Wexford Capital Lp | 100 000 | 722 | ||||||
| 2025-08-14 | 13F | Engineers Gate Manager LP | 67 642 | 488 | ||||||
| 2025-07-17 | 13F | Janney Montgomery Scott LLC | 51 756 | −17,78 | 0 | |||||
| 2025-05-14 | 13F | Truvestments Capital Llc | 0 | −100,00 | 0 | |||||
| 2025-08-14 | 13F | Glenorchy Capital Ltd | Call | 100 | 0,00 | 1 | ||||
| 2025-08-14 | 13F | Glenorchy Capital Ltd | 414 405 | −1,19 | 2 992 | 55,83 | ||||
| 2025-08-08 | 13F | Mitsubishi UFJ Trust & Banking Corp | 6 525 | 47 | ||||||
| 2025-08-12 | 13F | Pathstone Holdings, LLC | 197 891 | 53,45 | 1 429 | 142,03 | ||||
| 2025-08-14 | 13F | D. E. Shaw & Co., Inc. | 9 441 190 | −20,01 | 68 165 | 26,10 | ||||
| 2025-08-14 | 13F | D. E. Shaw & Co., Inc. | Call | 212 800 | 1 536 | |||||
| 2025-06-26 | NP | Dimensional Emerging Markets Value Fund - Dimensional Emerging Markets Value Fund This fund is a listed as child fund of Dimensional Fund Advisors Lp and if that institution has disclosed ownership in this security, then these positions will not be double counted when calculating total shares and total value | 954 293 | 0,00 | 4 437 | 22,06 | ||||
| 2025-08-14 | 13F | Atomi Financial Group, Inc. | 16 377 | 118 | ||||||
| 2025-07-17 | 13F | Oakworth Capital, Inc. | 250 | −50,00 | 2 | −50,00 | ||||
| 2025-08-06 | 13F | Moors & Cabot, Inc. | 13 600 | −6,85 | 98 | 48,48 | ||||
| 2025-07-11 | 13F | Assenagon Asset Management S.A. | 127 322 | 919 | ||||||
| 2025-07-31 | 13F | Brinker Capital Investments, LLC | 0 | −100,00 | 0 | −100,00 | ||||
| 2025-07-28 | 13F | Moran Wealth Management, LLC | 150 179 | 1 084 | ||||||
| 2025-08-14 | 13F | Papamarkou Wellner Asset Management inc. | 57 719 | 0,00 | 417 | 57,58 | ||||
| 2025-07-24 | 13F | Us Bancorp \de\ | 148 | 0,00 | 1 | |||||
| 2025-07-28 | 13F | BRYN MAWR TRUST Co | 500 | 0,00 | 4 | 50,00 | ||||
| 2025-07-24 | 13F | Total Wealth Planning & Management, Inc. | 23 601 | 27,44 | 170 | 102,38 | ||||
| 2025-08-14 | 13F | Aquatic Capital Management LLC | 506 288 | 84,13 | 3 655 | 190,31 | ||||
| 2025-08-11 | 13F | Cladis Investment Advisory, LLC | 10 000 | 0,00 | 72 | 60,00 | ||||
| 2025-07-16 | 13F | Signaturefd, Llc | 5 396 | −32,87 | 39 | 5,56 | ||||
| 2025-08-12 | 13F | Cadence Wealth Management LLC | 114 744 | 7,05 | 828 | 68,98 | ||||
| 2025-08-13 | 13F | Walleye Capital LLC | Call | 117 700 | 162,14 | 850 | 314,15 | |||
| 2025-08-18 | 13F | Wolverine Trading, Llc | 46 367 | −46,45 | 325 | −14,25 | ||||
| 2025-08-08 | 13F | Larson Financial Group LLC | 293 | 2 | ||||||
| 2025-08-20 | NP | QSPIX - AQR Style Premia Alternative Fund Class I | 0 | −100,00 | 0 | −100,00 | ||||
| 2025-04-28 | NP | CRIT - Optica Rare Earths & Critical Materials ETF | 10 541 | −1,72 | 34 | −23,26 | ||||
| 2025-06-26 | NP | TEMRX - TIAA-CREF Emerging Markets Equity Fund Retail Class | 2 222 532 | 10 335 | ||||||
| 2025-07-30 | 13F | Ethic Inc. | 14 140 | −31,92 | 99 | 6,45 | ||||
| 2025-08-07 | 13F | Allworth Financial LP | 2 096 | 42,59 | 15 | 150,00 | ||||
| 2025-07-24 | 13F | Financial Connections Group, Inc. | 500 | −9,09 | 0 | |||||
| 2025-08-13 | 13F | Walleye Capital LLC | 4 081 | −99,83 | 29 | −99,73 | ||||
| 2025-08-18 | 13F | Wolverine Trading, Llc | Call | 229 400 | 134,08 | 1 608 | 274,83 | |||
| 2025-08-13 | 13F | Quadrant Capital Group Llc | 0 | −100,00 | 0 | |||||
| 2025-08-13 | 13F | Walleye Capital LLC | Put | 259 600 | 72,95 | 1 874 | 172,78 | |||
| 2025-08-18 | 13F | Wolverine Trading, Llc | Put | 151 100 | 67,70 | 1 059 | 168,78 | |||
| 2025-07-29 | 13F | Stratos Wealth Partners, LTD. | 19 818 | 5,31 | 143 | 66,28 | ||||
| 2025-08-12 | 13F | XTX Topco Ltd | 29 977 | −93,86 | 216 | −90,34 | ||||
| 2025-08-07 | 13F | DJE Kapital AG | 364 800 | 2 645 | ||||||
| 2025-08-12 | 13F | Jpmorgan Chase & Co | 6 405 288 | 32 992,00 | 46 246 | 52 452,27 | ||||
| 2025-05-21 | 13F | Bluefin Capital Management, Llc | 0 | −100,00 | 0 | |||||
| 2025-08-11 | 13F | Fore Capital, LLC | 0 | −100,00 | 0 | |||||
| 2025-07-28 | NP | AVEM - Avantis Emerging Markets Equity ETF This fund is a listed as child fund of American Century Companies Inc and if that institution has disclosed ownership in this security, then these positions will not be double counted when calculating total shares and total value | 1 491 875 | 23,45 | 9 086 | 135,67 |