Grundläggande statistik
| Institutionella ägare | 261 total, 261 long only, 0 short only, 0 long/short - change of 5,24% MRQ |
| Genomsnittlig portföljallokering | 0.2531 % - change of −8,90% MRQ |
| Institutionella aktier (lång) | 49 856 174 (ex 13D/G) - change of 2,00MM shares 4,18% MRQ |
| Institutionellt värde (lång) | $ 1 123 183 USD ($1000) |
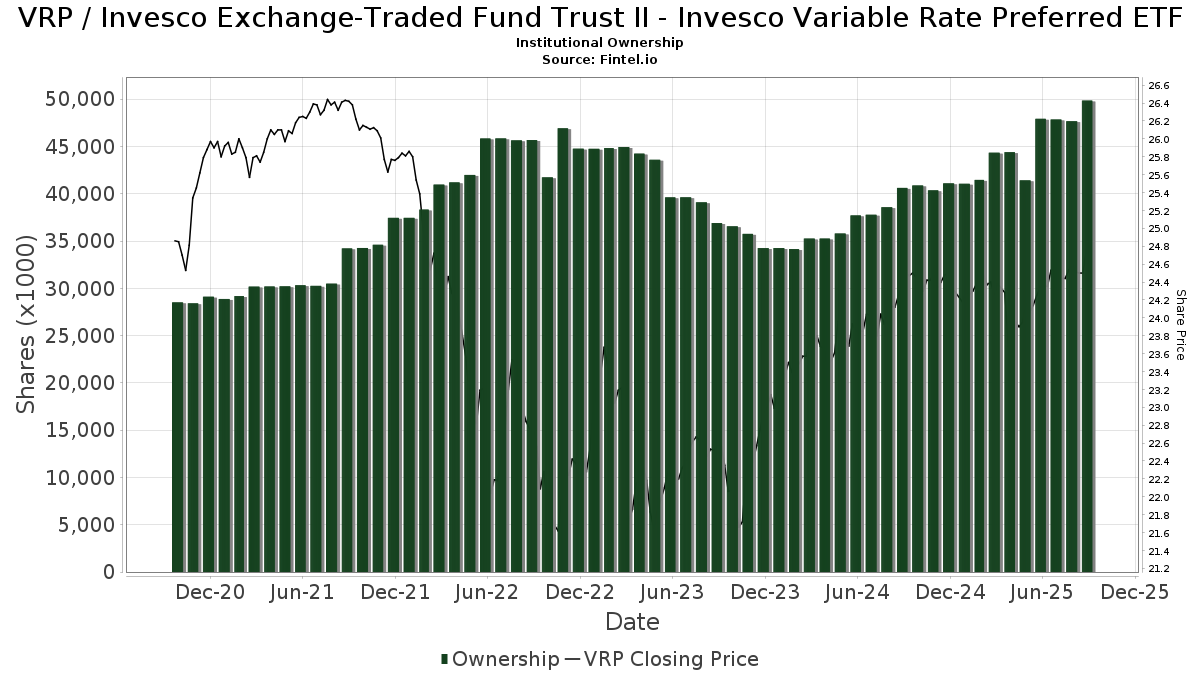
Institutionellt ägande och aktieägare
Invesco Exchange-Traded Fund Trust II - Invesco Variable Rate Preferred ETF (US:VRP) har 261 Institutionella ägare och aktieägare som har lämnat in 13D/G- eller 13F-formulär till Securities Exchange Commission (SEC). Dessa institut innehar totalt 49,856,174 aktier. Största aktieägare inkluderar Bank Of America Corp /de/, Morgan Stanley, Wells Fargo & Company/mn, UBS Group AG, LPL Financial LLC, Proficio Capital Partners LLC, Envestnet Asset Management Inc, Stephens Inc /ar/, Advisors Capital Management, LLC, and Jpmorgan Chase & Co .
Invesco Exchange-Traded Fund Trust II - Invesco Variable Rate Preferred ETF (ARCA:VRP) Institutionell ägarstruktur visar institutioners och fonders nuvarande positioner i företaget, samt de senaste förändringarna i positionernas storlek. Större aktieägare kan vara enskilda investerare, fonder, hedgefonder eller institutioner. Bilaga 13D visar att investeraren äger (eller ägde) mer än 5% av företaget och avser (eller avsåg) att aktivt eftersträva en förändring av affärsstrategin. Schedule 13G indikerar en passiv investering på över 5%.
The share price as of September 12, 2025 is 24,76 / share. Previously, on September 13, 2024, the share price was 24,40 / share. This represents an increase of 1,48% over that period.
Fondsentimentets poäng
Fondsentimentet poängen(fka Ägarackumulation-poäng) visar vilka aktier som är mest köpta av fonder. Det är resultatet av en sofistikerad kvantitativ flerfaktormodell som identifierar företag med de högsta nivåerna av institutionell ackumulering. Poängsättningsmodellen använder en kombination av den totala ökningen av redovisade ägare, förändringarna i portföljallokeringarna för dessa ägare och andra mått. Siffran sträcker sig från 0 till 100, där högre siffror indikerar en högre nivå av ackumulering i förhållande till sina konkurrenter, och 50 är genomsnittet.
Uppdateringsfrekvens: Dagligen
Se Ownership Explorer, som innehåller en lista över de högst rankade företagen.
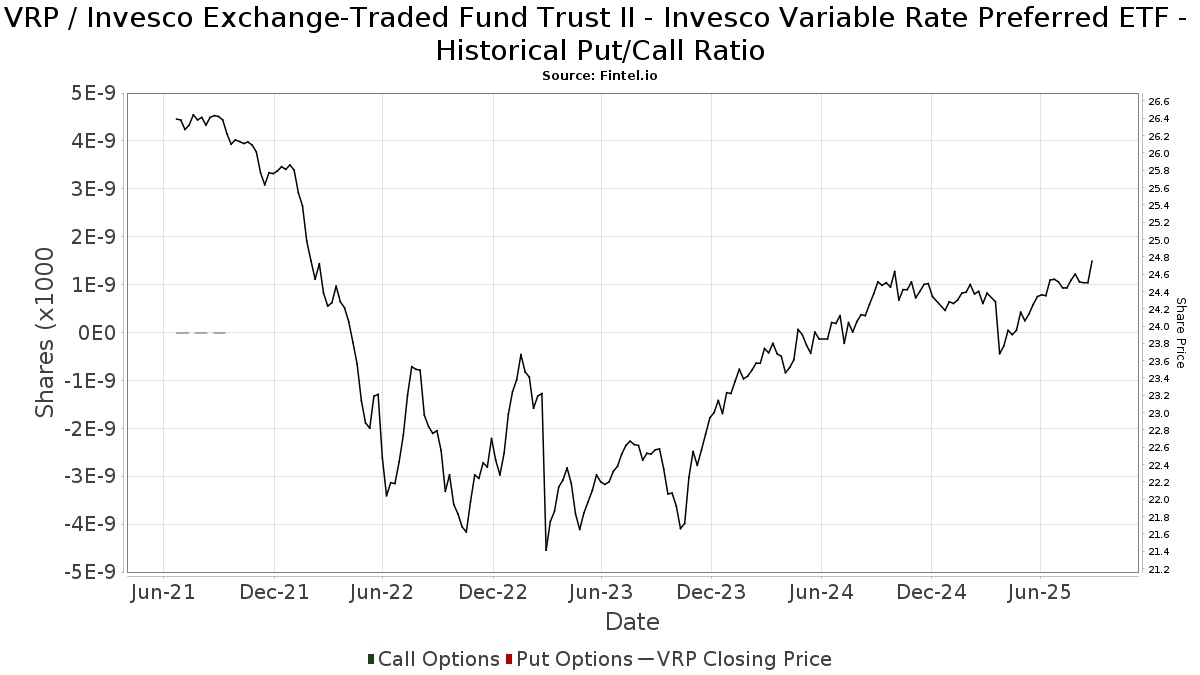
Institutionell sälj/köp-kvot
Förutom att rapportera vanliga eget kapital- och skuldemissioner måste institutioner med mer än 100MM tillgångar under förvaltning också avslöja sina innehav av sälj- och köpoptioner. Eftersom säljoptioner i allmänhet indikerar ett negativt sentiment och köpoptioner indikerar ett positivt sentiment, kan vi få en uppfattning om det övergripande institutionella sentimentet genom att plotta förhållandet mellan säljoptioner och köpoptioner. Diagrammet till höger visar det historiska förhållandet mellan sälj- och köpoptioner för detta instrument.
Genom att använda sälj/köp-kvoten som en indikator på aktieägarnas sentiment undviker man en av de största bristerna med att använda det totala institutionella ägandet, nämligen att en betydande del av de förvaltade tillgångarna investeras passivt för att följa index. Passivt förvaltade fonder köper vanligtvis inte optioner, så indikatorn för sälj/köp-kvoten ger en bättre bild av stämningen i aktivt förvaltade fonder.
13F- och NPORT-arkiveringar
Detaljer om 13F-arkiveringar är gratis. Detaljer om NP-arkiveringar kräver ett premiummedlemskap. Gröna rader indikerar nya positioner. Röda rader indikerar stängda positioner. Klicka på länk symbolen för att se hela transaktionshistoriken.
Uppgradera
för att låsa upp premiumdata och exportera till Excel ![]() .
.
| Fil Datum | Källa | Investerare | Typ | Genomsnittligt pris (beräknat) |
Aktier | Δ Aktier (%) |
Rapporterat värde (1000 USD) |
Δ Värde (%) |
Portföljallokering (%) |
|
|---|---|---|---|---|---|---|---|---|---|---|
| 2025-07-28 | 13F | Harbour Investments, Inc. | 4 828 | 7,53 | 118 | 9,26 | ||||
| 2025-08-14 | 13F | Wiley Bros.-aintree Capital, Llc | 10 570 | 258 | ||||||
| 2025-07-24 | 13F | Eastern Bank | 25 | 0,00 | 1 | |||||
| 2025-08-11 | 13F | Westover Capital Advisors, LLC | 345 102 | 8 438 | ||||||
| 2025-05-14 | 13F | Susquehanna International Group, Llp | 0 | −100,00 | 0 | |||||
| 2025-07-28 | 13F | Courier Capital Llc | 25 954 | 0,55 | 635 | 1,44 | ||||
| 2025-07-30 | 13F | First Citizens Bank & Trust Co | 39 652 | 969 | ||||||
| 2025-06-03 | 13F | Invst, LLC | 20 238 | −3,76 | 491 | −3,54 | ||||
| 2025-07-21 | 13F | Synergy Financial Management, LLC | 20 995 | 48,54 | 513 | 50,00 | ||||
| 2025-08-14 | 13F | Gotham Asset Management, LLC | 47 270 | 86,13 | 1 156 | 87,80 | ||||
| 2025-07-17 | 13F | Coastline Trust Co | 4 870 | 0,00 | 119 | 0,85 | ||||
| 2025-07-25 | 13F | Cwm, Llc | 81 349 | 37,08 | 2 | 0,00 | ||||
| 2025-04-25 | 13F | Smallwood Wealth Investment Management, LLC | 1 435 | 35 | ||||||
| 2025-07-21 | 13F | Ameritas Advisory Services, LLC | 55 109 | −16,10 | 1 347 | −15,39 | ||||
| 2025-08-12 | 13F | Fca Corp /tx | 189 326 | 4,52 | 4 629 | 5,44 | ||||
| 2025-08-12 | 13F | Franklin Resources Inc | 169 066 | 57 016,89 | 4 134 | 58 942,86 | ||||
| 2025-08-14 | 13F | Ausdal Financial Partners, Inc. | 48 853 | −14,59 | 1 194 | −13,85 | ||||
| 2025-07-14 | 13F | Seed Wealth Management, Inc. | 103 610 | 0,00 | 2 533 | 0,88 | ||||
| 2025-07-25 | 13F | Community Bank, N.A. | 1 000 | 24 | ||||||
| 2025-08-07 | 13F | Kestra Private Wealth Services, Llc | 65 730 | −4,73 | 1 607 | −3,89 | ||||
| 2025-08-18 | 13F | Finward Bancorp | 10 585 | −4,51 | 259 | −3,73 | ||||
| 2025-08-08 | 13F | Emerald Investment Partners, Llc | 20 421 | −1,57 | 499 | −0,60 | ||||
| 2025-08-12 | 13F | Stelac Advisory Services LLC | 55 932 | 0,00 | 1 367 | 0,89 | ||||
| 2025-08-06 | 13F | New Millennium Group LLC | 124 305 | 2,63 | 3 039 | 3,54 | ||||
| 2025-08-14 | 13F | Warren Averett Asset Management, LLC | 72 060 | −4,45 | 1 762 | −3,67 | ||||
| 2025-07-09 | 13F | Dynamic Advisor Solutions LLC | 16 748 | 0,88 | 409 | 1,74 | ||||
| 2025-08-12 | 13F | Global Retirement Partners, LLC | 44 282 | 10,75 | 1 083 | 11,89 | ||||
| 2025-08-08 | 13F | Cetera Investment Advisers | 152 778 | −2,48 | 3 735 | −1,63 | ||||
| 2025-08-15 | 13F | Morgan Stanley | 7 984 519 | −6,31 | 195 222 | −5,50 | ||||
| 2025-07-22 | 13F | Partners Wealth Management, Llc | 8 776 | 0,00 | 213 | 0,00 | ||||
| 2025-07-24 | 13F | Blair William & Co/il | 6 485 | 0,00 | 159 | 0,64 | ||||
| 2025-07-17 | 13F | Janney Montgomery Scott LLC | 315 760 | 5,20 | 8 | 0,00 | ||||
| 2025-08-11 | 13F | HighTower Advisors, LLC | 1 043 609 | 2,22 | 25 516 | 3,11 | ||||
| 2025-08-15 | 13F | CI Private Wealth, LLC | 36 992 | 1,43 | 904 | 2,26 | ||||
| 2025-07-14 | 13F | McMahon Financial Advisors, LLC | 22 241 | −6,24 | 544 | −5,40 | ||||
| 2025-08-15 | 13F | Kestra Advisory Services, LLC | 111 400 | 157,00 | 2 724 | 159,33 | ||||
| 2025-08-08 | 13F | Advisors Capital Management, LLC | 1 208 994 | 8,76 | 29 560 | 9,70 | ||||
| 2025-07-21 | 13F | Ntv Asset Management Llc | 100 915 | 23,19 | 2 467 | 24,28 | ||||
| 2025-07-17 | 13F | HB Wealth Management, LLC | 20 474 | 0,56 | 501 | 1,42 | ||||
| 2025-07-31 | 13F | Pacitti Group Inc. | 81 735 | 7,36 | 1 998 | 8,29 | ||||
| 2025-07-24 | 13F | Etesian Wealth Advisors, Inc. | 11 351 | −0,10 | 278 | 0,73 | ||||
| 2025-05-14 | 13F | Van Hulzen Asset Management, LLC | 0 | −100,00 | 0 | −100,00 | ||||
| 2025-07-11 | 13F | SILVER OAK SECURITIES, Inc | 23 410 | −4,29 | 572 | −3,54 | ||||
| 2025-08-04 | 13F | Keybank National Association/oh | 9 837 | 241 | ||||||
| 2025-08-12 | 13F | Jpmorgan Chase & Co | 1 176 181 | 30,18 | 28 758 | 31,30 | ||||
| 2025-08-19 | 13F | Advisory Services Network, LLC | 33 324 | 1,66 | 815 | 2,64 | ||||
| 2025-07-08 | 13F | Everpar Advisors Llc | 10 551 | 0,00 | 258 | 0,78 | ||||
| 2025-07-24 | 13F | Aurora Private Wealth, Inc. | 0 | −100,00 | 0 | |||||
| 2025-08-01 | 13F | Rossby Financial, LCC | 966 | 0,00 | 24 | 0,00 | ||||
| 2025-08-14 | 13F/A | Rockefeller Capital Management L.P. | 156 879 | 2,51 | 3 836 | 3,40 | ||||
| 2025-08-14 | 13F | Comerica Bank | 54 717 | −4,01 | 1 338 | −3,19 | ||||
| 2025-08-08 | 13F | Advisory Resource Group | 73 128 | 4,21 | 1 788 | 5,12 | ||||
| 2025-07-22 | 13F | Old National Bancorp /in/ | 30 542 | −7,71 | 747 | −6,98 | ||||
| 2025-07-25 | 13F | Atria Wealth Solutions, Inc. | 30 406 | 1,79 | 745 | 2,76 | ||||
| 2025-08-06 | 13F | First Horizon Advisors, Inc. | 16 265 | −1,08 | 398 | −0,25 | ||||
| 2025-07-18 | 13F | PFG Investments, LLC | 21 925 | −4,94 | 536 | −4,11 | ||||
| 2025-08-08 | 13F | Evolution Wealth Advisors, LLC | 447 797 | −0,69 | 10 949 | 0,16 | ||||
| 2025-08-01 | 13F | Advisory Alpha, LLC | 185 769 | −36,39 | 4 542 | −35,66 | ||||
| 2025-08-15 | 13F | Alaethes Wealth LLC | 13 402 | 0,00 | 328 | 0,93 | ||||
| 2025-08-14 | 13F | Bnp Paribas Arbitrage, Sa | 0 | −100,00 | 0 | |||||
| 2025-07-15 | 13F | StoneCrest Wealth Management, Inc. | 76 574 | 1 872 | ||||||
| 2025-07-17 | 13F | Investment Research & Advisory Group, Inc. | 9 028 | 0,45 | 221 | 1,38 | ||||
| 2025-08-13 | 13F | Colonial Trust Co / SC | 879 | 0,00 | 21 | 0,00 | ||||
| 2025-08-13 | 13F | Vermillion & White Wealth Management Group, LLC | 997 | 0,00 | 24 | 0,00 | ||||
| 2025-07-17 | 13F | Northwest Wealth Management, Llc | 31 174 | −43,22 | 762 | −42,71 | ||||
| 2025-07-18 | 13F | Cooper Financial Group | 16 489 | −6,01 | 403 | −5,18 | ||||
| 2025-08-08 | 13F | Thoroughbred Financial Services, Llc | 11 533 | 0,00 | 0 | |||||
| 2025-07-11 | 13F | Matthew Goff Investment Advisor, LLC | 433 695 | −32,52 | 10 604 | −31,94 | ||||
| 2025-07-11 | 13F | Farther Finance Advisors, LLC | 14 486 | −5,98 | 354 | −5,09 | ||||
| 2025-04-23 | 13F | International Assets Investment Management, Llc | 0 | −100,00 | 0 | −100,00 | ||||
| 2025-08-08 | 13F | Pnc Financial Services Group, Inc. | 1 367 | 0,00 | 33 | 0,00 | ||||
| 2025-08-08 | 13F | Spectrum Asset Management, Inc. | 342 707 | 336,84 | 8 379 | 340,77 | ||||
| 2025-07-10 | 13F | High Net Worth Advisory Group LLC | 10 800 | 0,00 | 264 | 1,15 | ||||
| 2025-05-15 | 13F | Citadel Advisors Llc | 0 | −100,00 | 0 | |||||
| 2025-07-17 | 13F | Patton Albertson Miller Group, Llc | 10 941 | −4,33 | 268 | −3,61 | ||||
| 2025-08-11 | 13F | Citigroup Inc | 175 937 | 1,95 | 4 302 | 2,85 | ||||
| 2025-07-14 | 13F | Westend Capital Management LLC | 4 430 | 0,00 | 108 | 0,93 | ||||
| 2025-08-06 | 13F | Pekin Hardy Strauss, Inc. | 31 935 | 0,00 | 781 | 0,78 | ||||
| 2025-08-12 | 13F | Insigneo Advisory Services, Llc | 14 457 | −25,90 | 353 | −25,21 | ||||
| 2025-08-14 | 13F | Aft, Forsyth & Company, Inc. | 14 362 | −20,93 | 351 | −20,23 | ||||
| 2025-07-14 | 13F | Clear Harbor Asset Management, LLC | 33 535 | −5,63 | 820 | −4,88 | ||||
| 2025-07-24 | 13F | IFP Advisors, Inc | 64 938 | 3,77 | 1 588 | 4,68 | ||||
| 2025-08-11 | 13F | Beta Wealth Group, Inc. | 93 078 | 6,47 | 2 276 | 7,36 | ||||
| 2025-08-12 | 13F | CIBC Private Wealth Group, LLC | 9 370 | 0,00 | 229 | 5,05 | ||||
| 2025-08-13 | 13F | Boston Family Office Llc | 243 581 | 4,41 | 6 | 0,00 | ||||
| 2025-08-14 | 13F | Diversify Wealth Management, Llc | 27 411 | 54,45 | 673 | 58,35 | ||||
| 2025-08-11 | 13F | Principal Securities, Inc. | 179 153 | 4,19 | 4 380 | 5,31 | ||||
| 2025-05-15 | 13F | First Manhattan Co | 0 | −100,00 | 0 | |||||
| 2025-08-13 | 13F | Jones Financial Companies Lllp | 44 156 | 37,44 | 1 077 | 38,13 | ||||
| 2025-08-06 | 13F | Hallmark Capital Management Inc | 14 612 | −2,48 | 357 | −1,65 | ||||
| 2025-08-07 | 13F | Midwest Trust Co | 45 782 | 1 119 | ||||||
| 2025-08-14 | 13F | Wells Fargo & Company/mn | 3 083 255 | 21,31 | 75 386 | 22,36 | ||||
| 2025-08-04 | 13F | Kovack Advisors, Inc. | 12 103 | −4,09 | 296 | −3,28 | ||||
| 2025-07-08 | 13F | Nbc Securities, Inc. | 1 715 | 0 | ||||||
| 2025-07-29 | 13F | Woodard & Co Asset Management Group Inc /adv | 302 | 0,00 | 7 | 0,00 | ||||
| 2025-07-16 | 13F | Brown, Lisle/cummings, Inc. | 49 218 | −1,17 | 1 203 | −0,33 | ||||
| 2025-08-14 | 13F | Pine Harbor Wealth Management, LLC | 17 749 | −6,10 | 434 | −5,46 | ||||
| 2025-07-29 | 13F | Stephens Inc /ar/ | 1 384 622 | 0,47 | 33 854 | 1,35 | ||||
| 2025-08-04 | 13F | AlphaStar Capital Management, LLC | 20 035 | −90,76 | 490 | −90,69 | ||||
| 2025-07-17 | 13F | Delta Capital Management Llc | 37 405 | 0,00 | 1 | |||||
| 2025-04-24 | 13F | Wright Fund Managment, LLC | 0 | −100,00 | 0 | |||||
| 2025-08-07 | 13F | CENTRAL TRUST Co | 14 | 0 | ||||||
| 2025-08-07 | 13F | LFA - Lugano Financial Advisors SA | 2 140 | 0,00 | 52 | 1,96 | ||||
| 2025-08-14 | 13F/A | Skopos Labs, Inc. | 127 | 3 | ||||||
| 2025-08-11 | 13F | Estate Counselors, LLC | 0 | −100,00 | 0 | |||||
| 2025-08-11 | 13F | Elequin Capital Lp | 25 952 | 635 | ||||||
| 2025-08-27 | 13F/A | Brinker Capital Investments, LLC | 90 273 | 1,29 | 2 207 | 2,18 | ||||
| 2025-07-08 | 13F | Atwood & Palmer Inc | 1 895 | −43,77 | 46 | −43,21 | ||||
| 2025-08-11 | 13F | Private Advisor Group, LLC | 158 839 | 2,38 | 3 884 | 3,27 | ||||
| 2025-04-29 | 13F | Hm Payson & Co | 1 388 | 0,00 | 34 | 0,00 | ||||
| 2025-08-12 | 13F | Calton & Associates, Inc. | 11 546 | 282 | ||||||
| 2025-08-14 | 13F | AllSquare Wealth Management LLC | 15 700 | 0,00 | 384 | 0,79 | ||||
| 2025-08-18 | 13F/A | National Bank Of Canada /fi/ | 2 662 | 0,00 | 65 | 1,56 | ||||
| 2025-08-14 | 13F | McIlrath & Eck, LLC | 800 | 0,00 | 20 | 0,00 | ||||
| 2025-07-15 | 13F | Unified Investment Management | 15 504 | 0,30 | 379 | 1,34 | ||||
| 2025-08-13 | 13F | Baird Financial Group, Inc. | 242 998 | −35,32 | 5 941 | −34,76 | ||||
| 2025-08-08 | NP | QALTX - Quantified Alternative Investment Fund Investor Class Shares | 1 666 | −92,97 | 41 | −93,03 | ||||
| 2025-08-06 | 13F | Wedbush Securities Inc | 72 698 | −6,81 | 2 | 0,00 | ||||
| 2025-07-17 | 13F | Raleigh Capital Management Inc. | 0 | −100,00 | 0 | |||||
| 2025-08-27 | NP | ACTIX - Advisors Capital Tactical Fixed Income Fund | 625 900 | 16,90 | 15 303 | 17,91 | ||||
| 2025-08-14 | 13F | Jane Street Group, Llc | 0 | −100,00 | 0 | |||||
| 2025-07-17 | 13F | SeaBridge Investment Advisors LLC | 259 445 | 19,99 | 6 343 | 21,03 | ||||
| 2025-08-11 | 13F | Brown Brothers Harriman & Co | 6 038 | 0,00 | 148 | 0,68 | ||||
| 2025-08-15 | 13F | Prevail Innovative Wealth Advisors, Llc | 47 308 | 29,24 | 1 157 | 30,33 | ||||
| 2025-08-08 | 13F | Ironwood Investment Counsel, LLC | 14 733 | −13,59 | 360 | −12,83 | ||||
| 2025-08-14 | 13F | UBS Group AG | 2 235 509 | −5,15 | 54 658 | −4,33 | ||||
| 2025-07-29 | 13F | Private Trust Co Na | 941 | 12,97 | 23 | 15,00 | ||||
| 2025-07-29 | 13F | Koshinski Asset Management, Inc. | 9 441 | 0,00 | 231 | 0,88 | ||||
| 2025-08-15 | 13F | Equitable Holdings, Inc. | 13 371 | −21,55 | 327 | −21,07 | ||||
| 2025-07-16 | 13F | Northern Oak Wealth Management Inc | 18 625 | 0,10 | 455 | 0,89 | ||||
| 2025-07-21 | 13F | Pflug Koory, LLC | 2 267 | 1,34 | 55 | 1,85 | ||||
| 2025-08-08 | 13F | Avantax Advisory Services, Inc. | 24 216 | −2,20 | 592 | −1,33 | ||||
| 2025-07-11 | 13F | Windsor Capital Management, LLC | 333 082 | −0,31 | 8 144 | 0,56 | ||||
| 2025-07-16 | 13F | ORG Partners LLC | 5 900 | 0,00 | 144 | 0,70 | ||||
| 2025-08-04 | 13F | Assetmark, Inc | 91 | 0,00 | 2 | 0,00 | ||||
| 2025-07-11 | 13F | Diversified Trust Co | 15 372 | 376 | ||||||
| 2025-08-11 | 13F | Addison Capital Co | 95 587 | 5,51 | 2 337 | 6,42 | ||||
| 2025-08-14 | 13F | Mercer Global Advisors Inc /adv | 10 438 | −51,67 | 255 | −51,24 | ||||
| 2025-07-22 | 13F | Diligent Investors, LLC | 52 622 | 0,19 | 1 287 | 1,02 | ||||
| 2025-05-06 | 13F | Boyd Watterson Asset Management Llc/oh | 0 | −100,00 | 0 | |||||
| 2025-05-28 | 13F | Wealth Management Associates, Inc. | 0 | −100,00 | 0 | −100,00 | ||||
| 2025-08-11 | 13F | Nordwand Advisors, LLC | 1 600 | 39 | ||||||
| 2025-08-14 | 13F | Qube Research & Technologies Ltd | 14 721 | 33,62 | 360 | 34,46 | ||||
| 2025-05-15 | 13F/A | Orion Portfolio Solutions, LLC | 89 125 | −16,33 | 2 160 | −16,15 | ||||
| 2025-07-25 | 13F | Hazlett, Burt & Watson, Inc. | 1 926 | −35,09 | 0 | |||||
| 2025-07-28 | 13F | Elmwood Wealth Management, Inc. | 141 824 | −4,30 | 3 468 | −3,48 | ||||
| 2025-08-06 | 13F | Commonwealth Equity Services, Llc | 233 194 | −8,56 | 6 | −16,67 | ||||
| 2025-08-12 | 13F | BlackRock, Inc. | 476 | 0,00 | 12 | 0,00 | ||||
| 2025-08-25 | 13F/A | Neuberger Berman Group LLC | 13 346 | 29,13 | 326 | 30,40 | ||||
| 2025-08-11 | 13F | Rothschild Investment Llc | 150 | 0,00 | 4 | 0,00 | ||||
| 2025-05-20 | 13F/A | Colony Group, LLC | 0 | −100,00 | 0 | −100,00 | ||||
| 2025-07-22 | 13F | Wealthcare Advisory Partners LLC | 203 814 | 2 329,25 | 4 983 | 2 354,68 | ||||
| 2025-07-29 | 13F | Cottonwood Capital Advisors, Llc | 137 175 | −0,61 | 3 354 | 0,24 | ||||
| 2025-08-06 | 13F | Texas Yale Capital Corp. | 12 623 | 32,59 | 309 | 33,91 | ||||
| 2025-08-08 | 13F | King Wealth | 39 833 | −6,35 | 1 | −100,00 | ||||
| 2025-08-14 | 13F | Dearborn Partners Llc | 68 988 | −15,69 | 1 687 | −14,98 | ||||
| 2025-08-01 | 13F | Chilton Capital Management Llc | 9 874 | −2,09 | 241 | −1,23 | ||||
| 2025-08-08 | 13F | Capital Investment Advisory Services, LLC | 47 490 | 4,42 | 1 161 | 5,35 | ||||
| 2025-07-22 | 13F | Accel Wealth Management | 21 617 | 129,04 | 529 | 131,58 | ||||
| 2025-08-05 | 13F | Cherry Tree Wealth Management, LLC | 89 983 | −0,50 | 2 200 | 0,36 | ||||
| 2025-08-14 | 13F | Mml Investors Services, Llc | 341 574 | −2,83 | 8 | 0,00 | ||||
| 2025-08-07 | 13F | Proficio Capital Partners LLC | 1 935 255 | 22 363,78 | 1 946 | 835,58 | ||||
| 2025-08-14 | 13F | Raymond James Financial Inc | 580 324 | 26,41 | 14 189 | 27,50 | ||||
| 2025-07-17 | 13F | Sound Income Strategies, LLC | 0 | −100,00 | 0 | |||||
| 2025-08-14 | 13F | Redwood Financial Network Corp | 10 020 | −18,11 | 245 | −17,57 | ||||
| 2025-04-15 | 13F | Zhang Financial LLC | 0 | −100,00 | 0 | −100,00 | ||||
| 2025-08-12 | 13F | Proequities, Inc. | 0 | 0 | ||||||
| 2025-07-14 | 13F | AdvisorNet Financial, Inc | 221 | 5 | ||||||
| 2025-07-18 | 13F | Truist Financial Corp | 10 043 | −28,52 | 246 | −27,94 | ||||
| 2025-08-12 | 13F | AlphaCore Capital LLC | 32 202 | 0,00 | 787 | 0,90 | ||||
| 2025-07-08 | 13F | Goldstone Financial Group, LLC | 74 809 | 10,45 | 1 833 | 11,64 | ||||
| 2025-08-05 | 13F | Bank Of Montreal /can/ | 0 | −100,00 | 0 | |||||
| 2025-07-07 | 13F | Trust Co Of Oklahoma | 10 106 | 0,00 | 247 | 1,23 | ||||
| 2025-07-21 | 13F | Mechanics Financial Corp | 1 100 | 0,00 | 27 | 0,00 | ||||
| 2025-08-11 | 13F | Strategic Wealth Partners, Ltd. | 1 078 | 26 | ||||||
| 2025-08-14 | 13F | Prelude Capital Management, Llc | 0 | −100,00 | 0 | |||||
| 2025-07-31 | 13F | Oppenheimer & Co Inc | 24 084 | −3,10 | 589 | −2,33 | ||||
| 2025-07-09 | 13F | Byrne Asset Management LLC | 80 | 0,00 | 2 | 0,00 | ||||
| 2025-08-14 | 13F | TCG Advisory Services, LLC | 88 519 | −12,52 | 2 164 | −11,75 | ||||
| 2025-05-09 | 13F | CoreCap Advisors, LLC | 0 | −100,00 | 0 | |||||
| 2025-08-11 | 13F | Walter & Keenan Financial Consulting Co /mi/ /adv | 33 526 | −16,99 | 820 | −16,26 | ||||
| 2025-08-07 | 13F | Allworth Financial LP | 19 | 0 | ||||||
| 2025-07-10 | 13F | Wealth Enhancement Advisory Services, Llc | 171 968 | −8,69 | 4 213 | −7,71 | ||||
| 2025-08-14 | 13F | GWM Advisors LLC | 19 496 | 16,11 | 477 | 16,95 | ||||
| 2025-07-30 | 13F | Whittier Trust Co Of Nevada Inc | 29 224 | −26,57 | 715 | −25,93 | ||||
| 2025-07-09 | 13F | WealthCare Investment Partners, LLC | 56 461 | −10,53 | 1 383 | −7,86 | ||||
| 2025-07-30 | 13F | Whittier Trust Co | 168 935 | −2,71 | 4 130 | −1,83 | ||||
| 2025-07-31 | 13F | Burke & Herbert Bank & Trust Co | 62 980 | 0,00 | 1 540 | 0,85 | ||||
| 2025-08-07 | 13F | Pinnacle Wealth Management Advisory Group, LLC | 17 404 | 0,00 | 426 | 0,95 | ||||
| 2025-07-28 | 13F | Duncker Streett & Co Inc | 100 088 | −0,79 | 2 447 | 0,08 | ||||
| 2025-08-05 | 13F | Bank of New York Mellon Corp | 21 683 | −13,23 | 530 | −12,40 | ||||
| 2025-08-12 | 13F | Horizon Financial Services, Llc | 872 | 0,00 | 21 | 0,00 | ||||
| 2025-08-13 | 13F | First Trust Advisors Lp | 18 000 | 440 | ||||||
| 2025-08-04 | 13F | Migdal Insurance & Financial Holdings Ltd. | 400 000 | 0,00 | 10 | 0,00 | ||||
| 2025-08-19 | 13F | National Asset Management, Inc. | 0 | −100,00 | 0 | |||||
| 2025-08-13 | 13F | RPg Family Wealth Advisory, LLC | 174 708 | 3,84 | 4 272 | 4,73 | ||||
| 2025-08-12 | 13F | Steward Partners Investment Advisory, Llc | 40 302 | −7,39 | 985 | −6,55 | ||||
| 2025-07-16 | 13F | Signaturefd, Llc | 42 | −46,84 | 1 | 0,00 | ||||
| 2025-07-31 | 13F | Glass Jacobson Investment Advisors llc | 0 | −100,00 | 0 | |||||
| 2025-08-01 | 13F | Financial Counselors Inc | 0 | −100,00 | 0 | |||||
| 2025-08-14 | 13F | Goldman Sachs Group Inc | 91 743 | 10,08 | 2 243 | 11,04 | ||||
| 2025-07-15 | 13F | Graypoint LLC | 50 591 | −7,13 | 1 237 | −6,36 | ||||
| 2025-08-14 | 13F | MGB Wealth Management, LLC | 22 080 | 15,85 | 540 | 16,67 | ||||
| 2025-08-05 | 13F | Marion Wealth Management | 11 755 | −1,91 | 287 | −1,03 | ||||
| 2025-08-14 | 13F | Royal Bank Of Canada | 551 527 | 4,00 | 13 486 | 4,91 | ||||
| 2025-08-08 | 13F | Meridian Wealth Management, LLC | 226 054 | −6,19 | 5 527 | −5,38 | ||||
| 2025-04-23 | 13F | Western Wealth Management, LLC | 0 | −100,00 | 0 | −100,00 | ||||
| 2025-07-21 | 13F | Barrett & Company, Inc. | 2 675 | 0,00 | 65 | 1,56 | ||||
| 2025-07-25 | 13F | Endowment Wealth Management, Inc. | 12 827 | 9,74 | 314 | 10,60 | ||||
| 2025-08-04 | 13F | Integrity Alliance, Llc. | 17 877 | −91,88 | 437 | −91,81 | ||||
| 2025-08-01 | 13F | Ashton Thomas Private Wealth, LLC | 391 247 | 4,20 | 9 566 | 5,10 | ||||
| 2025-08-12 | 13F | Gladstone Institutional Advisory LLC | 40 568 | 4,28 | 992 | 5,09 | ||||
| 2025-07-07 | 13F | Wesbanco Bank Inc | 70 279 | 1 718 | ||||||
| 2025-08-01 | 13F | Envestnet Asset Management Inc | 1 462 600 | 11,63 | 35 761 | 12,59 | ||||
| 2025-07-14 | 13F | UMA Financial Services, Inc. | 265 | 6 | ||||||
| 2025-07-15 | 13F | Fifth Third Bancorp | 4 200 | 0,00 | 103 | 0,99 | ||||
| 2025-08-06 | 13F | AE Wealth Management LLC | 156 | −74,21 | 4 | −78,57 | ||||
| 2025-08-18 | 13F | Old North State Trust, LLC | 9 087 | 0,00 | 0 | |||||
| 2025-08-14 | 13F | Benjamin Edwards Inc | 530 289 | −9,00 | 12 966 | −8,22 | ||||
| 2025-07-31 | 13F | Cambridge Investment Research Advisors, Inc. | 103 903 | −51,35 | 3 | −60,00 | ||||
| 2025-08-14 | 13F | Coastal Bridge Advisors, LLC | 12 029 | 0,30 | 294 | 1,38 | ||||
| 2025-07-08 | 13F | Parallel Advisors, LLC | 770 | 19 | ||||||
| 2025-07-24 | 13F | Us Bancorp \de\ | 0 | −100,00 | 0 | |||||
| 2025-08-14 | 13F | Mariner, LLC | 15 565 | 381 | ||||||
| 2025-07-08 | 13F | First National Corp /ma/ /adv | 114 306 | 10,41 | 2 795 | 11,36 | ||||
| 2025-08-05 | 13F | Transatlantique Private Wealth Llc | 14 001 | 0,00 | 342 | 0,88 | ||||
| 2025-08-14 | 13F | Ancora Advisors, LLC | 7 541 | 41,88 | 184 | 43,75 | ||||
| 2025-07-14 | 13F | Park Avenue Securities Llc | 160 647 | 4 | ||||||
| 2025-08-07 | 13F | Commerce Bank | 8 881 | 0,00 | 217 | 0,93 | ||||
| 2025-08-11 | 13F | United Capital Financial Advisers, Llc | 11 944 | −33,49 | 292 | −32,87 | ||||
| 2025-08-13 | 13F | Transce3nd, LLC | 136 | −39,56 | 3 | −40,00 | ||||
| 2025-07-29 | 13F | Stratos Wealth Partners, LTD. | 8 877 | 1,32 | 217 | 2,36 | ||||
| 2025-07-30 | 13F | D.a. Davidson & Co. | 46 200 | 5,90 | 1 130 | 6,81 | ||||
| 2025-07-15 | 13F | RVW Wealth, LLC | 11 314 | 0,00 | 277 | 0,73 | ||||
| 2025-08-14 | 13F | Bank Of America Corp /de/ | 7 993 469 | 4,88 | 195 440 | 5,79 | ||||
| 2025-08-07 | 13F | Palouse Capital Management, Inc. | 22 344 | −2,04 | 546 | −1,09 | ||||
| 2025-07-28 | 13F | BRYN MAWR TRUST Co | 0 | −100,00 | 0 | |||||
| 2025-08-14 | 13F | Stifel Financial Corp | 564 230 | −1,08 | 13 795 | −0,22 | ||||
| 2025-08-05 | 13F | Key FInancial Inc | 2 111 | 0,00 | 52 | 0,00 | ||||
| 2025-08-13 | 13F | Northwestern Mutual Wealth Management Co | 146 993 | 20,11 | 3 594 | 21,14 | ||||
| 2025-07-11 | 13F | Williams Financial, LLC | 0 | −100,00 | 0 | |||||
| 2025-08-05 | 13F | Advisors Preferred, LLC | 1 666 | −92,97 | 41 | −93,03 | ||||
| 2025-08-05 | 13F | Sigma Planning Corp | 9 265 | 227 | ||||||
| 2025-08-18 | 13F | Geneos Wealth Management Inc. | 12 432 | 9,17 | 304 | 9,78 | ||||
| 2025-04-24 | 13F | Family Investment Center, Inc. | 0 | −100,00 | 0 | |||||
| 2025-08-14 | 13F | Diversify Advisory Services, LLC | 8 964 | 220 | ||||||
| 2025-08-14 | 13F | Ameriprise Financial Inc | 564 744 | −3,23 | 13 808 | −1,85 | ||||
| 2025-07-29 | 13F | Activest Wealth Management | 52 466 | 0,33 | 1 283 | 1,18 | ||||
| 2025-07-29 | 13F | Vectors Research Management, LLC | 29 923 | 1,22 | 732 | 2,09 | ||||
| 2025-07-17 | 13F | Vermillion Wealth Management, Inc. | 982 | 0,00 | 24 | 4,35 | ||||
| 2025-09-04 | 13F/A | Advisor Group Holdings, Inc. | 721 147 | 14,75 | 17 633 | 15,74 | ||||
| 2025-07-17 | 13F | Venture Visionary Partners LLC | 19 707 | 0,00 | 482 | 0,84 | ||||
| 2025-07-31 | 13F | Nilsine Partners, LLC | 226 080 | 4,51 | 5 528 | 5,42 | ||||
| 2025-08-13 | 13F | Fort Sheridan Advisors Llc | 18 700 | −9,66 | 457 | −8,78 | ||||
| 2025-08-13 | 13F | Renaissance Technologies Llc | 264 159 | 61,81 | 6 459 | 63,20 | ||||
| 2025-07-31 | 13F | Jackson Hole Capital Partners, LLC | 71 743 | −0,26 | 1 754 | 0,63 | ||||
| 2025-08-12 | 13F | O'shaughnessy Asset Management, Llc | 1 | 0,00 | 0 | |||||
| 2025-08-04 | 13F | Pinnacle Associates Ltd | 36 652 | −2,53 | 896 | −1,65 | ||||
| 2025-08-08 | 13F | Citizens Financial Group Inc/ri | 10 000 | 244 | ||||||
| 2025-08-11 | 13F | Oder Investment Management, LLC | 100 937 | 4,19 | 2 468 | 5,07 | ||||
| 2025-07-10 | 13F | SK Wealth Management, LLC | 24 563 | −4,85 | 603 | −1,95 | ||||
| 2025-07-31 | 13F | Buckingham Strategic Partners | 31 406 | −42,80 | 768 | −42,33 | ||||
| 2025-08-14 | 13F | Fmr Llc | 2 343 | 136,19 | 57 | 137,50 | ||||
| 2025-08-08 | 13F | Principal Financial Group Inc | 50 671 | 1 239 | ||||||
| 2025-08-05 | 13F | J. W. Coons Advisors, LLC | 32 645 | −3,70 | 798 | −2,80 | ||||
| 2025-08-19 | 13F | Newbridge Financial Services Group, Inc. | 79 | 0,00 | 2 | 0,00 | ||||
| 2025-08-04 | 13F | Atria Investments Llc | 98 313 | 975,99 | 2 404 | 987,33 | ||||
| 2025-08-13 | 13F | Invesco Ltd. | 257 976 | −2,65 | 6 308 | −1,81 | ||||
| 2025-08-11 | 13F | Howard Wealth Management, Llc | 81 496 | 11,51 | 1 993 | 12,48 | ||||
| 2025-07-29 | 13F | Disciplined Investments, LLC | 12 905 | 0,05 | 316 | 0,96 | ||||
| 2025-07-24 | 13F | Comprehensive Money Management Services LLC | 16 212 | −4,42 | 396 | −3,65 | ||||
| 2025-08-01 | 13F | James Investment Research Inc | 60 479 | 0,00 | 1 479 | 0,82 | ||||
| 2025-08-05 | 13F | GPS Wealth Strategies Group, LLC | 375 | 9 | ||||||
| 2025-07-25 | 13F | Envestnet Portfolio Solutions, Inc. | 115 026 | 22,58 | 2 812 | 23,66 | ||||
| 2025-08-13 | 13F | StoneX Group Inc. | 8 309 | −4,68 | 203 | −3,79 | ||||
| 2025-08-13 | 13F | Cary Street Partners Financial Llc | 66 372 | 0,91 | 1 623 | 1,76 | ||||
| 2025-07-30 | 13F | Roman Butler Fullerton & Co | 20 002 | 0,22 | 489 | 3,16 | ||||
| 2025-08-12 | 13F | Segall Bryant & Hamill, Llc | 20 813 | 0,09 | 509 | 0,79 | ||||
| 2025-08-12 | 13F | Tradition Wealth Management, LLC | 19 642 | −1,52 | 480 | −0,62 | ||||
| 2025-07-30 | 13F | Klingman & Associates, LLC | 24 324 | −1,82 | 595 | −1,00 | ||||
| 2025-08-12 | 13F | MAI Capital Management | 331 837 | −7,32 | 8 113 | −6,52 | ||||
| 2025-08-15 | 13F | Tower Research Capital LLC (TRC) | 10 | 0 | ||||||
| 2025-08-12 | 13F | Deutsche Bank Ag\ | 10 248 | 0,00 | 251 | 0,81 | ||||
| 2025-08-01 | 13F | Transcend Wealth Collective, Llc | 0 | −100,00 | 0 | |||||
| 2025-07-18 | 13F | QTR Family Wealth, LLC | 9 000 | 0,00 | 220 | 0,92 | ||||
| 2025-07-29 | 13F | Salomon & Ludwin, LLC | 425 | 0,00 | 10 | 0,00 | ||||
| 2025-08-12 | 13F | LPL Financial LLC | 2 097 358 | −7,68 | 51 280 | −6,88 | ||||
| 2025-07-23 | 13F | Foresight Capital Management Advisors, Inc. | 64 907 | −5,95 | 1 587 | −5,14 | ||||
| 2025-07-30 | 13F | Financial Perspectives, Inc | 505 | 0,00 | 12 | 0,00 | ||||
| 2025-07-24 | 13F | Capital Advisors, Ltd. LLC | 5 060 | 0,74 | 0 |