Grundläggande statistik
| Institutionella ägare | 163 total, 163 long only, 0 short only, 0 long/short - change of −1,20% MRQ |
| Genomsnittlig portföljallokering | 0.5191 % - change of −5,86% MRQ |
| Institutionella aktier (lång) | 25 186 791 (ex 13D/G) - change of 1,92MM shares 8,24% MRQ |
| Institutionellt värde (lång) | $ 525 232 USD ($1000) |
Institutionellt ägande och aktieägare
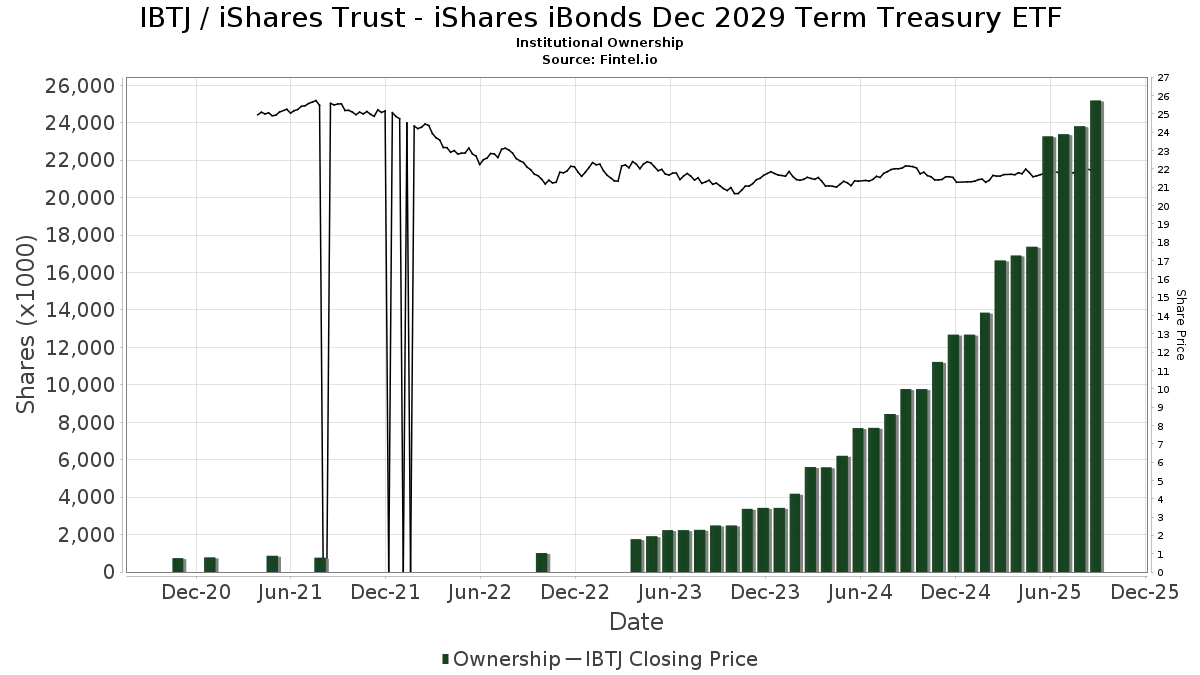
iShares Trust - iShares iBonds Dec 2029 Term Treasury ETF (US:IBTJ) har 163 Institutionella ägare och aktieägare som har lämnat in 13D/G- eller 13F-formulär till Securities Exchange Commission (SEC). Dessa institut innehar totalt 25,186,791 aktier. Största aktieägare inkluderar TRUE Private Wealth Advisors, Wells Fargo & Company/mn, Raymond James Financial Inc, Envestnet Asset Management Inc, UBS Group AG, Hengehold Capital Management Llc, Atwood & Palmer Inc, Stifel Financial Corp, Bank Of America Corp /de/, and Journey Advisory Group, LLC .
iShares Trust - iShares iBonds Dec 2029 Term Treasury ETF (NasdaqGM:IBTJ) Institutionell ägarstruktur visar institutioners och fonders nuvarande positioner i företaget, samt de senaste förändringarna i positionernas storlek. Större aktieägare kan vara enskilda investerare, fonder, hedgefonder eller institutioner. Bilaga 13D visar att investeraren äger (eller ägde) mer än 5% av företaget och avser (eller avsåg) att aktivt eftersträva en förändring av affärsstrategin. Schedule 13G indikerar en passiv investering på över 5%.
The share price as of September 16, 2025 is 22,04 / share. Previously, on September 17, 2024, the share price was 22,19 / share. This represents a decline of 0,68% over that period.
Fondsentimentets poäng
Fondsentimentet poängen(fka Ägarackumulation-poäng) visar vilka aktier som är mest köpta av fonder. Det är resultatet av en sofistikerad kvantitativ flerfaktormodell som identifierar företag med de högsta nivåerna av institutionell ackumulering. Poängsättningsmodellen använder en kombination av den totala ökningen av redovisade ägare, förändringarna i portföljallokeringarna för dessa ägare och andra mått. Siffran sträcker sig från 0 till 100, där högre siffror indikerar en högre nivå av ackumulering i förhållande till sina konkurrenter, och 50 är genomsnittet.
Uppdateringsfrekvens: Dagligen
Se Ownership Explorer, som innehåller en lista över de högst rankade företagen.
Institutionell sälj/köp-kvot
Förutom att rapportera vanliga eget kapital- och skuldemissioner måste institutioner med mer än 100MM tillgångar under förvaltning också avslöja sina innehav av sälj- och köpoptioner. Eftersom säljoptioner i allmänhet indikerar ett negativt sentiment och köpoptioner indikerar ett positivt sentiment, kan vi få en uppfattning om det övergripande institutionella sentimentet genom att plotta förhållandet mellan säljoptioner och köpoptioner. Diagrammet till höger visar det historiska förhållandet mellan sälj- och köpoptioner för detta instrument.
Genom att använda sälj/köp-kvoten som en indikator på aktieägarnas sentiment undviker man en av de största bristerna med att använda det totala institutionella ägandet, nämligen att en betydande del av de förvaltade tillgångarna investeras passivt för att följa index. Passivt förvaltade fonder köper vanligtvis inte optioner, så indikatorn för sälj/köp-kvoten ger en bättre bild av stämningen i aktivt förvaltade fonder.
13F- och NPORT-arkiveringar
Detaljer om 13F-arkiveringar är gratis. Detaljer om NP-arkiveringar kräver ett premiummedlemskap. Gröna rader indikerar nya positioner. Röda rader indikerar stängda positioner. Klicka på länk symbolen för att se hela transaktionshistoriken.
Uppgradera
för att låsa upp premiumdata och exportera till Excel ![]() .
.
| Fil Datum | Källa | Investerare | Typ | Genomsnittligt pris (beräknat) |
Aktier | Δ Aktier (%) |
Rapporterat värde (1000 USD) |
Δ Värde (%) |
Portföljallokering (%) |
|
|---|---|---|---|---|---|---|---|---|---|---|
| 2025-09-09 | 13F | Cambridge Financial Group, LLC | 13 890 | 0,00 | 304 | 0,66 | ||||
| 2025-07-08 | 13F | FF Advisors,LLC | 71 669 | 4,38 | 1 571 | 4,95 | ||||
| 2025-08-12 | 13F | Reliant Wealth Planning | 44 324 | 11,69 | 972 | 12,51 | ||||
| 2025-08-01 | 13F | Logan Capital Management Inc | 286 | 0,00 | 6 | 0,00 | ||||
| 2025-08-14 | 13F | Mml Investors Services, Llc | 18 415 | 35,76 | 0 | |||||
| 2025-07-11 | 13F | Compass Ion Advisors, LLC | 37 974 | 56,87 | 832 | 58,17 | ||||
| 2025-08-06 | 13F | Commonwealth Equity Services, Llc | 648 479 | 1,66 | 14 | 7,69 | ||||
| 2025-08-14 | 13F | Citadel Advisors Llc | 92 604 | 2 030 | ||||||
| 2025-07-30 | 13F | Journey Advisory Group, LLC | 716 790 | 1,68 | 15 712 | 2,38 | ||||
| 2025-08-04 | 13F | Atria Investments Llc | 51 317 | −33,59 | 1 125 | −33,17 | ||||
| 2025-08-11 | 13F | United Capital Financial Advisers, Llc | 486 420 | 71,91 | 10 662 | 73,11 | ||||
| 2025-08-11 | 13F | Guidance Point Advisors, LLC | 9 670 | 0,18 | 212 | 0,48 | ||||
| 2025-04-17 | 13F | Montecito Bank & Trust | 35 894 | 244,34 | 781 | 251,80 | ||||
| 2025-07-16 | 13F | Signaturefd, Llc | 135 487 | 54,43 | 2 970 | 55,53 | ||||
| 2025-05-07 | 13F | Spectrum Wealth Counsel, LLC | 5 266 | 0,00 | 115 | 1,79 | ||||
| 2025-04-14 | 13F | Farther Finance Advisors, LLC | 0 | −100,00 | 0 | |||||
| 2025-07-30 | 13F | Strategic Blueprint, LLC | 37 654 | 136,80 | 825 | 138,44 | ||||
| 2025-07-08 | 13F | Parallel Advisors, LLC | 125 708 | 12,09 | 2 756 | 12,86 | ||||
| 2025-07-24 | 13F | Robertson Stephens Wealth Management, LLC | 297 293 | 10,75 | 6 517 | 11,52 | ||||
| 2025-07-29 | 13F | Stratos Wealth Partners, LTD. | 31 992 | −3,05 | 701 | −2,37 | ||||
| 2025-07-16 | 13F | Old Port Advisors | 35 530 | −26,66 | 779 | −26,19 | ||||
| 2025-08-14 | 13F | Eight 31 Financial Llc | 353 686 | −6,20 | 7 753 | −5,56 | ||||
| 2025-08-11 | 13F | Principal Securities, Inc. | 12 746 | 0,00 | 279 | 2,95 | ||||
| 2025-07-15 | 13F | Highland Financial Advisors, LLC | 11 698 | 0,00 | 256 | 0,79 | ||||
| 2025-07-07 | 13F | Greenfield Savings Bank | 19 106 | 2,51 | 419 | 3,21 | ||||
| 2025-07-25 | 13F | 1858 Wealth Management, Llc | 0 | −100,00 | 0 | |||||
| 2025-04-11 | 13F | Safeguard Financial, LLC | 15 092 | 0,41 | 329 | 2,50 | ||||
| 2025-08-15 | 13F | Captrust Financial Advisors | 94 055 | 31,88 | 2 062 | 32,80 | ||||
| 2025-08-13 | 13F | SCS Capital Management LLC | 106 282 | 0,19 | 2 330 | 0,87 | ||||
| 2025-07-18 | 13F | Precision Wealth Strategies, LLC | 10 546 | 231 | ||||||
| 2025-08-15 | 13F | Howland Capital Management Llc | 138 377 | 4,78 | 3 033 | 5,50 | ||||
| 2025-07-17 | 13F | Stockman Wealth Management, Inc. | 199 449 | 5,99 | 4 372 | 6,71 | ||||
| 2025-07-29 | 13F | Swmg, Llc | 0 | −100,00 | 0 | |||||
| 2025-08-04 | 13F | Jim Saulnier & Associates, Llc | 22 275 | 89,67 | 488 | 91,37 | ||||
| 2025-07-30 | 13F | D.a. Davidson & Co. | 299 485 | 1,33 | 6 565 | 2,02 | ||||
| 2025-08-14 | 13F | Goldman Sachs Group Inc | 0 | −100,00 | 0 | |||||
| 2025-07-23 | 13F | Waycross Investment Management Co | 454 990 | 0,20 | 9 973 | 0,89 | ||||
| 2025-08-12 | 13F | Associated Banc-corp | 62 076 | 12,78 | 1 361 | 13,52 | ||||
| 2025-08-14 | 13F | Financial Engines Advisors L.L.C. | 96 728 | 6,79 | 2 120 | 7,51 | ||||
| 2025-07-14 | 13F | UMA Financial Services, Inc. | 7 164 | 0,00 | 157 | 1,29 | ||||
| 2025-08-01 | 13F | Bank of Jackson Hole Trust | 3 388 | 0,00 | 74 | 1,37 | ||||
| 2025-08-12 | 13F | Tableaux Llc | 0 | −100,00 | 0 | |||||
| 2025-08-15 | 13F | Morgan Stanley | 365 909 | 4,54 | 8 021 | 5,26 | ||||
| 2025-08-08 | 13F | Thoroughbred Financial Services, Llc | 87 619 | −5,34 | 2 | −50,00 | ||||
| 2025-08-08 | 13F | Cetera Investment Advisers | 348 460 | 4,39 | 7 638 | 5,11 | ||||
| 2025-07-15 | 13F | BCS Wealth Management | 0 | −100,00 | 0 | |||||
| 2025-07-17 | 13F | Hengehold Capital Management Llc | 921 543 | 23,43 | 20 200 | 24,28 | ||||
| 2025-08-01 | 13F | Liberty Wealth Management Llc | 12 644 | 277 | ||||||
| 2025-07-08 | 13F | Lowe Wealth Advisors, LLC | 4 369 | −19,79 | 96 | −19,49 | ||||
| 2025-08-11 | 13F | TRUE Private Wealth Advisors | 1 940 071 | 28,61 | 42 526 | 29,50 | ||||
| 2025-05-15 | 13F | Wealth Management Strategies, Inc. | 297 293 | 967,67 | 6 472 | 129 340,00 | ||||
| 2025-07-31 | 13F | Resonant Capital Advisors, LLC | 12 079 | 0,00 | 265 | 0,76 | ||||
| 2025-08-14 | 13F | Hara Capital LLC | 4 832 | 0,00 | 106 | 0,00 | ||||
| 2025-07-07 | 13F | Trust Co | 10 242 | −0,03 | 225 | 0,45 | ||||
| 2025-07-23 | 13F | Valmark Advisers, Inc. | 47 497 | 15,87 | 1 041 | 16,70 | ||||
| 2025-07-30 | 13F | Bogart Wealth, LLC | 3 204 | 0,00 | 70 | 1,45 | ||||
| 2025-08-14 | 13F | Foronjy Financial Llc | 241 795 | 5 300 | ||||||
| 2025-08-14 | 13F | Vista Private Wealth Partners. LLC | 690 448 | 9,76 | 15 135 | 10,51 | ||||
| 2025-08-05 | 13F | Fullcircle Wealth Llc | 15 672 | 0,00 | 343 | 0,00 | ||||
| 2025-08-14 | 13F | Comerica Bank | 1 797 | −0,72 | 39 | 0,00 | ||||
| 2025-07-25 | 13F | Cwm, Llc | 39 592 | 20,00 | 1 | |||||
| 2025-08-11 | 13F | Atlantic Private Wealth, LLC | 44 256 | −40,89 | 970 | −40,49 | ||||
| 2025-08-11 | 13F | Shufro Rose & Co Llc | 20 911 | −0,34 | 455 | −0,22 | ||||
| 2025-07-08 | 13F | Legacy Private Trust Co. | 413 863 | 3,79 | 9 072 | 4,50 | ||||
| 2025-07-17 | 13F | Cyr Financial Inc. | 15 095 | 331 | ||||||
| 2025-08-13 | 13F | Hamel Associates, Inc. | 10 846 | 238 | ||||||
| 2025-07-11 | 13F | First PREMIER Bank | 3 566 | −1,27 | 0 | |||||
| 2025-08-04 | 13F | Creative Financial Designs Inc /adv | 152 | 0,00 | 3 | 0,00 | ||||
| 2025-08-14 | 13F | Ameriprise Financial Inc | 61 747 | 9,72 | 1 353 | 10,45 | ||||
| 2025-08-12 | 13F | Cowa, Llc | 15 725 | 0,00 | 345 | 0,58 | ||||
| 2025-08-12 | 13F | Proequities, Inc. | 0 | 0 | ||||||
| 2025-08-05 | 13F | GPS Wealth Strategies Group, LLC | 0 | −100,00 | 0 | |||||
| 2025-08-07 | 13F | Fagan Associates, Inc. | 289 131 | 0,05 | 6 338 | 0,73 | ||||
| 2025-07-17 | 13F/A | Capital Investment Advisors, LLC | 16 966 | 18,29 | 372 | 18,91 | ||||
| 2025-04-22 | 13F | Mendota Financial Group, LLC | 0 | −100,00 | 0 | |||||
| 2025-08-14 | 13F | Benjamin Edwards Inc | 664 024 | 0,73 | 14 555 | 1,42 | ||||
| 2025-08-13 | 13F | Lido Advisors, LLC | 9 999 | 0,37 | 219 | 1,39 | ||||
| 2025-08-14 | 13F | UBS Group AG | 922 187 | 17,34 | 20 214 | 18,15 | ||||
| 2025-07-28 | 13F | Harbour Investments, Inc. | 18 156 | 70,18 | 398 | 71,12 | ||||
| 2025-08-11 | 13F | Summit Wealth Partners, LLC | 12 080 | 282 | ||||||
| 2025-05-14 | 13F | Susquehanna International Group, Llp | 0 | −100,00 | 0 | |||||
| 2025-07-24 | 13F | Leo Wealth, LLC | 59 611 | 1,30 | 1 307 | 1,95 | ||||
| 2025-07-30 | 13F | Granite Harbor Advisors, Inc. | 22 866 | 3,97 | 501 | 4,81 | ||||
| 2025-07-18 | 13F | Northstar Group, Inc. | 9 720 | −14,30 | 213 | −13,41 | ||||
| 2025-08-05 | 13F | Cherry Tree Wealth Management, LLC | 6 017 | 22,10 | 132 | 22,43 | ||||
| 2025-07-11 | 13F | Trinity Wealth Management, LLC | 15 668 | 2,00 | 343 | 2,69 | ||||
| 2025-08-12 | 13F | BlackRock, Inc. | 193 562 | 19,03 | 4 243 | 19,83 | ||||
| 2025-08-07 | 13F | Allworth Financial LP | 59 919 | 552,64 | 1 313 | 556,50 | ||||
| 2025-08-13 | 13F | RFP Financial Group LLC | 30 110 | −46,25 | 660 | −47,54 | ||||
| 2025-08-14 | 13F | Evergreen Wealth Solutions, LLC | 9 500 | 0,00 | 208 | 0,97 | ||||
| 2025-08-07 | 13F | CENTRAL TRUST Co | 286 001 | 9,27 | 6 269 | 10,02 | ||||
| 2025-08-14 | 13F | STAR Financial Bank | 109 777 | 8,37 | 2 406 | 9,12 | ||||
| 2025-07-28 | 13F | Duncker Streett & Co Inc | 27 921 | 0,00 | 612 | 0,82 | ||||
| 2025-07-24 | 13F | IFP Advisors, Inc | 120 719 | −5,25 | 2 646 | −4,58 | ||||
| 2025-08-20 | 13F | Forefront Wealth Partners, LLC | 0 | −100,00 | 0 | |||||
| 2025-07-31 | 13F | Keeler THomas Management LLC | 117 474 | 29,88 | 2 575 | 30,78 | ||||
| 2025-05-06 | 13F | Venturi Wealth Management, LLC | 0 | −100,00 | 0 | |||||
| 2025-08-11 | 13F | CFS Investment Advisory Services, LLC | 9 241 | −12,07 | 0 | |||||
| 2025-08-01 | 13F | Austin Private Wealth, LLC | 24 015 | −2,51 | 526 | −1,87 | ||||
| 2025-08-14 | 13F | Raymond James Financial Inc | 1 020 133 | 19,33 | 22 361 | 20,16 | ||||
| 2025-08-14 | 13F | Colony Group, LLC | 17 847 | 391 | ||||||
| 2025-05-12 | 13F | Kohmann Bosshard Financial Services, LLC | 0 | −100,00 | 0 | |||||
| 2025-07-25 | 13F | Apollon Wealth Management, LLC | 10 023 | 0,48 | 220 | 0,92 | ||||
| 2025-08-01 | 13F | Envestnet Asset Management Inc | 971 487 | 40,44 | 21 295 | 41,40 | ||||
| 2025-08-13 | 13F | Northwestern Mutual Wealth Management Co | 144 344 | 5,17 | 3 164 | 5,93 | ||||
| 2025-08-01 | 13F | Schmidt P J Investment Management Inc | 17 504 | 0,14 | 384 | 0,79 | ||||
| 2025-08-04 | 13F | Whalen Wealth Management Inc. | 167 517 | −10,70 | 3 672 | −10,09 | ||||
| 2025-08-12 | 13F | PSI Advisors, LLC | 0 | −100,00 | 0 | |||||
| 2025-08-14 | 13F | GWM Advisors LLC | 47 486 | −71,25 | 1 041 | −71,08 | ||||
| 2025-08-13 | 13F | Capital Analysts, Inc. | 2 126 | 0,00 | 0 | |||||
| 2025-08-05 | 13F | C2P Capital Advisory Group, LLC d.b.a. Prosperity Capital Advisors | 0 | −100,00 | 0 | |||||
| 2025-08-14 | 13F | Integrated Wealth Concepts LLC | 69 201 | 0,28 | 1 517 | 0,93 | ||||
| 2025-07-22 | 13F | Merit Financial Group, LLC | 15 184 | 333 | ||||||
| 2025-08-13 | 13F | Cary Street Partners Financial Llc | 40 960 | 3,25 | 898 | 3,94 | ||||
| 2025-08-18 | 13F/A | Kestra Investment Management, LLC | 17 771 | −44,02 | 390 | −43,70 | ||||
| 2025-08-12 | 13F | Titleist Asset Management, Llc | 71 302 | −1,40 | 1 563 | −0,76 | ||||
| 2025-06-23 | NP | LDRT - iShares iBonds 1-5 Year Treasury Ladder ETF | 181 194 | 200,00 | 3 984 | 207,88 | ||||
| 2025-07-22 | 13F | Belpointe Asset Management LLC | 31 849 | 201,80 | 698 | 204,80 | ||||
| 2025-07-18 | 13F | Foundry Financial Group, Inc. | 30 020 | −17,75 | 658 | −17,13 | ||||
| 2025-08-14 | 13F | Mercer Global Advisors Inc /adv | 599 379 | 39,40 | 13 138 | 40,36 | ||||
| 2025-07-21 | 13F | Barrett & Company, Inc. | 8 235 | 33,90 | 181 | 35,34 | ||||
| 2025-07-31 | 13F | Blake Schutter Theil Wealth Advisors, LLC | 24 153 | −2,25 | 529 | −1,49 | ||||
| 2025-08-08 | 13F | TD Capital Management LLC | 2 026 | 0,95 | 44 | 2,33 | ||||
| 2025-07-23 | 13F | Evexia Wealth Llc | 36 612 | −40,09 | 797 | −39,92 | ||||
| 2025-07-29 | 13F | Accretive Wealth Partners, LLC | 147 476 | 4,83 | 3 233 | 5,48 | ||||
| 2025-09-04 | 13F/A | Advisor Group Holdings, Inc. | 65 014 | −20,31 | 1 425 | −19,76 | ||||
| 2025-07-21 | 13F | Cliftonlarsonallen Wealth Advisors, Llc | 166 053 | 30,89 | 3 640 | 31,80 | ||||
| 2025-08-04 | 13F | REDW Wealth LLC | 0 | −100,00 | 0 | |||||
| 2025-08-14 | 13F | Royal Bank Of Canada | 212 635 | −10,91 | 4 661 | −10,30 | ||||
| 2025-08-11 | 13F | Midwest Professional Planners, LTD. | 15 864 | 61,19 | 348 | 62,15 | ||||
| 2025-08-14 | 13F | Stifel Financial Corp | 821 677 | 2,33 | 18 011 | 3,03 | ||||
| 2025-08-13 | 13F | Cerity Partners LLC | 21 573 | −0,51 | 473 | 0,00 | ||||
| 2025-08-12 | 13F | Global Retirement Partners, LLC | 2 289 | 0,00 | 50 | 4,17 | ||||
| 2025-08-14 | 13F | Jane Street Group, Llc | 0 | −100,00 | 0 | −100,00 | ||||
| 2025-08-08 | 13F | Pnc Financial Services Group, Inc. | 64 | 0,00 | 1 | 0,00 | ||||
| 2025-08-14 | 13F | Fmr Llc | 431 | −23,58 | 9 | −25,00 | ||||
| 2025-07-10 | 13F | Wealth Enhancement Advisory Services, Llc | 0 | −100,00 | 0 | |||||
| 2025-08-13 | 13F | Boston Family Office Llc | 107 789 | 30,07 | 2 | 100,00 | ||||
| 2025-08-15 | 13F | Provenance Wealth Advisors, LLC | 0 | −100,00 | 0 | −100,00 | ||||
| 2025-08-12 | 13F | Steward Partners Investment Advisory, Llc | 9 518 | 5,74 | 209 | 6,67 | ||||
| 2025-07-30 | 13F/A | Old Point Trust & Financial Services N A | 700 | 15 | ||||||
| 2025-07-09 | 13F | Krilogy Financial LLC | 46 115 | −2,78 | 1 011 | −2,13 | ||||
| 2025-07-21 | 13F | Crews Bank & Trust | 14 160 | 3,36 | 310 | 4,03 | ||||
| 2025-07-31 | 13F | Leavell Investment Management, Inc. | 35 522 | 94,23 | 779 | 95,48 | ||||
| 2025-07-14 | 13F | Park Avenue Securities Llc | 153 220 | 11,84 | 3 | 50,00 | ||||
| 2025-08-19 | 13F | Asset Dedication, LLC | 20 430 | 21,54 | 448 | 22,47 | ||||
| 2025-07-16 | 13F | Rebalance, Llc | 178 285 | 201,88 | 3 908 | 204,12 | ||||
| 2025-08-14 | 13F | Bank Of America Corp /de/ | 724 237 | −4,54 | 15 875 | −3,88 | ||||
| 2025-08-18 | 13F/A | National Bank Of Canada /fi/ | 663 | 15 | ||||||
| 2025-08-12 | 13F | LPL Financial LLC | 337 280 | 13,27 | 7 393 | 14,05 | ||||
| 2025-07-01 | 13F | Confluence Investment Management Llc | 531 810 | −0,57 | 11 657 | 0,12 | ||||
| 2025-07-25 | 13F | Heartland Bank & Trust Co | 18 350 | 3,12 | 402 | 3,88 | ||||
| 2025-08-13 | 13F | Jones Financial Companies Lllp | 0 | −100,00 | 0 | |||||
| 2025-07-11 | 13F | Prosperity Planning, Inc. | 307 | 5,15 | ||||||
| 2025-08-12 | 13F | Jpmorgan Chase & Co | 2 934 | −49,30 | 64 | −48,80 | ||||
| 2025-08-08 | 13F | Mv Capital Management, Inc. | 120 955 | 16,18 | 2 651 | 16,99 | ||||
| 2025-07-08 | 13F | Atwood & Palmer Inc | 903 240 | −20,66 | 19 799 | −20,11 | ||||
| 2025-08-11 | 13F | Estate Counselors, LLC | 0 | −100,00 | 0 | |||||
| 2025-05-02 | 13F | Whittier Trust Co | 0 | −100,00 | 0 | |||||
| 2025-08-01 | 13F | Transcend Wealth Collective, Llc | 15 925 | −66,06 | 349 | −65,82 | ||||
| 2025-08-13 | 13F | Baird Financial Group, Inc. | 103 277 | 141,82 | 2 264 | 143,60 | ||||
| 2025-08-14 | 13F | Snowden Capital Advisors LLC | 39 100 | 0,00 | 857 | 0,71 | ||||
| 2025-07-30 | 13F | Probity Advisors, Inc. | 393 741 | 4,76 | 8 631 | 5,49 | ||||
| 2025-08-01 | 13F | James Investment Research Inc | 13 696 | 0,00 | 300 | 0,67 | ||||
| 2025-07-09 | 13F | LifePlan Financial, LLC | 0 | −100,00 | 0 | |||||
| 2025-08-11 | 13F | HighTower Advisors, LLC | 45 690 | −4,14 | 1 002 | −3,47 | ||||
| 2025-07-24 | 13F | Costello Asset Management, INC | 463 | 0,87 | 10 | 11,11 | ||||
| 2025-07-29 | 13F | Private Trust Co Na | 0 | −100,00 | 0 | |||||
| 2025-07-25 | 13F | Hemington Wealth Management | 39 | 0,00 | 0 | |||||
| 2025-07-16 | 13F | MKT Advisors LLC | 461 822 | 3,81 | 10 072 | 3,72 | ||||
| 2025-05-02 | 13F | Evergreen Private Wealth LLC | 0 | −100,00 | 0 | |||||
| 2025-07-30 | 13F | DecisionMap Wealth Management, LLC | 15 639 | 21,06 | 343 | 21,71 | ||||
| 2025-08-12 | 13F | Coldstream Capital Management Inc | 14 181 | 0,00 | 311 | 0,65 | ||||
| 2025-07-24 | 13F | Us Bancorp \de\ | 4 095 | 13,91 | 90 | 14,10 | ||||
| 2025-08-12 | 13F | Jaffetilchin Investment Partners, LLC | 11 946 | 0,99 | 262 | 1,56 | ||||
| 2025-04-25 | 13F | Altus Wealth Group LLC | 0 | −100,00 | 0 | |||||
| 2025-07-23 | 13F | Element Wealth, LLC | 11 876 | 24,11 | 260 | 25,00 | ||||
| 2025-07-08 | 13F | Apella Capital, LLC | 49 822 | 29,16 | 1 083 | 29,55 | ||||
| 2025-08-05 | 13F | Bank Of Montreal /can/ | 1 715 | 1,00 | 38 | 2,78 | ||||
| 2025-07-17 | 13F | Janney Montgomery Scott LLC | 125 767 | 21,72 | 3 | 0,00 | ||||
| 2025-08-14 | 13F | Wells Fargo & Company/mn | 1 504 363 | 4,51 | 32 976 | 5,23 | ||||
| 2025-08-15 | 13F | Kestra Advisory Services, LLC | 11 569 | 254 | ||||||
| 2025-07-29 | 13F | Spreng Capital Management, Inc. | 274 835 | 6,01 | 6 024 | 6,75 | ||||
| 2025-08-01 | 13F | Signature Wealth Management Group | 22 790 | −4,68 | 500 | −4,04 | ||||
| 2025-08-05 | 13F | Bank of New York Mellon Corp | 10 898 | −22,47 | 239 | −21,97 | ||||
| 2025-08-14 | 13F | AllSquare Wealth Management LLC | 930 | 0,00 | 20 | 0,00 | ||||
| 2025-07-31 | 13F | Cambridge Investment Research Advisors, Inc. | 23 085 | −5,83 | 1 | |||||
| 2025-07-11 | 13F | Shelton Wealth Management, Llc | 347 632 | 3,97 | 7 620 | 4,70 | ||||
| 2025-08-05 | 13F | Huntington National Bank | 14 | |||||||
| 2025-08-12 | 13F | Jacobi Capital Management LLC | 18 200 | 6,50 | 399 | 6,99 | ||||
| 2025-08-08 | 13F | WASHINGTON TRUST Co | 9 362 | −11,36 | 205 | −10,48 |