Grundläggande statistik
| Institutionella ägare | 140 total, 140 long only, 0 short only, 0 long/short - change of 6,82% MRQ |
| Genomsnittlig portföljallokering | 0.7676 % - change of 14,71% MRQ |
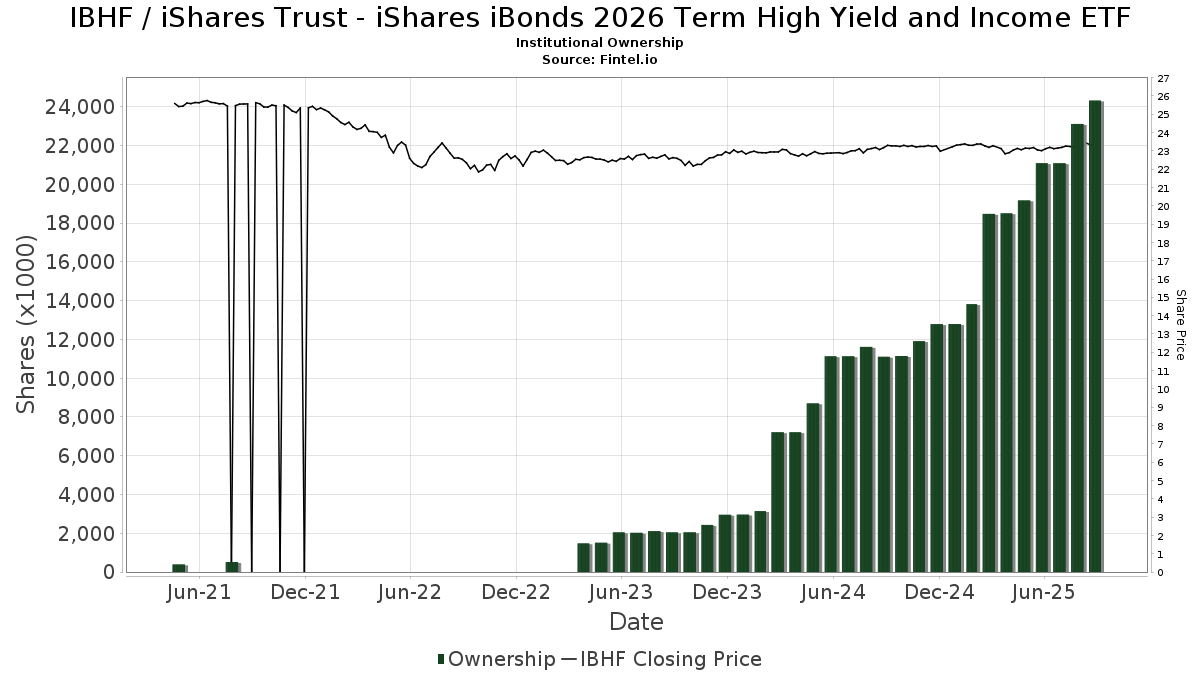
| Institutionella aktier (lång) | 24 329 899 (ex 13D/G) - change of 3,54MM shares 17,05% MRQ |
| Institutionellt värde (lång) | $ 530 334 USD ($1000) |
Institutionellt ägande och aktieägare
iShares Trust - iShares iBonds 2026 Term High Yield and Income ETF (US:IBHF) har 140 Institutionella ägare och aktieägare som har lämnat in 13D/G- eller 13F-formulär till Securities Exchange Commission (SEC). Dessa institut innehar totalt 24,329,899 aktier. Största aktieägare inkluderar Bank Of America Corp /de/, Morgan Stanley, Sterling Financial Group, Inc., Cambridge Investment Research Advisors, Inc., Private Advisor Group, LLC, Wells Fargo & Company/mn, Lbmc Investment Advisors, Llc, Northwestern Mutual Wealth Management Co, Straightline Group Llc, and LPL Financial LLC .
iShares Trust - iShares iBonds 2026 Term High Yield and Income ETF (BATS:IBHF) Institutionell ägarstruktur visar institutioners och fonders nuvarande positioner i företaget, samt de senaste förändringarna i positionernas storlek. Större aktieägare kan vara enskilda investerare, fonder, hedgefonder eller institutioner. Bilaga 13D visar att investeraren äger (eller ägde) mer än 5% av företaget och avser (eller avsåg) att aktivt eftersträva en förändring av affärsstrategin. Schedule 13G indikerar en passiv investering på över 5%.
The share price as of September 8, 2025 is 23,28 / share. Previously, on September 9, 2024, the share price was 23,14 / share. This represents an increase of 0,61% over that period.
Fondsentimentets poäng
Fondsentimentet poängen(fka Ägarackumulation-poäng) visar vilka aktier som är mest köpta av fonder. Det är resultatet av en sofistikerad kvantitativ flerfaktormodell som identifierar företag med de högsta nivåerna av institutionell ackumulering. Poängsättningsmodellen använder en kombination av den totala ökningen av redovisade ägare, förändringarna i portföljallokeringarna för dessa ägare och andra mått. Siffran sträcker sig från 0 till 100, där högre siffror indikerar en högre nivå av ackumulering i förhållande till sina konkurrenter, och 50 är genomsnittet.
Uppdateringsfrekvens: Dagligen
Se Ownership Explorer, som innehåller en lista över de högst rankade företagen.
Institutionell sälj/köp-kvot
Förutom att rapportera vanliga eget kapital- och skuldemissioner måste institutioner med mer än 100MM tillgångar under förvaltning också avslöja sina innehav av sälj- och köpoptioner. Eftersom säljoptioner i allmänhet indikerar ett negativt sentiment och köpoptioner indikerar ett positivt sentiment, kan vi få en uppfattning om det övergripande institutionella sentimentet genom att plotta förhållandet mellan säljoptioner och köpoptioner. Diagrammet till höger visar det historiska förhållandet mellan sälj- och köpoptioner för detta instrument.
Genom att använda sälj/köp-kvoten som en indikator på aktieägarnas sentiment undviker man en av de största bristerna med att använda det totala institutionella ägandet, nämligen att en betydande del av de förvaltade tillgångarna investeras passivt för att följa index. Passivt förvaltade fonder köper vanligtvis inte optioner, så indikatorn för sälj/köp-kvoten ger en bättre bild av stämningen i aktivt förvaltade fonder.

13F- och NPORT-arkiveringar
Detaljer om 13F-arkiveringar är gratis. Detaljer om NP-arkiveringar kräver ett premiummedlemskap. Gröna rader indikerar nya positioner. Röda rader indikerar stängda positioner. Klicka på länk symbolen för att se hela transaktionshistoriken.
Uppgradera
för att låsa upp premiumdata och exportera till Excel ![]() .
.
| Fil Datum | Källa | Investerare | Typ | Genomsnittligt pris (beräknat) |
Aktier | Δ Aktier (%) |
Rapporterat värde (1000 USD) |
Δ Värde (%) |
Portföljallokering (%) |
|
|---|---|---|---|---|---|---|---|---|---|---|
| 2025-07-29 | 13F | Stratos Wealth Partners, LTD. | 138 721 | 66,83 | 3 223 | 66,94 | ||||
| 2025-08-06 | 13F | Savant Capital, LLC | 10 156 | 0,00 | 236 | 0,00 | ||||
| 2025-07-08 | 13F | FF Advisors,LLC | 177 871 | 3,56 | 4 132 | 4,32 | ||||
| 2025-08-14 | 13F | Goldman Sachs Group Inc | 0 | −100,00 | 0 | −100,00 | ||||
| 2025-05-02 | 13F | Whittier Trust Co | 0 | −100,00 | 0 | |||||
| 2025-08-08 | 13F | Wrapmanager Inc | 49 204 | 1,68 | 1 143 | 1,78 | ||||
| 2025-07-14 | 13F | Occidental Asset Management, LLC | 11 540 | 0,00 | 268 | 0,37 | ||||
| 2025-04-01 | 13F | Massmutual Trust Co Fsb/adv | 0 | −100,00 | 0 | |||||
| 2025-08-11 | 13F | Arrow Financial Corp | 724 261 | 116,28 | 16 825 | 116,39 | ||||
| 2025-08-08 | 13F | Marble Harbor Investment Counsel, LLC | 18 600 | −9,72 | 432 | −9,62 | ||||
| 2025-07-15 | 13F | North Star Investment Management Corp. | 2 000 | 46 | ||||||
| 2025-08-15 | 13F | High Falls Advisors, Inc | 12 551 | 16,49 | 292 | 16,40 | ||||
| 2025-08-08 | 13F | Creative Planning | 12 580 | 292 | ||||||
| 2025-07-28 | 13F | Harbour Investments, Inc. | 869 | 62,13 | 20 | 66,67 | ||||
| 2025-08-06 | 13F | Commonwealth Equity Services, Llc | 143 670 | 5,82 | 3 | 0,00 | ||||
| 2025-08-13 | 13F | Lido Advisors, LLC | 177 875 | −7,24 | 4 132 | −7,19 | ||||
| 2025-08-15 | 13F | Howland Capital Management Llc | 13 740 | 0,00 | 319 | 0,00 | ||||
| 2025-08-05 | 13F | GPS Wealth Strategies Group, LLC | 15 | 0 | ||||||
| 2025-08-11 | 13F | Aptus Capital Advisors, LLC | 1 309 | 0,46 | 30 | 0,00 | ||||
| 2025-08-01 | 13F | Ashton Thomas Private Wealth, LLC | 0 | −100,00 | 0 | |||||
| 2025-08-14 | 13F | Eight 31 Financial Llc | 79 140 | 0,62 | 1 838 | 0,66 | ||||
| 2025-08-14 | 13F | Ruggaard & Associates LLC | 574 522 | −2,16 | 13 346 | −2,12 | ||||
| 2025-08-04 | 13F | Cottage Street Advisors LLC | 69 930 | 9,74 | 1 624 | 9,80 | ||||
| 2025-08-14 | 13F | GWM Advisors LLC | 202 776 | 0,66 | 4 710 | 0,71 | ||||
| 2025-08-14 | 13F | Headinvest, Llc | 33 425 | −2,90 | 776 | −2,88 | ||||
| 2025-08-12 | 13F | Global Retirement Partners, LLC | 10 930 | 1,64 | 254 | 2,02 | ||||
| 2025-07-10 | 13F | Sterling Financial Group, Inc. | 1 210 761 | 28 126 | ||||||
| 2025-08-04 | 13F | Spire Wealth Management | 3 955 | −37,40 | 92 | −37,67 | ||||
| 2025-08-15 | 13F | Captrust Financial Advisors | 10 913 | 254 | ||||||
| 2025-08-11 | 13F | Principal Securities, Inc. | 5 822 | 39,82 | 135 | 40,63 | ||||
| 2025-08-12 | 13F | PSI Advisors, LLC | 0 | −100,00 | 0 | |||||
| 2025-08-11 | 13F | VSM Wealth Advisory, LLC | 384 | 0,00 | 9 | 0,00 | ||||
| 2025-08-08 | 13F | Thoroughbred Financial Services, Llc | 41 798 | −24,74 | 1 | −100,00 | ||||
| 2025-08-14 | 13F | Comerica Bank | 4 767 | −1,61 | 111 | −1,79 | ||||
| 2025-08-27 | 13F/A | Brinker Capital Investments, LLC | 80 035 | 2,27 | 1 859 | 2,31 | ||||
| 2025-05-14 | 13F | Susquehanna International Group, Llp | 0 | −100,00 | 0 | |||||
| 2025-07-30 | 13F | Strategic Blueprint, LLC | 49 319 | 460,44 | 1 146 | 461,27 | ||||
| 2025-08-13 | 13F | MONECO Advisors, LLC | 14 099 | 0,00 | 328 | 0,00 | ||||
| 2025-08-14 | 13F | Evergreen Capital Management Llc | 231 997 | 12,39 | 5 389 | 12,43 | ||||
| 2025-08-15 | 13F | Morgan Stanley | 1 525 335 | −25,01 | 35 434 | −24,98 | ||||
| 2025-08-06 | 13F | AE Wealth Management LLC | 33 020 | 1,60 | 767 | 1,72 | ||||
| 2025-08-14 | 13F | Sentinus, LLC | 26 056 | 0,03 | 605 | 0,17 | ||||
| 2025-07-23 | 13F | Madden Advisory Services, Inc. | 25 850 | 12,67 | 600 | 12,78 | ||||
| 2025-08-04 | 13F | Pensionmark Financial Group, Llc | 138 410 | −5,75 | 3 215 | −5,69 | ||||
| 2025-08-12 | 13F | Cowa, Llc | 685 592 | 25,98 | 15 912 | 25,92 | ||||
| 2025-05-14 | 13F | Van Hulzen Asset Management, LLC | 0 | −100,00 | 0 | −100,00 | ||||
| 2025-08-14 | 13F | UBS Group AG | 262 625 | 1,79 | 6 101 | 1,82 | ||||
| 2025-04-10 | 13F | Sugar Maple Asset Management, LLC | 0 | −100,00 | 0 | |||||
| 2025-07-25 | 13F | Commonwealth Financial Services, LLC | 100 262 | −17,58 | 2 329 | −17,53 | ||||
| 2025-08-08 | 13F | Avantax Advisory Services, Inc. | 202 734 | 44,27 | 4 710 | 44,32 | ||||
| 2025-07-16 | 13F | Littlejohn Financial Services, Inc. | 517 294 | 66,17 | 12 017 | 66,24 | ||||
| 2025-08-14 | 13F | Strategic Wealth Designers | 18 | 0 | ||||||
| 2025-08-14 | 13F | Mml Investors Services, Llc | 0 | −100,00 | 0 | |||||
| 2025-07-14 | 13F | GAMMA Investing LLC | 49 389 | −80,19 | 1 147 | −80,18 | ||||
| 2025-08-13 | 13F | Baltimore-Washington Financial Advisors, Inc. | 445 589 | −9,04 | 10 351 | −8,99 | ||||
| 2025-08-06 | 13F | Rialto Wealth Management, LLC | 67 198 | 12,33 | 1 561 | 12,38 | ||||
| 2025-08-11 | 13F | PFG Private Wealth Management, LLC | 0 | −100,00 | 0 | |||||
| 2025-07-25 | 13F | Cwm, Llc | 3 533 | −6,21 | 0 | |||||
| 2025-08-07 | 13F | Kestra Private Wealth Services, Llc | 144 299 | 10,97 | 3 352 | 11,03 | ||||
| 2025-08-13 | 13F | Beacon Pointe Advisors, LLC | 34 274 | −17,63 | 796 | −17,60 | ||||
| 2025-08-14 | 13F | Hrt Financial Lp | 0 | −100,00 | 0 | |||||
| 2025-05-07 | 13F | Vista Private Wealth Partners. LLC | 0 | −100,00 | 0 | |||||
| 2025-08-26 | 13F/A | Thrivent Financial For Lutherans | 0 | −100,00 | 0 | |||||
| 2025-08-11 | 13F | Summit Wealth Partners, LLC | 29 265 | −20,21 | 680 | −20,21 | ||||
| 2025-08-14 | 13F | Jane Street Group, Llc | 0 | −100,00 | 0 | |||||
| 2025-07-16 | 13F | Moisand Fitzgerald Tamayo, LLC | 1 | 0,00 | 0 | |||||
| 2025-07-17 | 13F | Johnson Bixby & Associates, LLC | 14 719 | 2,06 | 342 | 2,10 | ||||
| 2025-07-30 | 13F | Mid-American Wealth Advisory Group, Inc. | 598 347 | 36,55 | 13 900 | 36,61 | ||||
| 2025-07-17 | 13F | Baron Silver Stevens Financial Advisors, Llc | 10 944 | −46,70 | 254 | −46,64 | ||||
| 2025-08-12 | 13F | BlackRock, Inc. | 34 441 | 0,33 | 800 | 0,38 | ||||
| 2025-08-14 | 13F | Wells Fargo & Company/mn | 1 064 628 | 23,99 | 24 731 | 24,04 | ||||
| 2025-08-12 | 13F | Coldstream Capital Management Inc | 0 | −100,00 | 0 | |||||
| 2025-08-05 | 13F | Cherry Tree Wealth Management, LLC | 7 621 | 0,00 | 177 | 0,57 | ||||
| 2025-07-29 | 13F | Werba Rubin Papier Wealth Management | 46 638 | 0,00 | 1 083 | 0,09 | ||||
| 2025-07-29 | 13F | International Assets Investment Management, Llc | 55 710 | 14,50 | 1 294 | 14,61 | ||||
| 2025-07-30 | 13F | Avidian Wealth Solutions, LLC | 12 435 | 289 | ||||||
| 2025-08-12 | 13F | Bedel Financial Consulting, Inc. | 31 575 | 37,55 | 733 | 38,56 | ||||
| 2025-08-14 | 13F | Snowden Capital Advisors LLC | 29 377 | 0,00 | 682 | 0,00 | ||||
| 2025-07-09 | 13F | Krilogy Financial LLC | 72 641 | −2,66 | 1 687 | −2,60 | ||||
| 2025-07-29 | 13F | Straight Path Wealth Management | 99 793 | 12,11 | 2 318 | 12,20 | ||||
| 2025-08-14 | 13F | Integrated Wealth Concepts LLC | 316 269 | 8,25 | 7 347 | 8,28 | ||||
| 2025-08-07 | 13F | PFG Advisors | 69 235 | 1 608 | ||||||
| 2025-07-22 | 13F | Steele Capital Management, Inc. | 37 803 | 0,00 | 878 | 0,11 | ||||
| 2025-08-12 | 13F | Absolute Capital Management, LLC | 61 035 | −4,83 | 1 418 | −4,84 | ||||
| 2025-07-24 | 13F | IFP Advisors, Inc | 54 911 | −20,54 | 1 276 | −20,51 | ||||
| 2025-08-14 | 13F | Colony Group, LLC | 12 832 | 0,00 | 298 | 0,34 | ||||
| 2025-07-23 | 13F | Ironwood Financial, llc | 66 160 | 0,00 | 1 536 | 0,00 | ||||
| 2025-08-12 | 13F | Cornerstone Wealth Management, LLC | 60 020 | 7,53 | 1 394 | 7,56 | ||||
| 2025-08-01 | 13F | Envestnet Asset Management Inc | 126 076 | 25,35 | 2 929 | 25,40 | ||||
| 2025-07-25 | 13F | M3 Advisory Group, LLC | 9 313 | 0,22 | 216 | 0,47 | ||||
| 2025-08-14 | 13F | Stifel Financial Corp | 15 309 | 30,89 | 356 | 31,00 | ||||
| 2025-08-07 | 13F | Nwam Llc | 31 990 | −12,40 | 743 | −12,28 | ||||
| 2025-07-30 | 13F | Phillips Financial Management, Llc | 25 436 | 0,00 | 591 | 0,00 | ||||
| 2025-07-31 | 13F | Keeler THomas Management LLC | 415 775 | 15,57 | 9 658 | 15,62 | ||||
| 2025-07-15 | 13F | MCF Advisors LLC | 29 845 | 41,77 | 693 | 42,01 | ||||
| 2025-07-29 | 13F | Private Trust Co Na | 2 345 | 9,07 | 54 | 10,20 | ||||
| 2025-08-14 | 13F | Mercer Global Advisors Inc /adv | 12 006 | 279 | ||||||
| 2025-08-12 | 13F | Tableaux Llc | 1 363 | 248 | ||||||
| 2025-08-11 | 13F | Private Advisor Group, LLC | 1 117 099 | 9,50 | 25 950 | 9,55 | ||||
| 2025-07-10 | 13F | Wealth Enhancement Advisory Services, Llc | 10 850 | 0,00 | 251 | 0,00 | ||||
| 2025-08-14 | 13F | Old Mission Capital Llc | 373 758 | 2 046,31 | 8 682 | 2 049,01 | ||||
| 2025-08-14 | 13F | Citadel Advisors Llc | 0 | −100,00 | 0 | |||||
| 2025-09-04 | 13F/A | Advisor Group Holdings, Inc. | 209 350 | 1,44 | 4 864 | 1,48 | ||||
| 2025-08-06 | 13F | Prospera Financial Services Inc | 9 067 | 211 | ||||||
| 2025-05-13 | 13F | Claudia M.p. Batlle, Crp (r) Llc | 0 | −100,00 | 0 | |||||
| 2025-08-06 | 13F | Summit Investment Advisors, Inc. | 304 244 | 4,38 | 7 043 | 4,84 | ||||
| 2025-08-14 | 13F | Bank Of America Corp /de/ | 2 146 582 | 2,46 | 49 865 | 2,50 | ||||
| 2025-07-11 | 13F | Quad-Cities Investment Group, LLC | 37 902 | 57,09 | 880 | 57,14 | ||||
| 2025-08-12 | 13F | Boreal Capital Management LLC | 0 | 228 | ||||||
| 2025-05-15 | 13F/A | Orion Portfolio Solutions, LLC | 78 255 | 1 817 | ||||||
| 2025-07-01 | 13F | Private Client Services, Llc | 129 040 | −4,96 | 2 998 | −4,92 | ||||
| 2025-07-17 | 13F | Tempus Wealth Planning, LLC | 209 534 | 11,40 | 4 867 | 11,45 | ||||
| 2025-08-15 | 13F | Scissortail Wealth Management, LLC | 140 803 | −3,43 | 3 271 | −3,40 | ||||
| 2025-08-14 | 13F | Hurley Capital, LLC | 249 860 | 15,78 | 5 804 | 15,85 | ||||
| 2025-06-23 | NP | LDRH - iShares iBonds 1-5 Year High Yield and Income Ladder ETF | 34 327 | 14,29 | 794 | 13,12 | ||||
| 2025-07-16 | 13F | Rebalance, Llc | 43 540 | 1,38 | 1 011 | 1,40 | ||||
| 2025-08-01 | 13F | Austin Private Wealth, LLC | 20 379 | 23,66 | 473 | 23,82 | ||||
| 2025-08-12 | 13F | Steward Partners Investment Advisory, Llc | 14 285 | 6,60 | 332 | 6,43 | ||||
| 2025-08-13 | 13F | Jones Financial Companies Lllp | 0 | −100,00 | 0 | |||||
| 2025-07-28 | 13F | Mutual Advisors, LLC | 271 980 | 3,15 | 6 325 | 3,49 | ||||
| 2025-08-12 | 13F | Proequities, Inc. | 0 | 0 | ||||||
| 2025-08-08 | 13F | Cetera Investment Advisers | 93 990 | 2,56 | 2 183 | 2,63 | ||||
| 2025-08-12 | 13F | Landing Point Financial Group, LLC | 53 070 | 15,60 | 1 233 | 15,68 | ||||
| 2025-08-14 | 13F | Royal Bank Of Canada | 328 597 | 33,01 | 7 633 | 33,07 | ||||
| 2025-08-14 | 13F | EP Wealth Advisors, Inc. | 148 248 | −7,67 | 3 444 | −7,64 | ||||
| 2025-07-25 | 13F | Heartland Bank & Trust Co | 20 321 | 50,06 | 472 | 50,32 | ||||
| 2025-08-15 | 13F | SkyView Investment Advisors, LLC | 149 642 | −29,67 | 3 | −25,00 | ||||
| 2025-08-12 | 13F | BWM Planning, LLC | 20 566 | 1,70 | 478 | 1,71 | ||||
| 2025-08-12 | 13F | LPL Financial LLC | 733 946 | 35,34 | 17 050 | 35,40 | ||||
| 2025-08-13 | 13F | Baird Financial Group, Inc. | 15 294 | −3,64 | 355 | −3,53 | ||||
| 2025-07-25 | 13F | Atria Wealth Solutions, Inc. | 136 632 | 1,61 | 3 174 | 1,63 | ||||
| 2025-07-10 | 13F | Klaas Financial Asset Advisors, LLC | 26 578 | −5,80 | 617 | −5,80 | ||||
| 2025-07-11 | 13F | Windsor Capital Management, LLC | 0 | −100,00 | 0 | |||||
| 2025-08-15 | 13F | Kestra Advisory Services, LLC | 13 223 | 12,05 | 307 | 12,04 | ||||
| 2025-07-29 | 13F | Koshinski Asset Management, Inc. | 22 128 | 514 | ||||||
| 2025-05-05 | 13F | Diversify Advisory Services, LLC | 0 | −100,00 | 0 | |||||
| 2025-08-12 | 13F | Jpmorgan Chase & Co | 142 | −52,67 | 3 | −50,00 | ||||
| 2025-05-02 | 13F | Sigma Planning Corp | 0 | −100,00 | 0 | |||||
| 2025-07-15 | 13F | Sightline Wealth Advisors, LLC | 69 536 | 0,08 | 1 615 | 0,12 | ||||
| 2025-07-21 | 13F | Ameriflex Group, Inc. | 6 734 | 19,46 | 156 | 20,00 | ||||
| 2025-08-04 | 13F | Creative Financial Designs Inc /adv | 5 574 | 129 | ||||||
| 2025-07-24 | 13F | Ronald Blue Trust, Inc. | 3 151 | 0,45 | 73 | 1,39 | ||||
| 2025-07-14 | 13F | Golden State Equity Partners | 37 325 | 0,47 | 867 | 0,58 | ||||
| 2025-08-14 | 13F | Straightline Group Llc | 766 062 | 4,25 | 17 796 | 4,30 | ||||
| 2025-07-23 | 13F | High Note Wealth, LLC | 150 167 | 3 488 | ||||||
| 2025-08-11 | 13F | HighTower Advisors, LLC | 349 866 | 2,54 | 8 127 | 2,59 | ||||
| 2025-07-09 | 13F | Lbmc Investment Advisors, Llc | 854 318 | 13,11 | 19 846 | 13,15 | ||||
| 2025-07-31 | 13F | Cambridge Investment Research Advisors, Inc. | 1 167 957 | 6,99 | 27 | 8,00 | ||||
| 2025-08-14 | 13F | Sunbelt Securities, Inc. | 12 750 | 0,00 | 295 | −0,34 | ||||
| 2025-08-05 | 13F | Summit Investment Advisory Services, LLC | 297 431 | 6 909 | ||||||
| 2025-08-05 | 13F | Bank Of Montreal /can/ | 1 959 | 46 | ||||||
| 2025-07-24 | 13F | Us Bancorp \de\ | 400 | 9 | ||||||
| 2025-07-08 | 13F | Parallel Advisors, LLC | 32 650 | 27,29 | 758 | 27,39 | ||||
| 2025-07-31 | 13F | Orion Capital Management LLC | 11 000 | 52,35 | 256 | 52,69 | ||||
| 2025-08-14 | 13F | Raymond James Financial Inc | 568 962 | 25,49 | 13 217 | 25,54 | ||||
| 2025-07-18 | 13F | Consolidated Portfolio Review Corp | 21 649 | 8,39 | 503 | 8,42 | ||||
| 2025-08-14 | 13F | 10Elms LLP | 10 615 | 0,00 | 247 | 0,00 | ||||
| 2025-07-24 | 13F | Robertson Stephens Wealth Management, LLC | 21 610 | 40,35 | 502 | 40,62 | ||||
| 2025-08-12 | 13F | Timber Creek Capital Management LLC | 38 802 | 12,52 | 899 | 12,25 | ||||
| 2025-07-29 | 13F | Alaska Permanent Capital Management | 10 089 | 0,56 | 234 | 0,43 | ||||
| 2025-08-07 | 13F | New England Private Wealth Advisors LLC | 9 494 | 2,27 | 221 | 2,33 | ||||
| 2025-07-15 | 13F | Carr Financial Group Corp | 83 323 | 17,66 | 1 936 | 17,70 | ||||
| 2025-08-13 | 13F | Northwestern Mutual Wealth Management Co | 798 372 | 0,87 | 18 546 | 0,92 |