Grundläggande statistik
| Institutionella ägare | 292 total, 292 long only, 0 short only, 0 long/short - change of −1,02% MRQ |
| Genomsnittlig portföljallokering | 0.7178 % - change of 8,51% MRQ |
| Institutionella aktier (lång) | 93 711 875 (ex 13D/G) - change of −3,54MM shares −3,64% MRQ |
| Institutionellt värde (lång) | $ 3 418 262 USD ($1000) |
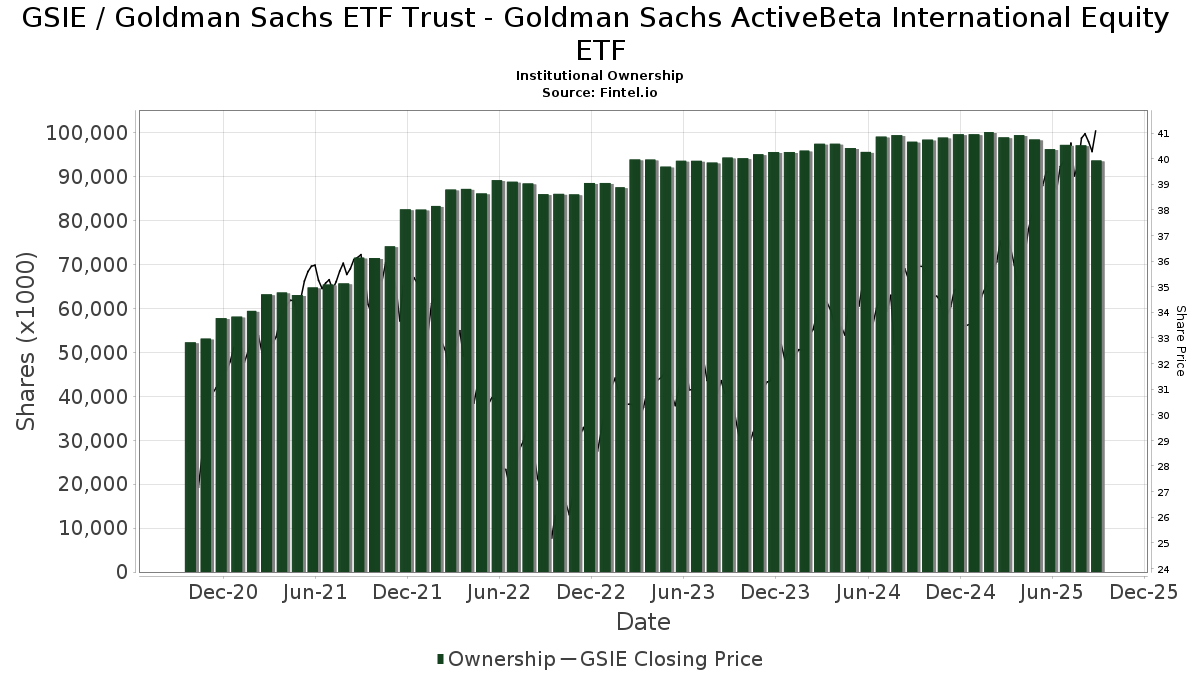
Institutionellt ägande och aktieägare
Goldman Sachs ETF Trust - Goldman Sachs ActiveBeta International Equity ETF (US:GSIE) har 292 Institutionella ägare och aktieägare som har lämnat in 13D/G- eller 13F-formulär till Securities Exchange Commission (SEC). Dessa institut innehar totalt 93,711,875 aktier. Största aktieägare inkluderar Wells Fargo & Company/mn, LPL Financial LLC, Bank Of America Corp /de/, SigFig Wealth Management, LLC, Morgan Stanley, Envestnet Asset Management Inc, Betterment LLC, HB Wealth Management, LLC, Goldman Sachs Group Inc, and Commonwealth Equity Services, Llc .
Goldman Sachs ETF Trust - Goldman Sachs ActiveBeta International Equity ETF (ARCA:GSIE) Institutionell ägarstruktur visar institutioners och fonders nuvarande positioner i företaget, samt de senaste förändringarna i positionernas storlek. Större aktieägare kan vara enskilda investerare, fonder, hedgefonder eller institutioner. Bilaga 13D visar att investeraren äger (eller ägde) mer än 5% av företaget och avser (eller avsåg) att aktivt eftersträva en förändring av affärsstrategin. Schedule 13G indikerar en passiv investering på över 5%.
The share price as of September 16, 2025 is 41,50 / share. Previously, on September 17, 2024, the share price was 35,74 / share. This represents an increase of 16,12% over that period.
Fondsentimentets poäng
Fondsentimentet poängen(fka Ägarackumulation-poäng) visar vilka aktier som är mest köpta av fonder. Det är resultatet av en sofistikerad kvantitativ flerfaktormodell som identifierar företag med de högsta nivåerna av institutionell ackumulering. Poängsättningsmodellen använder en kombination av den totala ökningen av redovisade ägare, förändringarna i portföljallokeringarna för dessa ägare och andra mått. Siffran sträcker sig från 0 till 100, där högre siffror indikerar en högre nivå av ackumulering i förhållande till sina konkurrenter, och 50 är genomsnittet.
Uppdateringsfrekvens: Dagligen
Se Ownership Explorer, som innehåller en lista över de högst rankade företagen.
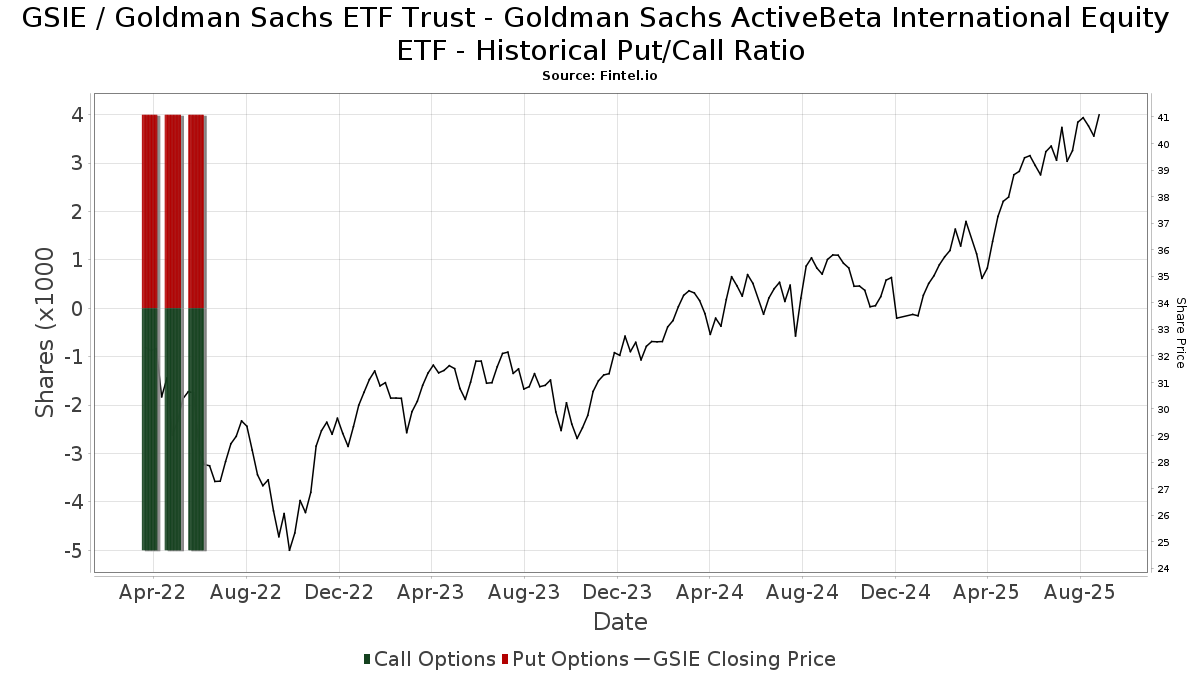
Institutionell sälj/köp-kvot
Förutom att rapportera vanliga eget kapital- och skuldemissioner måste institutioner med mer än 100MM tillgångar under förvaltning också avslöja sina innehav av sälj- och köpoptioner. Eftersom säljoptioner i allmänhet indikerar ett negativt sentiment och köpoptioner indikerar ett positivt sentiment, kan vi få en uppfattning om det övergripande institutionella sentimentet genom att plotta förhållandet mellan säljoptioner och köpoptioner. Diagrammet till höger visar det historiska förhållandet mellan sälj- och köpoptioner för detta instrument.
Genom att använda sälj/köp-kvoten som en indikator på aktieägarnas sentiment undviker man en av de största bristerna med att använda det totala institutionella ägandet, nämligen att en betydande del av de förvaltade tillgångarna investeras passivt för att följa index. Passivt förvaltade fonder köper vanligtvis inte optioner, så indikatorn för sälj/köp-kvoten ger en bättre bild av stämningen i aktivt förvaltade fonder.
13F- och NPORT-arkiveringar
Detaljer om 13F-arkiveringar är gratis. Detaljer om NP-arkiveringar kräver ett premiummedlemskap. Gröna rader indikerar nya positioner. Röda rader indikerar stängda positioner. Klicka på länk symbolen för att se hela transaktionshistoriken.
Uppgradera
för att låsa upp premiumdata och exportera till Excel ![]() .
.
| Fil Datum | Källa | Investerare | Typ | Genomsnittligt pris (beräknat) |
Aktier | Δ Aktier (%) |
Rapporterat värde (1000 USD) |
Δ Värde (%) |
Portföljallokering (%) |
|
|---|---|---|---|---|---|---|---|---|---|---|
| 2025-07-08 | 13F | Richard P Slaughter Associates Inc | 30 347 | −24,54 | 1 204 | −16,05 | ||||
| 2025-07-25 | 13F | Hemington Wealth Management | 381 | 0,00 | 0 | |||||
| 2025-08-13 | 13F | Baird Financial Group, Inc. | 167 146 | −1,10 | 6 629 | 10,02 | ||||
| 2025-04-01 | 13F | Modus Advisors, LLC | 0 | −100,00 | 0 | |||||
| 2025-07-22 | 13F | HFM Investment Advisors, LLC | 347 | 2,66 | 14 | 8,33 | ||||
| 2025-08-12 | 13F | Park Square Financial Group, LLC | 74 | 0,00 | 3 | 0,00 | ||||
| 2025-08-19 | 13F | Anchor Investment Management, LLC | 109 036 | 0,04 | 4 324 | 11,30 | ||||
| 2025-08-13 | 13F | Lido Advisors, LLC | 9 233 | 0,77 | 366 | 12,27 | ||||
| 2025-07-11 | 13F | SILVER OAK SECURITIES, Inc | 26 083 | 0,00 | 1 034 | 10,23 | ||||
| 2025-08-06 | 13F | Atlantic Union Bankshares Corp | 226 | 9 | ||||||
| 2025-08-15 | 13F | First Heartland Consultants, Inc. | 5 812 | −6,21 | 231 | 4,55 | ||||
| 2025-05-07 | 13F | WMS Partners, LLC | 0 | −100,00 | 0 | |||||
| 2025-07-17 | 13F | Dopkins Wealth Management, Llc | 23 386 | −3,44 | 927 | 7,42 | ||||
| 2025-07-29 | 13F | Empirical Asset Management, LLC | 6 094 | −0,62 | 242 | 10,55 | ||||
| 2025-08-05 | 13F | Bank of New York Mellon Corp | 736 998 | −9,12 | 29 229 | 1,11 | ||||
| 2025-07-09 | 13F | Reyes Financial Architecture, Inc. | 123 | 0,00 | 5 | 0,00 | ||||
| 2025-07-17 | 13F | LexAurum Advisors, LLC | 489 704 | 25,23 | 19 422 | 39,31 | ||||
| 2025-08-12 | 13F | Inscription Capital, LLC | 33 889 | −9,40 | 1 344 | 4,84 | ||||
| 2025-07-31 | 13F | Wealthfront Advisers Llc | 10 941 | 25,90 | 434 | 40,13 | ||||
| 2025-08-12 | 13F | Waterloo Capital, L.P. | 12 954 | 2,42 | 514 | 14,00 | ||||
| 2025-07-09 | 13F | Dynamic Advisor Solutions LLC | 66 278 | −25,46 | 2 629 | −17,07 | ||||
| 2025-07-25 | 13F | Cwm, Llc | 310 876 | −2,56 | 12 | 9,09 | ||||
| 2025-07-17 | 13F | HB Wealth Management, LLC | 2 774 891 | −11,17 | 110 052 | −1,18 | ||||
| 2025-07-24 | 13F | Endeavor Private Wealth, Inc. | 13 706 | −14,14 | 544 | −4,57 | ||||
| 2025-08-14 | 13F | Aqr Capital Management Llc | 516 626 | 1,03 | 20 489 | 12,39 | ||||
| 2025-07-09 | 13F | Pallas Capital Advisors LLC | 23 743 | −95,51 | 942 | −95,00 | ||||
| 2025-07-31 | 13F | Cambridge Investment Research Advisors, Inc. | 136 263 | 16,68 | 5 | 25,00 | ||||
| 2025-07-25 | 13F | Concurrent Investment Advisors, LLC | 22 623 | 45,12 | 897 | 61,62 | ||||
| 2025-07-28 | 13F | Lunt Capital Management, Inc. | 25 198 | 0,00 | 999 | 11,25 | ||||
| 2025-07-01 | 13F | Stonehearth Capital Management, LLC | 83 734 | −4,33 | 3 321 | 6,41 | ||||
| 2025-07-14 | 13F | Lee-Kelleher Wealth Management | 30 567 | −1,68 | 1 212 | 9,39 | ||||
| 2025-07-21 | 13F | Ameriflex Group, Inc. | 56 | 0,00 | 2 | 100,00 | ||||
| 2025-08-14 | 13F | First Foundation Advisors | 1 036 921 | 5,89 | 41 124 | 17,80 | ||||
| 2025-07-08 | 13F | Baker Ellis Asset Management LLC | 377 804 | 5,57 | 14 984 | 17,44 | ||||
| 2025-07-30 | 13F | Cullen/frost Bankers, Inc. | 983 | 0,00 | 39 | 8,57 | ||||
| 2025-08-14 | 13F | Integrated Wealth Concepts LLC | 187 378 | 19,50 | 7 431 | 32,93 | ||||
| 2025-08-14 | 13F | Betterment LLC | 3 191 444 | −33,26 | 127 | −25,88 | ||||
| 2025-08-14 | 13F | Glenview Trust Co | 32 862 | 5,68 | 1 303 | 17,60 | ||||
| 2025-08-19 | NP | GAPIX - Goldman Sachs Dynamic Global Equity Fund Institutional | 202 666 | 13,89 | 8 038 | 26,69 | ||||
| 2025-08-14 | 13F | Royal Bank Of Canada | 962 651 | −3,43 | 38 179 | 7,44 | ||||
| 2025-08-14 | 13F | Qube Research & Technologies Ltd | 3 036 | −60,38 | 120 | −56,04 | ||||
| 2025-08-13 | 13F | Cheviot Value Management, LLC | 69 | 0,00 | 3 | 0,00 | ||||
| 2025-07-31 | 13F | CNB Bank | 1 623 | 0,00 | 64 | 12,28 | ||||
| 2025-07-07 | 13F | Thurston, Springer, Miller, Herd & Titak, Inc. | 179 | 231,48 | 7 | 600,00 | ||||
| 2025-07-25 | 13F | Prostatis Group LLC | 46 067 | 101,77 | 1 827 | 124,72 | ||||
| 2025-08-12 | 13F | Fca Corp /tx | 236 669 | 2,34 | 9 386 | 13,85 | ||||
| 2025-07-18 | 13F | Truist Financial Corp | 20 538 | −2,82 | 815 | 8,10 | ||||
| 2025-08-07 | 13F | Brio Consultants, LLC | 959 806 | 3,33 | 38 066 | 14,95 | ||||
| 2025-09-09 | 13F | NWF Advisory Services Inc. | 32 668 | 0,00 | 1 296 | 11,25 | ||||
| 2025-07-29 | 13F | Stephens Inc /ar/ | 64 908 | −0,13 | 2 574 | 11,14 | ||||
| 2025-08-14 | 13F | Stonehaven Wealth & Tax Solutions, Llc | 10 083 | −19,48 | 400 | −10,54 | ||||
| 2025-08-12 | 13F | Vawter Financial, Ltd. | 6 450 | −95,31 | 256 | −94,80 | ||||
| 2025-07-09 | 13F | Goelzer Investment Management, Inc. | 8 953 | 0,00 | 355 | 11,29 | ||||
| 2025-07-15 | 13F | Financial Management Professionals, Inc. | 1 288 458 | 0,35 | 51 100 | 11,63 | ||||
| 2025-08-07 | 13F | Verus Capital Partners, Llc | 9 418 | 4,33 | 374 | 16,20 | ||||
| 2025-07-18 | 13F | PFG Investments, LLC | 20 276 | 1,36 | 804 | 12,76 | ||||
| 2025-08-19 | NP | GOIIX - Goldman Sachs Growth and Income Strategy Portfolio Institutional | 395 959 | 0,00 | 15 704 | 11,25 | ||||
| 2025-08-14 | 13F | LaSalle St. Investment Advisors, LLC | 5 658 | −9,23 | 0 | |||||
| 2025-08-14 | 13F | Susquehanna International Group, Llp | 14 039 | −96,47 | 557 | −96,08 | ||||
| 2025-08-14 | 13F | Two Sigma Securities, Llc | 0 | −100,00 | 0 | |||||
| 2025-08-13 | 13F | Manning & Napier Advisors Llc | 232 107 | −10,72 | 9 205 | −0,68 | ||||
| 2025-07-01 | 13F | Kera Capital Partners, Inc. | 377 170 | 3,47 | 14 959 | 15,11 | ||||
| 2025-08-14 | 13F | LifePlan Investment Advisors, Inc. | 71 126 | 36,30 | 2 821 | 51,61 | ||||
| 2025-07-23 | 13F | West Paces Advisors Inc. | 0 | −100,00 | 0 | |||||
| 2025-08-01 | 13F | Bank of Jackson Hole Trust | 0 | −100,00 | 0 | |||||
| 2025-07-10 | 13F | Tompkins Financial Corp | 2 157 | −10,05 | 86 | 0,00 | ||||
| 2025-08-11 | 13F | Vanguard Group Inc | 5 699 | 1,24 | 226 | 13,00 | ||||
| 2025-04-29 | 13F | Callan Capital, LLC | 700 347 | −3,42 | 24 967 | 3,27 | ||||
| 2025-08-01 | 13F | Strategic Financial Services, Inc, | 949 667 | 7,67 | 37 664 | 19,78 | ||||
| 2025-08-14 | 13F | Ausdal Financial Partners, Inc. | 9 365 | 0,17 | 371 | 11,41 | ||||
| 2025-07-24 | 13F | Mengis Capital Management, Inc. | 289 330 | 1,14 | 11 475 | 12,51 | ||||
| 2025-05-06 | 13F | Proficio Capital Partners LLC | 0 | −100,00 | 0 | −100,00 | ||||
| 2025-07-17 | 13F | Beacon Capital Management, LLC | 269 | 1,13 | 11 | 11,11 | ||||
| 2025-05-15 | 13F | Hrt Financial Lp | 0 | −100,00 | 0 | |||||
| 2025-07-16 | 13F | Perigon Wealth Management, LLC | 18 354 | 29,40 | 728 | 43,96 | ||||
| 2025-08-14 | 13F | Fmr Llc | 38 156 | −0,01 | 1 513 | 11,25 | ||||
| 2025-04-28 | 13F | Great Point Wealth Advisors, LLC | 317 535 | −1,33 | 11 320 | 5,51 | ||||
| 2025-08-19 | 13F | Asset Dedication, LLC | 71 | 3 | ||||||
| 2025-04-15 | 13F | Accurate Wealth Management, LLC | 0 | −100,00 | 0 | −100,00 | ||||
| 2025-08-06 | 13F | Legacy Bridge, LLC | 883 | 0,00 | 35 | 12,90 | ||||
| 2025-08-11 | 13F | Perennial Investment Advisors, LLC | 29 566 | 1,00 | 1 173 | 12,37 | ||||
| 2025-07-08 | 13F | Parallel Advisors, LLC | 608 | −83,75 | 24 | −81,95 | ||||
| 2025-08-04 | 13F | Assetmark, Inc | 7 513 | 79,91 | 298 | 100,68 | ||||
| 2025-04-10 | 13F | Sugar Maple Asset Management, LLC | 0 | −100,00 | 0 | |||||
| 2025-07-17 | 13F | Patton Albertson Miller Group, Llc | 15 299 | 38,40 | 607 | 53,81 | ||||
| 2025-08-12 | 13F | Jpmorgan Chase & Co | 108 298 | 65,87 | 4 295 | 84,57 | ||||
| 2025-09-04 | 13F/A | Advisor Group Holdings, Inc. | 223 161 | −9,40 | 8 855 | 0,82 | ||||
| 2025-08-27 | 13F/A | Brinker Capital Investments, LLC | 108 109 | 5,66 | 4 288 | 17,55 | ||||
| 2025-08-11 | 13F | Private Advisor Group, LLC | 74 884 | −4,20 | 2 970 | 6,57 | ||||
| 2025-08-15 | 13F | Equitable Holdings, Inc. | 107 802 | −45,02 | 4 275 | −38,83 | ||||
| 2025-08-12 | 13F | Global Retirement Partners, LLC | 24 164 | −14,55 | 958 | 1,70 | ||||
| 2025-07-16 | 13F | ORG Partners LLC | 245 | 10 | ||||||
| 2025-08-04 | 13F | Creative Financial Designs Inc /adv | 436 | −39,70 | 17 | −32,00 | ||||
| 2025-07-17 | 13F | White Pine Investment CO | 375 538 | −1,96 | 15 | 7,69 | ||||
| 2025-07-16 | 13F | Cambridge Advisors Inc. | 7 600 | 0,00 | 301 | 11,48 | ||||
| 2025-08-13 | 13F | Maia Wealth LLC | 46 419 | −10,48 | 1 841 | 1,21 | ||||
| 2025-07-07 | 13F | Roxbury Financial LLC | 63 | 1,61 | 2 | 0,00 | ||||
| 2025-07-21 | 13F | Monticello Wealth Management, Llc | 280 672 | −1,85 | 11 131 | 9,19 | ||||
| 2025-08-11 | 13F | Regal Investment Advisors LLC | 101 147 | −2,57 | 4 011 | 8,38 | ||||
| 2025-07-29 | 13F | Signature Estate & Investment Advisors Llc | 28 278 | −77,57 | 1 122 | −75,06 | ||||
| 2025-07-14 | 13F | UMA Financial Services, Inc. | 902 | 0,00 | 36 | 9,38 | ||||
| 2025-07-24 | 13F | IFP Advisors, Inc | 119 325 | 6,08 | 4 732 | 18,00 | ||||
| 2025-07-10 | 13F | Community Trust & Investment Co | 62 327 | 0,00 | 2 472 | 11,26 | ||||
| 2025-08-12 | 13F/A | Cozad Asset Management Inc | 85 235 | 8,34 | 3 380 | 20,54 | ||||
| 2025-07-16 | 13F | Signaturefd, Llc | 44 | 2 | ||||||
| 2025-07-31 | 13F | Brighton Jones Llc | 6 081 | 5,77 | 241 | 18,14 | ||||
| 2025-07-30 | 13F | Syntegra Private Wealth Group, LLC | 49 861 | 43,51 | 1 977 | 59,69 | ||||
| 2025-08-06 | 13F | Stokes Family Office, LLC | 20 038 | −0,15 | 795 | 11,05 | ||||
| 2025-07-24 | 13F | Us Bancorp \de\ | 6 702 | 10,10 | 266 | 22,12 | ||||
| 2025-04-29 | 13F | Hm Payson & Co | 2 143 | 0,00 | 76 | 7,04 | ||||
| 2025-08-13 | 13F | Continuum Advisory, LLC | 0 | −100,00 | 0 | |||||
| 2025-08-06 | 13F | AE Wealth Management LLC | 922 | −18,84 | 37 | −10,00 | ||||
| 2025-08-12 | 13F | MAI Capital Management | 2 200 | −0,72 | 87 | 10,13 | ||||
| 2025-07-07 | 13F | Investors Research Corp | 0 | −100,00 | 0 | |||||
| 2025-08-14 | 13F | Wells Fargo & Company/mn | 21 122 125 | 2,41 | 837 703 | 13,93 | ||||
| 2025-08-11 | 13F | HighTower Advisors, LLC | 330 385 | 46,44 | 13 103 | 62,93 | ||||
| 2025-08-13 | 13F | Northwestern Mutual Wealth Management Co | 713 074 | −1,71 | 28 281 | 9,35 | ||||
| 2025-07-16 | 13F | RWM Asset Management, LLC | 16 130 | 0,00 | 640 | 11,13 | ||||
| 2025-08-05 | 13F | Bank Of Montreal /can/ | 4 975 | 14,34 | 197 | 27,10 | ||||
| 2025-07-16 | 13F | Kathmere Capital Management, LLC | 54 336 | −4,78 | 2 155 | 5,90 | ||||
| 2025-04-10 | 13F | Lmcg Investments, Llc | 0 | −100,00 | 0 | |||||
| 2025-07-30 | 13F | IMG Wealth Management, Inc. | 0 | −100,00 | 0 | |||||
| 2025-07-28 | 13F | IFC Advisors LLC | 134 265 | 0,00 | 5 325 | 11,24 | ||||
| 2025-08-13 | 13F | Renaissance Technologies Llc | 0 | −100,00 | 0 | |||||
| 2025-08-14 | 13F | CoreCap Advisors, LLC | 474 174 | −2,89 | 18 806 | 8,03 | ||||
| 2025-07-22 | 13F | Mascoma Wealth Management LLC | 1 034 | −55,66 | 41 | −50,60 | ||||
| 2025-08-07 | 13F | Resources Investment Advisors, LLC. | 1 010 547 | 6,76 | 40 078 | 18,77 | ||||
| 2025-07-07 | 13F | Kings Path Partners LLC | 234 753 | −8,93 | 9 310 | 1,32 | ||||
| 2025-07-08 | 13F | Atwood & Palmer Inc | 273 743 | −1,93 | 10 857 | 9,09 | ||||
| 2025-07-14 | 13F | Sowell Financial Services LLC | 16 292 | 109,11 | 646 | 133,21 | ||||
| 2025-08-13 | 13F | IAG Wealth Partners, LLC | 627 069 | 8,14 | 24 870 | 20,31 | ||||
| 2025-08-12 | 13F | Insigneo Advisory Services, Llc | 7 956 | 23,35 | 316 | 37,55 | ||||
| 2025-07-28 | 13F | Harbour Investments, Inc. | 5 284 | −11,76 | 210 | −1,88 | ||||
| 2025-08-07 | 13F | Evoke Wealth, Llc | 16 138 | 640 | ||||||
| 2025-08-07 | 13F | Vise Technologies, Inc. | 0 | −100,00 | 0 | |||||
| 2025-08-08 | 13F | Cetera Investment Advisers | 666 978 | −42,79 | 26 452 | −36,36 | ||||
| 2025-08-14 | 13F | Mariner, LLC | 55 319 | −3,38 | 2 194 | 7,45 | ||||
| 2025-07-18 | 13F | Bartlett & Co. Wealth Management Llc | 28 | 0,00 | 1 | |||||
| 2025-08-13 | 13F | Brown Advisory Inc | 6 355 | −50,93 | 252 | −45,34 | ||||
| 2025-07-25 | 13F | Allspring Global Investments Holdings, LLC | 4 | 0,00 | 0 | |||||
| 2025-08-04 | 13F | Spire Wealth Management | 0 | −100,00 | 0 | |||||
| 2025-07-24 | 13F | JNBA Financial Advisors | 509 | 20 | ||||||
| 2025-08-14 | 13F | Ameriprise Financial Inc | 10 705 | −73,91 | 425 | −71,00 | ||||
| 2025-08-14 | 13F | Mml Investors Services, Llc | 19 158 | 20,16 | 1 | |||||
| 2025-07-15 | 13F | Optima Capital Llc | 5 826 | 0,00 | 231 | 11,59 | ||||
| 2025-07-11 | 13F | Farther Finance Advisors, LLC | 7 896 | −47,20 | 313 | −41,39 | ||||
| 2025-07-30 | 13F | Retirement Planning Group | 87 096 | −1,60 | 3 454 | 9,48 | ||||
| 2025-08-14 | 13F | Straightline Group Llc | 662 654 | −0,20 | 26 301 | 11,14 | ||||
| 2025-04-21 | 13F | Nelson, Van Denburg & Campbell Wealth Management Group, LLC | 0 | −100,00 | 0 | |||||
| 2025-08-13 | 13F | SageView Advisory Group, LLC | 92 462 | 0,24 | 3 671 | 11,62 | ||||
| 2025-08-13 | 13F | Russell Investments Group, Ltd. | 1 409 | 0,00 | 56 | 10,00 | ||||
| 2025-07-17 | 13F | Independence Bank of Kentucky | 1 000 | 40 | ||||||
| 2025-08-13 | 13F | M Holdings Securities, Inc. | 0 | −100,00 | 0 | |||||
| 2025-07-09 | 13F | Channel Wealth Llc | 175 205 | 24,86 | 6 949 | 38,90 | ||||
| 2025-07-14 | 13F | Gries Financial Llc | 7 782 | 309 | ||||||
| 2025-08-08 | 13F | Crossmark Global Holdings, Inc. | 30 171 | −1,43 | 1 197 | 9,62 | ||||
| 2025-08-14 | 13F | Palo Alto Wealth Advisors, Llc | 207 879 | 6,34 | 8 244 | 10,69 | ||||
| 2025-08-19 | NP | GGSIX - Goldman Sachs Growth Strategy Portfolio Institutional | 557 846 | 0,00 | 22 124 | 11,25 | ||||
| 2025-07-16 | 13F | John W. Brooker & Co., CPAs | 33 905 | −59,91 | 1 353 | −55,11 | ||||
| 2025-08-14 | 13F | Colony Group, LLC | 6 872 | −0,41 | 273 | 11,02 | ||||
| 2025-07-30 | 13F | Gables Capital Management Inc. | 29 | 0,00 | 1 | 0,00 | ||||
| 2025-07-09 | 13F | High Probability Advisors, LLC | 927 984 | −7,22 | 36 804 | 3,22 | ||||
| 2025-07-25 | 13F | PrairieView Partners, LLC | 306 | 0,00 | 0 | |||||
| 2025-08-11 | 13F | FSA Wealth Management LLC | 130 | 0,78 | 5 | 25,00 | ||||
| 2025-08-13 | 13F | Colonial Trust Co / SC | 175 | −11,17 | 7 | −14,29 | ||||
| 2025-07-01 | 13F | Harbor Investment Advisory, Llc | 1 417 | 0,00 | 56 | 12,00 | ||||
| 2025-07-30 | 13F | Drive Wealth Management, Llc | 74 651 | 2,71 | 2 961 | 14,29 | ||||
| 2025-08-07 | 13F | Hennion & Walsh Asset Management, Inc. | 780 476 | 0,19 | 30 954 | 11,45 | ||||
| 2025-08-14 | 13F | Keebeck Wealth Management, LLC | 103 897 | 4 121 | ||||||
| 2025-07-21 | 13F | Patriot Financial Group Insurance Agency, LLC | 7 366 | −21,77 | 292 | −12,84 | ||||
| 2025-08-05 | 13F | Beckerman Institutional, LLC | 15 714 | −1,03 | 1 | |||||
| 2025-07-22 | 13F | Wealthcare Advisory Partners LLC | 217 451 | 1,94 | 8 624 | 13,41 | ||||
| 2025-07-31 | 13F | Leavell Investment Management, Inc. | 31 620 | 0,56 | 1 254 | 11,86 | ||||
| 2025-08-08 | 13F | Gts Securities Llc | 5 743 | 228 | ||||||
| 2025-08-04 | 13F | Amplius Wealth Advisors, LLC | 27 849 | 0,95 | 1 103 | 12,21 | ||||
| 2025-08-05 | 13F | Key FInancial Inc | 39 | 0,00 | 2 | 0,00 | ||||
| 2025-08-14 | 13F | Stifel Financial Corp | 26 851 | −7,02 | 1 065 | 3,40 | ||||
| 2025-07-29 | 13F | Harbor Asset Planning, Inc. | 76 156 | 3 020 | ||||||
| 2025-08-12 | 13F | Proequities, Inc. | 0 | 0 | ||||||
| 2025-08-13 | 13F | Cerity Partners LLC | 1 313 393 | 6,81 | 52 089 | 18,83 | ||||
| 2025-08-14 | 13F | Citadel Advisors Llc | 272 228 | 233,23 | 10 797 | 270,74 | ||||
| 2025-08-13 | 13F | Strategic Family Wealth Counselors, L.L.C. | 8 112 | 0,15 | 322 | 11,46 | ||||
| 2025-07-28 | 13F | Elmwood Wealth Management, Inc. | 78 874 | −1,13 | 3 128 | 10,02 | ||||
| 2025-07-23 | 13F | Sax Wealth Advisors, Llc | 20 113 | 798 | ||||||
| 2025-08-13 | 13F | Cresset Asset Management, LLC | 0 | −100,00 | 0 | |||||
| 2025-08-07 | 13F | SFE Investment Counsel | 7 904 | −60,44 | 313 | −56,04 | ||||
| 2025-07-22 | 13F | Appleton Partners Inc/ma | 434 855 | 0,18 | 17 | 13,33 | ||||
| 2025-08-11 | 13F | TD Waterhouse Canada Inc. | 2 654 | 105 | ||||||
| 2025-08-11 | 13F | Principal Securities, Inc. | 1 088 092 | −6,00 | 43 154 | 11,82 | ||||
| 2025-08-14 | 13F | Bank Of America Corp /de/ | 4 516 794 | 30,31 | 179 136 | 44,96 | ||||
| 2025-07-25 | 13F | Hazlett, Burt & Watson, Inc. | 146 | 1,39 | 0 | |||||
| 2025-07-21 | 13F | Family CFO Inc | 1 491 | 0,00 | 59 | 11,32 | ||||
| 2025-08-08 | 13F | CFO4Life Group, LLC | 141 903 | 1,14 | 5 628 | 12,52 | ||||
| 2025-07-21 | 13F | Hilltop National Bank | 116 | 0,00 | 5 | 33,33 | ||||
| 2025-07-14 | 13F | Armstrong Advisory Group, Inc | 949 | 0,00 | 38 | 19,35 | ||||
| 2025-07-17 | 13F | Wagner Wealth Management, Llc | 6 708 | 1,28 | 266 | 12,71 | ||||
| 2025-07-17 | 13F | Janney Montgomery Scott LLC | 96 799 | −6,31 | 4 | 0,00 | ||||
| 2025-08-19 | 13F | Advisory Services Network, LLC | 26 484 | 0,00 | 1 033 | 9,43 | ||||
| 2025-05-02 | 13F | Whittier Trust Co Of Nevada Inc | 0 | −100,00 | 0 | |||||
| 2025-08-14 | 13F | Goldman Sachs Group Inc | 1 923 066 | 9,30 | 76 269 | 21,59 | ||||
| 2025-08-12 | 13F | Clearwater Capital Advisors, LLC | 66 681 | −5,08 | 2 645 | 5,59 | ||||
| 2025-08-14 | 13F | Glen Eagle Advisors, LLC | 337 | 0,00 | 13 | 8,33 | ||||
| 2025-08-01 | 13F | Ashton Thomas Private Wealth, LLC | 42 905 | 57,73 | 1 702 | 75,54 | ||||
| 2025-07-07 | 13F | Insight Wealth Strategies, LLC | 681 505 | −7,68 | 27 015 | 2,65 | ||||
| 2025-07-17 | 13F | Fifth Third Securities, Inc. | 15 234 | −0,37 | 604 | 10,83 | ||||
| 2025-08-11 | 13F | Citigroup Inc | 13 807 | −1,05 | 548 | 10,06 | ||||
| 2025-08-08 | 13F | Larson Financial Group LLC | 0 | −100,00 | 0 | |||||
| 2025-08-15 | 13F | Tower Research Capital LLC (TRC) | 12 | 0 | ||||||
| 2025-08-15 | 13F | SkyView Investment Advisors, LLC | 1 027 678 | 7,17 | 41 | 17,65 | ||||
| 2025-08-14 | 13F | Great Valley Advisor Group, Inc. | 5 812 | −55,40 | 231 | −50,43 | ||||
| 2025-07-25 | 13F | Envestnet Portfolio Solutions, Inc. | 446 034 | −3,33 | 17 690 | 7,54 | ||||
| 2025-07-23 | 13F | Winthrop Advisory Group LLC | 122 587 | 13,13 | 4 862 | 25,87 | ||||
| 2025-07-30 | 13F | Avidian Wealth Solutions, LLC | 55 188 | −4,07 | 2 189 | 6,73 | ||||
| 2025-08-11 | 13F | Paul R. Ried Financial Group, LLC | 454 486 | 1,53 | 18 025 | 12,95 | ||||
| 2025-08-15 | 13F | Captrust Financial Advisors | 1 268 124 | 1,30 | 50 294 | 12,69 | ||||
| 2025-07-31 | 13F | Hixon Zuercher, LLC | 554 790 | 1,03 | 22 003 | 12,39 | ||||
| 2025-08-05 | 13F | Trail Ridge Investment Advisors, LLC | 471 733 | −6,20 | 18 407 | 2,67 | ||||
| 2025-07-21 | 13F | Ameritas Advisory Services, LLC | 1 705 | 68 | ||||||
| 2025-08-14 | 13F | Comerica Bank | 52 401 | −14,60 | 2 078 | −4,98 | ||||
| 2025-07-22 | 13F | Coastal Investment Advisors, Inc. | 115 | −48,20 | 5 | −42,86 | ||||
| 2025-07-07 | 13F | Nova Wealth Management, Inc. | 0 | −100,00 | 0 | −100,00 | ||||
| 2025-07-18 | 13F | Naples Global Advisors, Llc | 10 779 | 0,00 | 427 | 11,20 | ||||
| 2025-08-12 | 13F | Waddell & Associates, Llc | 14 192 | 0,00 | 563 | 11,29 | ||||
| 2025-08-14 | 13F | Quantinno Capital Management LP | 123 189 | 30,67 | 4 886 | 45,39 | ||||
| 2025-08-12 | 13F | PKS Advisory Services, LLC | 70 895 | −30,59 | 2 812 | −22,80 | ||||
| 2025-07-11 | 13F/A | Umb Bank N A/mo | 2 803 | −20,05 | 111 | −10,48 | ||||
| 2025-07-18 | 13F | Parsons Capital Management Inc/ri | 23 241 | −4,32 | 922 | 6,47 | ||||
| 2025-08-08 | 13F | Pnc Financial Services Group, Inc. | 1 031 | −23,97 | 41 | −16,67 | ||||
| 2025-07-16 | 13F | EdgeRock Capital LLC | 6 946 | 275 | ||||||
| 2025-08-14 | 13F | Hilltop Holdings Inc. | 27 777 | 3,56 | 1 102 | 15,17 | ||||
| 2025-07-17 | 13F | Emerald Advisors, LLC | 42 953 | 65,86 | 1 704 | 84,51 | ||||
| 2025-08-13 | 13F | Flow Traders U.s. Llc | 0 | −100,00 | 0 | |||||
| 2025-08-14 | 13F | Raymond James Financial Inc | 856 839 | 1,32 | 33 982 | 12,72 | ||||
| 2025-08-05 | 13F | EPG Wealth Management LLC | 0 | −100,00 | 0 | |||||
| 2025-08-14 | 13F | Evergreen Wealth Solutions, LLC | 6 550 | 9,17 | 260 | 21,60 | ||||
| 2025-07-08 | 13F | First National Corp /ma/ /adv | 143 385 | 1,95 | 5 687 | 13,40 | ||||
| 2025-08-11 | 13F | Hexagon Capital Partners LLC | 0 | −100,00 | 0 | |||||
| 2025-08-04 | 13F | Ledyard National Bank | 508 812 | −1,73 | 20 179 | 9,32 | ||||
| 2025-07-23 | 13F | Heck Capital Advisors, LLC | 0 | −100,00 | 0 | |||||
| 2025-08-13 | 13F | GeoWealth Management, LLC | 115 397 | −8,25 | 4 577 | 2,07 | ||||
| 2025-08-14 | 13F | Jane Street Group, Llc | 0 | −100,00 | 0 | |||||
| 2025-07-10 | 13F | Global Financial Private Client, LLC | 0 | −100,00 | 0 | |||||
| 2025-08-07 | 13F | Legacy Advisors, LLC | 0 | −100,00 | 0 | |||||
| 2025-07-31 | 13F | Oak Harbor Wealth Partners, Llc | 25 345 | −2,77 | 1 005 | 8,18 | ||||
| 2025-07-28 | 13F | Morris Financial Concepts, Inc. | 6 827 | −0,64 | 271 | 10,66 | ||||
| 2025-08-12 | 13F | O'shaughnessy Asset Management, Llc | 13 386 | 6,76 | 531 | 18,83 | ||||
| 2025-08-08 | 13F | Creative Planning | 11 851 | 19,13 | 470 | 32,77 | ||||
| 2025-08-14 | 13F | Bnp Paribas Arbitrage, Sa | 0 | −100,00 | 0 | |||||
| 2025-07-30 | 13F | D.a. Davidson & Co. | 0 | −100,00 | 0 | |||||
| 2025-08-13 | 13F | Jones Financial Companies Lllp | 59 797 | 143,72 | 2 366 | 168,25 | ||||
| 2025-08-14 | 13F | 10Elms LLP | 392 | 0,00 | 16 | 15,38 | ||||
| 2025-08-15 | 13F | Kestra Advisory Services, LLC | 8 844 | −54,59 | 351 | −82,06 | ||||
| 2025-08-11 | 13F | Aptus Capital Advisors, LLC | 1 191 | 1,45 | 47 | 14,63 | ||||
| 2025-08-14 | 13F | Shepherd Kaplan Krochuk, Llc | 17 264 | −13,47 | 685 | −3,80 | ||||
| 2025-07-24 | 13F | Cascade Investment Group, Inc. | 7 916 | 0,00 | 314 | 10,99 | ||||
| 2025-08-11 | 13F | Annis Gardner Whiting Capital Advisors, LLC | 29 744 | 33,72 | 1 180 | 48,86 | ||||
| 2025-08-13 | 13F | Serenus Wealth Advisors, LLC | 0 | −100,00 | 0 | |||||
| 2025-07-17 | 13F | Archford Capital Strategies, LLC | 6 087 | −1,76 | 241 | 9,55 | ||||
| 2025-08-12 | 13F | Steward Partners Investment Advisory, Llc | 14 379 | −2,13 | 570 | 8,99 | ||||
| 2025-08-12 | 13F | CIBC Private Wealth Group, LLC | 2 467 | 98 | ||||||
| 2025-07-24 | 13F | Blair William & Co/il | 2 203 | −93,30 | 87 | −92,57 | ||||
| 2025-08-08 | 13F | Hartland & Co., LLC | 5 369 | −1,34 | 213 | 9,84 | ||||
| 2025-08-13 | 13F | EverSource Wealth Advisors, LLC | 220 359 | 2,46 | 8 739 | 13,98 | ||||
| 2025-08-14 | 13F | Wiley Bros.-aintree Capital, Llc | 67 554 | −5,71 | 2 674 | 4,49 | ||||
| 2025-08-15 | 13F | Morgan Stanley | 3 326 554 | 4,35 | 131 931 | 16,09 | ||||
| 2025-07-18 | 13F | Consolidated Portfolio Review Corp | 39 846 | 135,78 | 1 580 | 162,46 | ||||
| 2025-08-15 | 13F | CI Private Wealth, LLC | 982 624 | −3,46 | 38 971 | 7,40 | ||||
| 2025-07-21 | 13F | Quent Capital, LLC | 0 | −100,00 | 0 | |||||
| 2025-07-25 | NP | SRGAX - Stringer Growth Fund Class A Shares | 30 345 | 37,02 | 1 189 | 71,68 | ||||
| 2025-07-24 | 13F | Capital Advisors, Ltd. LLC | 59 831 | 0,34 | 2 | 0,00 | ||||
| 2025-08-06 | 13F | Rialto Wealth Management, LLC | 569 | 0,00 | 23 | 10,00 | ||||
| 2025-07-31 | 13F | Buckingham Strategic Partners | 29 041 | 4,97 | 1 152 | 16,73 | ||||
| 2025-08-06 | 13F | Prospera Financial Services Inc | 0 | −100,00 | 0 | |||||
| 2025-04-25 | 13F | Farmers & Merchants Trust Co of Chambersburg PA | 0 | −100,00 | 0 | |||||
| 2025-07-16 | 13F | Register Financial Advisors LLC | 262 | 1,16 | 10 | 11,11 | ||||
| 2025-07-28 | 13F | Duncker Streett & Co Inc | 436 | 0,00 | 17 | 13,33 | ||||
| 2025-07-29 | 13F | Kelman-Lazarov, Inc. | 957 305 | −0,31 | 37 967 | 10,91 | ||||
| 2025-08-13 | 13F | Texas Capital Bank Wealth Management Services Inc | 30 371 | 22,09 | 1 205 | 35,89 | ||||
| 2025-08-14 | 13F | Strategic Wealth Designers | 0 | −100,00 | 0 | −100,00 | ||||
| 2025-08-14 | 13F/A | Rockefeller Capital Management L.P. | 243 871 | 5,36 | 9 672 | 17,21 | ||||
| 2025-07-18 | 13F | Newman Dignan & Sheerar, Inc. | 176 397 | 3,98 | 6 996 | 15,68 | ||||
| 2025-08-08 | 13F | Horizon Family Wealth, Inc. | 409 575 | 3,40 | 16 244 | 15,04 | ||||
| 2025-08-06 | 13F | Commonwealth Equity Services, Llc | 1 697 165 | 0,87 | 67 | 13,56 | ||||
| 2025-08-12 | 13F | Gladstone Institutional Advisory LLC | 273 933 | 1,48 | 10 864 | 12,90 | ||||
| 2025-07-30 | 13F | Silver Oak Wealth Advisors Services, Llc | 648 111 | 33,47 | 25 704 | 48,48 | ||||
| 2025-08-11 | 13F | Alteri Wealth LLC | 8 463 | 0,17 | 336 | 11,30 | ||||
| 2025-07-24 | 13F | GFG Capital, LLC | 705 257 | −11,99 | 27 970 | −2,09 | ||||
| 2025-08-18 | 13F | Geneos Wealth Management Inc. | 194 | 8 | ||||||
| 2025-08-11 | 13F | NewEdge Wealth, LLC | 9 216 | 6,96 | 369 | 20,20 | ||||
| 2025-07-28 | 13F | Private Wealth Asset Management, LLC | 17 705 | 13,45 | 702 | 26,26 | ||||
| 2025-08-06 | 13F | Golden State Wealth Management, LLC | 1 222 | 1,41 | 48 | 14,29 | ||||
| 2025-07-28 | 13F | Turtle Creek Wealth Advisors, LLC | 18 415 | 0,00 | 730 | 11,28 | ||||
| 2025-08-14 | 13F | Smartleaf Asset Management LLC | 39 899 | −6,94 | 1 579 | 2,33 | ||||
| 2025-08-26 | 13F/A | Thrivent Financial For Lutherans | 15 874 | −95,53 | 1 | −100,00 | ||||
| 2025-08-01 | 13F | SYM FINANCIAL Corp | 5 050 | 200 | ||||||
| 2025-08-14 | 13F | Mercer Global Advisors Inc /adv | 175 854 | −5,65 | 6 974 | 4,97 | ||||
| 2025-07-10 | 13F | Wealth Enhancement Advisory Services, Llc | 171 226 | −22,70 | 6 806 | −13,80 | ||||
| 2025-07-18 | 13F | Marino, Stram & Associates Llc | 8 021 | 7,12 | 318 | 19,55 | ||||
| 2025-07-22 | 13F | Merit Financial Group, LLC | 6 963 | 1,35 | 276 | 13,11 | ||||
| 2025-08-19 | NP | GIPIX - Goldman Sachs Balanced Strategy Portfolio Institutional | 149 586 | 10,90 | 5 933 | 23,38 | ||||
| 2025-08-14 | 13F | Ieq Capital, Llc | 10 916 | 433 | ||||||
| 2025-08-01 | 13F | Envestnet Asset Management Inc | 3 307 425 | 2,95 | 131 172 | 14,53 | ||||
| 2025-08-12 | 13F | LPL Financial LLC | 6 138 152 | 0,25 | 243 439 | 11,53 | ||||
| 2025-07-16 | 13F | American National Bank | 634 663 | −1,10 | 25 171 | 10,03 | ||||
| 2025-07-25 | 13F | LRI Investments, LLC | 10 928 | 433 | ||||||
| 2025-08-14 | 13F | Beaird Harris Wealth Management, LLC | 2 414 | 0,00 | 96 | 10,47 | ||||
| 2025-07-24 | 13F | Edge Financial Advisors LLC | 21 307 | −4,62 | 845 | 6,03 | ||||
| 2025-08-07 | 13F/A | Joseph Group Capital Management | 0 | −100,00 | 0 | |||||
| 2025-08-14 | 13F | UBS Group AG | 994 314 | 0,69 | 39 434 | 12,01 | ||||
| 2025-07-22 | 13F | Beacon Financial Advisory LLC | 8 200 | 325 | ||||||
| 2025-08-07 | 13F | Allworth Financial LP | 2 852 | 0,39 | 113 | 8,65 | ||||
| 2025-07-08 | 13F/A | Salem Investment Counselors Inc | 317 | 0,00 | 13 | 9,09 | ||||
| 2025-05-12 | 13F | Sandy Spring Bank | 226 | 0,00 | 8 | 14,29 | ||||
| 2025-07-25 | 13F | NorthRock Partners, LLC | 2 007 | −4,20 | 80 | 6,76 | ||||
| 2025-08-11 | 13F | Brown Brothers Harriman & Co | 948 | 0,00 | 38 | 12,12 | ||||
| 2025-07-29 | 13F | Private Trust Co Na | 3 513 | −23,33 | 139 | −14,72 | ||||
| 2025-07-17 | 13F | Camelot Portfolios, LLC | 14 455 | 19,31 | 573 | 32,95 | ||||
| 2025-07-21 | 13F | Asset Advisors Investment Management, LLC | 161 207 | 6 393 | ||||||
| 2025-08-13 | 13F | StoneX Group Inc. | 0 | −100,00 | 0 | −100,00 | ||||
| 2025-07-17 | 13F | Worth Financial Advisory Group, LLC | 13 709 | 0,00 | 544 | 11,27 | ||||
| 2025-07-15 | 13F | Cora Capital Advisors Llc | 15 712 | 0,00 | 623 | 11,25 | ||||
| 2025-08-13 | 13F | Capital Analysts, Inc. | 26 | 0 | ||||||
| 2025-04-23 | 13F | Mascagni Wealth Management, Inc. | 0 | −100,00 | 0 | −100,00 | ||||
| 2025-08-14 | 13F | IHT Wealth Management, LLC | 5 208 | 207 | ||||||
| 2025-07-25 | 13F | Atria Wealth Solutions, Inc. | 49 892 | −56,21 | 1 979 | −51,29 | ||||
| 2025-07-18 | 13F | SigFig Wealth Management, LLC | 4 494 944 | −1,23 | 177 865 | 8,63 | ||||
| 2025-08-13 | 13F | Townsquare Capital Llc | 5 972 | −93,53 | 237 | −92,82 | ||||
| 2025-07-08 | 13F | Nbc Securities, Inc. | 7 316 | 17,43 | 0 | |||||
| 2025-08-14 | 13F | GWM Advisors LLC | 103 215 | −0,49 | 4 094 | 10,71 | ||||
| 2025-05-15 | 13F/A | Orion Portfolio Solutions, LLC | 102 322 | −0,40 | 3 648 | 6,48 | ||||
| 2025-08-06 | 13F | Round Rock Advisors, LLC | 8 988 | −6,64 | 356 | 3,79 | ||||
| 2025-07-28 | 13F | BRYN MAWR TRUST Co | 4 055 | 0,00 | 161 | 11,11 |
Other Listings
| MX:GSIE |