Grundläggande statistik
| Institutionella ägare | 239 total, 232 long only, 0 short only, 7 long/short - change of 21,94% MRQ |
| Genomsnittlig portföljallokering | 0.3992 % - change of −9,44% MRQ |
| Institutionella aktier (lång) | 21 312 403 (ex 13D/G) - change of −0,93MM shares −4,16% MRQ |
| Institutionellt värde (lång) | $ 1 256 566 USD ($1000) |
Institutionellt ägande och aktieägare
iShares, Inc. - iShares MSCI Mexico ETF (US:EWW) har 239 Institutionella ägare och aktieägare som har lämnat in 13D/G- eller 13F-formulär till Securities Exchange Commission (SEC). Dessa institut innehar totalt 21,312,403 aktier. Största aktieägare inkluderar M&G Plc, Goldman Sachs Group Inc, UBS Group AG, Morgan Stanley, Hsbc Holdings Plc, Jpmorgan Chase & Co, LPL Financial LLC, TTIFX - Goldman Sachs Tactical Tilt Overlay Fund Institutional Shares, Jane Street Group, Llc, and Royal Bank Of Canada .
iShares, Inc. - iShares MSCI Mexico ETF (ARCA:EWW) Institutionell ägarstruktur visar institutioners och fonders nuvarande positioner i företaget, samt de senaste förändringarna i positionernas storlek. Större aktieägare kan vara enskilda investerare, fonder, hedgefonder eller institutioner. Bilaga 13D visar att investeraren äger (eller ägde) mer än 5% av företaget och avser (eller avsåg) att aktivt eftersträva en förändring av affärsstrategin. Schedule 13G indikerar en passiv investering på över 5%.
The share price as of September 15, 2025 is 66,78 / share. Previously, on September 16, 2024, the share price was 54,56 / share. This represents an increase of 22,40% over that period.

Fondsentimentets poäng
Fondsentimentet poängen(fka Ägarackumulation-poäng) visar vilka aktier som är mest köpta av fonder. Det är resultatet av en sofistikerad kvantitativ flerfaktormodell som identifierar företag med de högsta nivåerna av institutionell ackumulering. Poängsättningsmodellen använder en kombination av den totala ökningen av redovisade ägare, förändringarna i portföljallokeringarna för dessa ägare och andra mått. Siffran sträcker sig från 0 till 100, där högre siffror indikerar en högre nivå av ackumulering i förhållande till sina konkurrenter, och 50 är genomsnittet.
Uppdateringsfrekvens: Dagligen
Se Ownership Explorer, som innehåller en lista över de högst rankade företagen.
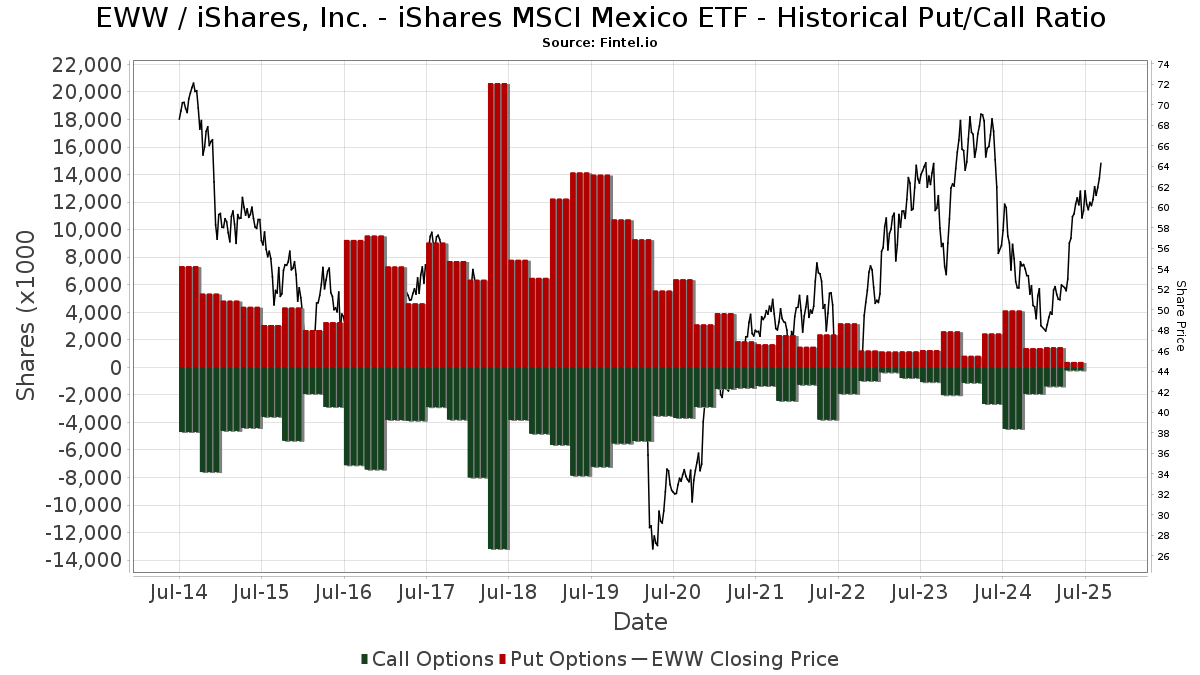
Institutionell sälj/köp-kvot
Förutom att rapportera vanliga eget kapital- och skuldemissioner måste institutioner med mer än 100MM tillgångar under förvaltning också avslöja sina innehav av sälj- och köpoptioner. Eftersom säljoptioner i allmänhet indikerar ett negativt sentiment och köpoptioner indikerar ett positivt sentiment, kan vi få en uppfattning om det övergripande institutionella sentimentet genom att plotta förhållandet mellan säljoptioner och köpoptioner. Diagrammet till höger visar det historiska förhållandet mellan sälj- och köpoptioner för detta instrument.
Genom att använda sälj/köp-kvoten som en indikator på aktieägarnas sentiment undviker man en av de största bristerna med att använda det totala institutionella ägandet, nämligen att en betydande del av de förvaltade tillgångarna investeras passivt för att följa index. Passivt förvaltade fonder köper vanligtvis inte optioner, så indikatorn för sälj/köp-kvoten ger en bättre bild av stämningen i aktivt förvaltade fonder.
13F- och NPORT-arkiveringar
Detaljer om 13F-arkiveringar är gratis. Detaljer om NP-arkiveringar kräver ett premiummedlemskap. Gröna rader indikerar nya positioner. Röda rader indikerar stängda positioner. Klicka på länk symbolen för att se hela transaktionshistoriken.
Uppgradera
för att låsa upp premiumdata och exportera till Excel ![]() .
.
| Fil Datum | Källa | Investerare | Typ | Genomsnittligt pris (beräknat) |
Aktier | Δ Aktier (%) |
Rapporterat värde (1000 USD) |
Δ Värde (%) |
Portföljallokering (%) |
|
|---|---|---|---|---|---|---|---|---|---|---|
| 2025-08-12 | 13F | MAI Capital Management | 56 | 9,80 | 3 | 50,00 | ||||
| 2025-08-12 | 13F | Zacks Investment Management | 9 914 | −1,40 | 600 | 17,19 | ||||
| 2025-08-07 | 13F | David R. Rahn & Associates Inc. | 14 535 | 880 | ||||||
| 2025-08-14 | 13F | Millennium Management Llc | 0 | −100,00 | 0 | |||||
| 2025-08-13 | 13F | Custom Index Systems, Llc | 4 325 | 262 | ||||||
| 2025-08-14 | 13F | Private Wealth Advisors, LLC | 72 021 | 1,50 | 4 362 | 20,60 | ||||
| 2025-07-24 | 13F | Us Bancorp \de\ | 1 066 | 0,09 | 65 | 18,52 | ||||
| 2025-08-13 | 13F | Flow Traders U.s. Llc | 20 806 | 1 | ||||||
| 2025-08-14 | 13F | Raymond James Financial Inc | 75 435 | 16,66 | 4 568 | 38,63 | ||||
| 2025-04-23 | 13F | Bessemer Group Inc | 0 | −100,00 | 0 | |||||
| 2025-04-08 | 13F | Pacifica Partners Inc. | 0 | −100,00 | 0 | −100,00 | ||||
| 2025-07-10 | 13F | Wealth Enhancement Advisory Services, Llc | 11 391 | 51,64 | 703 | 83,77 | ||||
| 2025-07-23 | 13F | Viewpoint Capital Management LLC | 500 | 30 | ||||||
| 2025-07-29 | 13F | Tradewinds Capital Management, LLC | 14 406 | −20,75 | 872 | −5,83 | ||||
| 2025-08-11 | 13F | Trium Capital LLP | 133 373 | 8 077 | ||||||
| 2025-08-14 | 13F | Financial Advisory Service, Inc. | 810 | 0,00 | 49 | 19,51 | ||||
| 2025-08-14 | 13F | Graham Capital Management, L.P. | 0 | −100,00 | 0 | |||||
| 2025-08-14 | 13F/A | Barclays Plc | 76 135 | 5,81 | 5 | 33,33 | ||||
| 2025-08-13 | 13F | Northwestern Mutual Wealth Management Co | 24 069 | 7,90 | 1 458 | 28,26 | ||||
| 2025-08-14 | 13F | Old Mission Capital Llc | 0 | −100,00 | 0 | |||||
| 2025-07-23 | 13F | Spectrum Asset Management, Inc. (NB/CA) | 38 536 | 2 334 | ||||||
| 2025-08-14 | 13F | Hilltop Holdings Inc. | 7 968 | 483 | ||||||
| 2025-05-14 | 13F | Rockefeller Capital Management L.P. | 0 | −100,00 | 0 | |||||
| 2025-08-14 | 13F | Schonfeld Strategic Advisors LLC | 4 843 | 10,32 | 293 | 31,39 | ||||
| 2025-08-13 | 13F | VestGen Advisors, LLC | 3 348 | 203 | ||||||
| 2025-07-22 | NP | TIGGX - Goldman Sachs Tax-Advantaged Global Equity Portfolio Institutional | 79 716 | 0,00 | 4 797 | 19,10 | ||||
| 2025-07-10 | 13F | Exchange Traded Concepts, Llc | 1 048 | −56,15 | 63 | −47,93 | ||||
| 2025-07-25 | 13F | Northwest Capital Management Inc | 245 | 2,08 | 15 | 16,67 | ||||
| 2025-08-14 | 13F | Federation des caisses Desjardins du Quebec | 2 756 | −41,21 | 167 | −30,25 | ||||
| 2025-08-11 | 13F | One Capital Management, LLC | 26 892 | 1 629 | ||||||
| 2025-08-29 | NP | CGHIX - Timber Point Global Allocations Fund Institutional Class Shares | 6 000 | 100,00 | 363 | 138,82 | ||||
| 2025-08-14 | 13F | DZ BANK AG Deutsche Zentral Genossenschafts Bank, Frankfurt am Main | 3 242 | 196 | ||||||
| 2025-07-29 | 13F | Creekside Partners | 6 381 | 0,00 | 386 | 18,77 | ||||
| 2025-06-27 | NP | MEXX - Direxion Daily MSCI Mexico Bull 3X Shares | 226 517 | 24,17 | 12 905 | 44,44 | ||||
| 2025-08-14 | 13F | Manufacturers Life Insurance Company, The | 455 829 | 27 605 | ||||||
| 2025-08-01 | 13F | Twin Lakes Capital Management, LLC | 1 834 | 1,89 | 111 | 21,98 | ||||
| 2025-07-10 | 13F | Clare Market Investments LLC | 0 | −100,00 | 0 | |||||
| 2025-07-31 | 13F | Catalyst Capital Advisors LLC | 338 993 | −17,78 | 20 529 | −2,30 | ||||
| 2025-08-14 | 13F | GWM Advisors LLC | 138 | 8 | ||||||
| 2025-07-21 | 13F | Ping Capital Management, Inc. | 71 800 | 205,53 | 4 348 | 263,24 | ||||
| 2025-08-12 | 13F | Waterloo Capital, L.P. | 5 368 | 325 | ||||||
| 2025-08-12 | 13F | Picton Mahoney Asset Management | 38 659 | 49,21 | 2 | 100,00 | ||||
| 2025-08-14 | 13F | Royal Bank Of Canada | 482 209 | 12,62 | 29 203 | 33,84 | ||||
| 2025-08-07 | 13F | Zurcher Kantonalbank (Zurich Cantonalbank) | 7 350 | 0,44 | 444 | 17,20 | ||||
| 2025-08-12 | 13F | LPL Financial LLC | 879 175 | 2 995,58 | 53 243 | 3 579,47 | ||||
| 2025-08-13 | 13F | Provida Pension Fund Administrator | 0 | −100,00 | 0 | −100,00 | ||||
| 2025-08-11 | 13F | HighTower Advisors, LLC | 26 662 | 230,10 | 1 615 | 292,70 | ||||
| 2025-05-15 | 13F | Activest Wealth Management | 0 | −100,00 | 0 | −100,00 | ||||
| 2025-08-13 | 13F | Providence Capital Advisors, LLC | 11 988 | −8,88 | 726 | 8,36 | ||||
| 2025-08-07 | 13F | Guidance Capital, Inc | 6 672 | 8,45 | 398 | 13,43 | ||||
| 2025-08-13 | 13F | Raab & Moskowitz Asset Management LLC | 8 901 | −2,34 | 539 | 16,16 | ||||
| 2025-05-13 | 13F | FineMark National Bank & Trust | 0 | −100,00 | 0 | |||||
| 2025-04-10 | 13F | Bremer Bank National Association | 180 407 | 0,00 | 9 194 | 8,84 | ||||
| 2025-08-07 | 13F/A | Tortoise Investment Management, LLC | Put | 0 | −100,00 | 0 | −100,00 | |||
| 2025-08-13 | 13F | ExodusPoint Capital Management, LP | 0 | −100,00 | 0 | |||||
| 2025-08-11 | 13F | Aptus Capital Advisors, LLC | 10 | 0,00 | 1 | |||||
| 2025-08-11 | 13F | Hexagon Capital Partners LLC | 0 | −100,00 | 0 | |||||
| 2025-08-14 | 13F | Whitebox Advisors Llc | 31 750 | 1 923 | ||||||
| 2025-08-14 | 13F | D. E. Shaw & Co., Inc. | 109 183 | 6 612 | ||||||
| 2025-08-14 | 13F | Sycale Advisors (NY) LLC | 136 500 | 13,28 | 8 266 | 34,63 | ||||
| 2025-08-14 | 13F | Stifel Financial Corp | 64 710 | 1,33 | 3 919 | 20,41 | ||||
| 2025-08-04 | 13F | Carret Asset Management, Llc | 5 329 | 1,37 | 323 | 20,60 | ||||
| 2025-08-19 | NP | GIPIX - Goldman Sachs Balanced Strategy Portfolio Institutional | 2 526 | 0,00 | 153 | 18,75 | ||||
| 2025-08-08 | 13F | Banco Bilbao Vizcaya Argentaria, S.a. | 17 665 | 32,22 | 1 071 | 57,82 | ||||
| 2025-08-14 | 13F | Mpwm Advisory Solutions, Llc | 0 | −100,00 | 0 | |||||
| 2025-08-14 | 13F | Fmr Llc | 41 179 | −22,07 | 2 494 | −7,39 | ||||
| 2025-08-14 | 13F | Balyasny Asset Management Llc | 22 460 | −78,00 | 1 360 | −73,86 | ||||
| 2025-08-08 | 13F | Allianz Se | 2 232 | 0,00 | 135 | 19,47 | ||||
| 2025-07-24 | 13F | Blair William & Co/il | 1 673 | −33,00 | 101 | −20,47 | ||||
| 2025-08-14 | 13F | Ameriprise Financial Inc | 82 376 | 72,15 | 4 989 | 104,59 | ||||
| 2025-08-08 | 13F | SBI Securities Co., Ltd. | 46 433 | 301,50 | 2 812 | 377,25 | ||||
| 2025-07-28 | 13F | Harbour Investments, Inc. | 70 | 0,00 | 4 | 33,33 | ||||
| 2025-08-12 | 13F | Ci Investments Inc. | 0 | −100,00 | 0 | |||||
| 2025-08-14 | 13F | Aspen Grove Capital, LLC | 129 336 | 0,62 | 7 833 | 19,57 | ||||
| 2025-08-14 | 13F | Colony Group, LLC | 3 806 | 230 | ||||||
| 2025-07-16 | 13F | Banque Pictet & Cie Sa | 25 000 | 0,00 | 1 514 | 18,84 | ||||
| 2025-07-28 | 13F | Twin Tree Management, LP | 0 | −100,00 | 0 | |||||
| 2025-08-12 | 13F | O'shaughnessy Asset Management, Llc | 1 074 | 0,00 | 65 | 20,37 | ||||
| 2025-05-13 | 13F | Neuberger Berman Group LLC | 0 | −100,00 | 0 | −100,00 | ||||
| 2025-08-11 | 13F | SFI Advisors, LLC | 14 841 | −27,71 | 899 | −14,15 | ||||
| 2025-08-18 | 13F | Hollencrest Capital Management | 13 660 | 0,00 | 827 | 18,82 | ||||
| 2025-08-14 | 13F | DRW Securities, LLC | 40 114 | 89,22 | 2 434 | 125,37 | ||||
| 2025-08-01 | 13F | Y-Intercept (Hong Kong) Ltd | 3 382 | 205 | ||||||
| 2025-08-14 | 13F | Discovery Capital Management, Llc / Ct | 29 050 | 1 759 | ||||||
| 2025-08-12 | 13F | Stevens Capital Management Lp | 5 772 | 0 | ||||||
| 2025-08-04 | 13F | Spire Wealth Management | 9 488 | 9,79 | 575 | 30,45 | ||||
| 2025-07-21 | 13F | Mirae Asset Global Investments Co., Ltd. | 3 100 | −26,19 | 188 | −13,43 | ||||
| 2025-07-25 | 13F | Apollon Wealth Management, LLC | 7 559 | 458 | ||||||
| 2025-07-28 | 13F | BRYN MAWR TRUST Co | 3 208 | −22,53 | 194 | −8,06 | ||||
| 2025-08-05 | 13F | Mma Asset Management Llc | 25 416 | 1 539 | ||||||
| 2025-08-13 | 13F | Lido Advisors, LLC | 7 202 | 436 | ||||||
| 2025-08-14 | 13F | Wetherby Asset Management Inc | 5 860 | 0,00 | 355 | 29,20 | ||||
| 2025-07-28 | 13F | Credit Industriel Et Commercial | 0 | −100,00 | 0 | |||||
| 2025-08-06 | 13F | Pekin Hardy Strauss, Inc. | 78 586 | 51,00 | 4 759 | 79,45 | ||||
| 2025-07-28 | 13F | Credit Industriel Et Commercial | Put | 0 | −100,00 | 0 | ||||
| 2025-08-12 | 13F | XTX Topco Ltd | 0 | −100,00 | 0 | |||||
| 2025-07-08 | 13F | Nbc Securities, Inc. | 218 | 0 | ||||||
| 2025-08-08 | 13F | SG Americas Securities, LLC | 286 750 | 929,70 | 17 | 1 600,00 | ||||
| 2025-08-08 | 13F | Cetera Investment Advisers | 27 202 | 1 647 | ||||||
| 2025-08-14 | 13F | Smartleaf Asset Management LLC | 120 | 25,00 | 7 | 75,00 | ||||
| 2025-08-14 | 13F | Susquehanna International Group, Llp | 288 775 | 88,58 | 17 488 | 124,12 | ||||
| 2025-08-13 | 13F | Sun Life Financial Inc | 18 825 | 36,66 | 1 | |||||
| 2025-08-14 | 13F | Schonfeld Strategic Advisors LLC | Call | 0 | −100,00 | 0 | −100,00 | |||
| 2025-05-14 | 13F | Van Hulzen Asset Management, LLC | 0 | −100,00 | 0 | |||||
| 2025-08-14 | 13F | Susquehanna International Group, Llp | Call | 43 600 | −2,68 | 2 640 | 15,64 | |||
| 2025-08-14 | 13F | Susquehanna International Group, Llp | Put | 172 500 | 53,06 | 10 447 | 81,89 | |||
| 2025-07-29 | 13F | Millburn Ridgefield Corp | 338 993 | −17,78 | 20 529 | −2,30 | ||||
| 2025-08-13 | 13F | Baker Avenue Asset Management, LP | 352 648 | 10,29 | 21 356 | 31,07 | ||||
| 2025-07-31 | 13F | Wealthfront Advisers Llc | 9 956 | −3,58 | 603 | 14,45 | ||||
| 2025-08-12 | 13F | Atlas Capital Advisors Llc | 914 | −0,33 | 55 | 19,57 | ||||
| 2025-08-15 | 13F | Equitable Holdings, Inc. | 13 990 | −14,32 | 847 | 1,80 | ||||
| 2025-08-15 | 13F | Kestra Advisory Services, LLC | 3 676 | 223 | ||||||
| 2025-05-15 | 13F | Bank Of America Corp /de/ | Put | 0 | −100,00 | 0 | −100,00 | |||
| 2025-08-27 | 13F/A | Brinker Capital Investments, LLC | 4 217 | 6,14 | 255 | 26,24 | ||||
| 2025-05-15 | 13F | Black Maple Capital Management LP | 0 | −100,00 | 0 | |||||
| 2025-08-13 | 13F | Bank Of Nova Scotia | 14 363 | 26,70 | 870 | 50,61 | ||||
| 2025-08-12 | 13F | Clear Street Markets Llc | 5 000 | 303 | ||||||
| 2025-08-14 | 13F | Bnp Paribas Arbitrage, Sa | 70 941 | −72,99 | 4 296 | −67,90 | ||||
| 2025-08-19 | 13F | Advisory Services Network, LLC | 4 611 | −2,78 | 277 | 14,94 | ||||
| 2025-07-29 | NP | BLUIX - BLUEPRINT GROWTH FUND Institutional Class | 13 069 | 58,07 | 786 | 88,49 | ||||
| 2025-07-29 | 13F | JTC Employer Solutions Trusteee Ltd | 275 | 0,00 | 0 | |||||
| 2025-08-14 | 13F | Tudor Investment Corp Et Al | 13 172 | 798 | ||||||
| 2025-08-14 | 13F | Bank Of America Corp /de/ | Call | 0 | −100,00 | 0 | −100,00 | |||
| 2025-08-13 | 13F | Bridgewater Associates, LP | 112 044 | 57,55 | 6 785 | 87,22 | ||||
| 2025-04-23 | 13F | Golden State Wealth Management, LLC | 0 | −100,00 | 0 | |||||
| 2025-08-19 | NP | GOIIX - Goldman Sachs Growth and Income Strategy Portfolio Institutional | 3 887 | 0,00 | 235 | 18,69 | ||||
| 2025-08-12 | 13F | Jpmorgan Chase & Co | 1 136 385 | −2,49 | 68 820 | 15,88 | ||||
| 2025-08-14 | 13F | Citadel Advisors Llc | 34 480 | 4 735,90 | 2 088 | 5 700,00 | ||||
| 2025-07-21 | NP | TTIFX - Goldman Sachs Tactical Tilt Overlay Fund Institutional Shares | 864 052 | 0,00 | 51 990 | 19,10 | ||||
| 2025-08-28 | 13F/A | Lavaca Capital Llc | 811 | −12,70 | 49 | 4,26 | ||||
| 2025-08-13 | 13F | Edgestream Partners, L.P. | 3 407 | 206 | ||||||
| 2025-08-08 | 13F | Pnc Financial Services Group, Inc. | 900 | 0,00 | 55 | 20,00 | ||||
| 2025-08-29 | NP | MBXAX - Catalyst/Millburn Hedge Strategy Fund Class A | 338 993 | −17,78 | 20 529 | −2,30 | ||||
| 2025-03-25 | 13F | Arrow Investment Advisors, LLC | 0 | −100,00 | 0 | |||||
| 2025-07-29 | 13F | Private Trust Co Na | 741 | 45 | ||||||
| 2025-08-27 | 13F/A | Squarepoint Ops LLC | Call | 3 700 | 224 | |||||
| 2025-08-06 | 13F | Innealta Capital, Llc | 20 581 | 1 246 | ||||||
| 2025-05-15 | 13F | State Of Wisconsin Investment Board | 0 | −100,00 | 0 | |||||
| 2025-08-14 | 13F | Comerica Bank | 9 512 | 42,46 | 576 | 69,41 | ||||
| 2025-08-29 | 13F | Centaurus Financial, Inc. | 2 348 | 0,00 | 0 | |||||
| 2025-08-12 | 13F | CIBC Private Wealth Group, LLC | 1 393 | 1,60 | 84 | 29,23 | ||||
| 2025-08-18 | 13F | Hollencrest Capital Management | Call | 0 | −100,00 | 0 | −100,00 | |||
| 2025-08-11 | 13F | HighTower Advisors, LLC | Call | 0 | −100,00 | 0 | ||||
| 2025-08-11 | 13F | Citigroup Inc | 202 931 | −9,99 | 12 289 | 6,96 | ||||
| 2025-08-11 | 13F | Principal Securities, Inc. | 200 | −88,40 | 12 | −85,00 | ||||
| 2025-08-05 | 13F | Gould Asset Management Llc /ca/ | 7 610 | 1,81 | 461 | 21,05 | ||||
| 2025-08-13 | 13F | Amundi | 211 886 | −20,25 | 13 050 | −9,48 | ||||
| 2025-08-14 | 13F | Two Sigma Securities, Llc | 11 610 | 703 | ||||||
| 2025-08-11 | 13F | HighTower Advisors, LLC | Put | 0 | −100,00 | 0 | ||||
| 2025-08-15 | 13F | Captrust Financial Advisors | 4 104 | 3,77 | 249 | 23,38 | ||||
| 2025-08-14 | 13F | Sona Asset Management (us) Llc | 40 000 | 2 422 | ||||||
| 2025-08-14 | 13F | Arizona PSPRS Trust | 0 | −100,00 | 0 | −100,00 | ||||
| 2025-08-28 | NP | DMCY - DEMOCRACY INTERNATIONAL FUND Shares | 455 | 0,00 | 28 | 17,39 | ||||
| 2025-07-22 | 13F | Global Assets Advisory, LLC | 14 652 | −54,35 | 896 | −44,96 | ||||
| 2025-07-28 | 13F | Mowery & Schoenfeld Wealth Management, LLC | 66 | 0,00 | 4 | 0,00 | ||||
| 2025-08-11 | 13F | Strategic Wealth Partners, Ltd. | 1 728 | 105 | ||||||
| 2025-08-14 | 13F | Bank Of America Corp /de/ | 182 515 | −61,00 | 11 053 | −53,65 | ||||
| 2025-07-23 | 13F | Columbus Macro, LLC | 19 960 | 1 209 | ||||||
| 2025-08-11 | 13F | Kazazian Asset Management, LLC | 0 | −100,00 | 0 | |||||
| 2025-07-14 | 13F | Cobblestone Asset Management LLC | 10 057 | 609 | ||||||
| 2025-08-26 | NP | EQ ADVISORS TRUST - EQ/International Core Managed Volatility Portfolio Class IB | 4 548 | −37,25 | 275 | −25,47 | ||||
| 2025-08-14 | 13F | Wellington Management Group Llp | 50 287 | −7,03 | 3 045 | 10,49 | ||||
| 2025-08-19 | 13F | Anchor Investment Management, LLC | 447 | 0,00 | 27 | 22,73 | ||||
| 2025-08-08 | 13F | Cercano Management LLC | 239 617 | 14 511 | ||||||
| 2025-08-28 | NP | Northern Lights Fund Trust - Ocean Park International ETF | 1 048 | −56,15 | 63 | −47,93 | ||||
| 2025-08-06 | 13F | AE Wealth Management LLC | 23 | 0,00 | 1 | 0,00 | ||||
| 2025-08-27 | NP | XNAV - FundX Aggressive ETF | 17 050 | 1 033 | ||||||
| 2025-08-08 | 13F | NAN FUNG TRINITY (HK) Ltd | 406 200 | −38,93 | 24 599 | −27,42 | ||||
| 2025-08-13 | 13F | Scotia Capital Inc. | 3 658 | 222 | ||||||
| 2025-08-14 | 13F | UBS Group AG | Call | 0 | −100,00 | 0 | −100,00 | |||
| 2025-08-13 | 13F | Loomis Sayles & Co L P | 89 600 | 5 426 | ||||||
| 2025-05-15 | 13F | BLKBRD Asset Management, LP | 0 | −100,00 | 0 | |||||
| 2025-07-24 | 13F | Summit Place Financial Advisors, LLC | 17 920 | 6,38 | 1 085 | 26,46 | ||||
| 2025-08-13 | 13F | Korea Investment CORP | 388 217 | 0,00 | 23 510 | 18,84 | ||||
| 2025-08-14 | 13F | Quantitative Investment Management, LLC | 14 339 | 1 | ||||||
| 2025-08-13 | 13F | Kayne Anderson Rudnick Investment Management Llc | 1 110 | 0,00 | 67 | 19,64 | ||||
| 2025-05-14 | 13F | Compass Rose Asset Management, LP | 0 | −100,00 | 0 | |||||
| 2025-08-11 | 13F | TD Waterhouse Canada Inc. | 0 | −100,00 | 0 | |||||
| 2025-07-22 | NP | GIDGX - Goldman Sachs Enhanced Dividend Global Equity Portfolio Institutional | 8 246 | 0,00 | 496 | 19,23 | ||||
| 2025-04-15 | 13F | Oak Family Advisors, Llc | 0 | −100,00 | 0 | |||||
| 2025-05-12 | 13F | Providence First Trust Co | 0 | −100,00 | 0 | |||||
| 2025-08-07 | 13F | CENTRAL TRUST Co | 970 | 0,00 | 59 | 18,37 | ||||
| 2025-08-14 | 13F | Verition Fund Management LLC | 0 | −100,00 | 0 | |||||
| 2025-07-14 | 13F | Painted Porch Advisors LLC | 44 | 0,00 | 3 | 0,00 | ||||
| 2025-08-08 | 13F | M&G Plc | 2 257 723 | −51,19 | 136 728 | −41,99 | ||||
| 2025-08-14 | 13F | Rokos Capital Management LLP | 10 590 | 0,00 | 641 | 18,92 | ||||
| 2025-07-31 | 13F | Glass Jacobson Investment Advisors llc | 0 | −100,00 | 0 | |||||
| 2025-08-01 | 13F | Envestnet Asset Management Inc | 23 693 | 96,90 | 1 435 | 133,93 | ||||
| 2025-08-13 | 13F | Lumbard & Kellner, LLC | 9 326 | 565 | ||||||
| 2025-08-06 | 13F | Texas Yale Capital Corp. | 6 275 | −6,48 | 380 | 11,44 | ||||
| 2025-08-11 | 13F | Banque Cantonale Vaudoise | 1 832 | −2,14 | 0 | |||||
| 2025-08-12 | 13F | Global Retirement Partners, LLC | 2 113 | 23 377,78 | 128 | |||||
| 2025-08-19 | 13F | Element Pointe Advisors, Llc | 10 740 | 0,00 | 650 | 18,83 | ||||
| 2025-07-08 | 13F | Lowe Wealth Advisors, LLC | 529 | 3,93 | 32 | 28,00 | ||||
| 2025-08-15 | 13F | Tower Research Capital LLC (TRC) | 1 203 | 73 | ||||||
| 2025-05-15 | 13F/A | Orion Portfolio Solutions, LLC | 3 973 | 202 | ||||||
| 2025-08-13 | 13F | Mount Yale Investment Advisors, LLC | 43 | 3 | ||||||
| 2025-08-14 | 13F | Michelson Medical Research Foundation, Inc. | 41 850 | 0,00 | 2 534 | 18,86 | ||||
| 2025-08-13 | 13F | Berbice Capital Management LLC | 0 | −100,00 | 0 | |||||
| 2025-08-13 | 13F | Cresset Asset Management, LLC | 9 597 | 27,21 | 581 | 51,30 | ||||
| 2025-05-15 | 13F | Marshall Wace, Llp | Call | 0 | −100,00 | 0 | −100,00 | |||
| 2025-08-27 | 13F/A | Squarepoint Ops LLC | Put | 0 | −100,00 | 0 | ||||
| 2025-08-18 | 13F | Ashford Capital Management Inc | 55 988 | −30,25 | 3 391 | −17,11 | ||||
| 2025-08-27 | 13F/A | Squarepoint Ops LLC | 0 | −100,00 | 0 | |||||
| 2025-08-14 | 13F | Rafferty Asset Management, LLC | 126 361 | −33,49 | 7 652 | −20,96 | ||||
| 2025-05-15 | 13F | Twin Tree Management, LP | Put | 0 | −100,00 | 0 | −100,00 | |||
| 2025-08-14 | 13F | Daiwa Securities Group Inc. | 300 | 0,00 | 0 | |||||
| 2025-08-14 | 13F | DRW Securities, LLC | Call | 0 | −100,00 | 0 | −100,00 | |||
| 2025-07-15 | 13F | Fifth Third Bancorp | 0 | −100,00 | 0 | |||||
| 2025-05-15 | 13F | Eschler Asset Management LLP | 0 | −100,00 | 0 | |||||
| 2025-07-28 | 13F | Kiker Wealth Management, LLC | 374 | 0,00 | 23 | 15,79 | ||||
| 2025-08-13 | 13F | Hsbc Holdings Plc | 1 236 281 | 74 869 | ||||||
| 2025-08-14 | 13F | Goldman Sachs Group Inc | Call | 0 | −100,00 | 0 | −100,00 | |||
| 2025-05-13 | 13F | Thrivent Financial For Lutherans | 0 | −100,00 | 0 | |||||
| 2025-08-14 | 13F | Headlands Technologies LLC | 15 073 | 15 280,61 | 913 | 22 700,00 | ||||
| 2025-08-12 | 13F | BlackRock, Inc. | 1 828 | 5,42 | 111 | 25,00 | ||||
| 2025-08-08 | 13F | Itau Unibanco Holding S.A. | 19 210 | 979 | ||||||
| 2025-08-14 | 13F | Prelude Capital Management, Llc | 12 000 | −0,36 | 727 | 18,43 | ||||
| 2025-08-15 | 13F | Morgan Stanley | 1 615 442 | −56,88 | 97 831 | −48,76 | ||||
| 2025-08-14 | 13F | Citadel Advisors Llc | Call | 82 100 | −79,24 | 4 972 | −75,33 | |||
| 2025-08-14 | 13F | Sargent Investment Group, LLC | 4 435 | −8,08 | 269 | 9,80 | ||||
| 2025-08-12 | 13F | Journey Strategic Wealth Llc | 4 700 | 285 | ||||||
| 2025-05-09 | 13F | Delta Asset Management Llc/tn | 0 | −100,00 | 0 | |||||
| 2025-07-18 | 13F | Truist Financial Corp | 12 962 | 34,77 | 785 | 60,00 | ||||
| 2025-08-14 | 13F | Optiver Holding B.V. | 1 136 | 0,00 | 69 | 19,30 | ||||
| 2025-08-14 | 13F | Verition Fund Management LLC | Put | 0 | −100,00 | 0 | ||||
| 2025-07-11 | 13F | Farther Finance Advisors, LLC | 126 | 1,61 | 8 | 16,67 | ||||
| 2025-04-14 | 13F | IMC-Chicago, LLC | 0 | −100,00 | 0 | |||||
| 2025-07-28 | 13F | Axxcess Wealth Management, Llc | 0 | −100,00 | 0 | |||||
| 2025-07-18 | 13F | Institute for Wealth Management, LLC. | 5 323 | 0,00 | 322 | 18,82 | ||||
| 2025-07-24 | 13F | Eastern Bank | 0 | −100,00 | 0 | |||||
| 2025-08-13 | 13F | First Trust Advisors Lp | 26 970 | −4,40 | 1 633 | 13,64 | ||||
| 2025-08-14 | 13F | Citadel Advisors Llc | Put | 126 000 | −60,83 | 7 631 | −53,46 | |||
| 2025-08-19 | NP | GGSIX - Goldman Sachs Growth Strategy Portfolio Institutional | 2 712 | 0,00 | 164 | 18,84 | ||||
| 2025-07-11 | 13F | Caldwell Securities, Inc | 35 | 0,00 | 2 | 100,00 | ||||
| 2025-05-15 | 13F | Wiley Bros.-aintree Capital, Llc | 0 | −100,00 | 0 | |||||
| 2025-05-13 | 13F | Quadrature Capital Ltd | 0 | −100,00 | 0 | |||||
| 2025-07-25 | 13F | We Are One Seven, LLC | 5 329 | 2,13 | 323 | 21,51 | ||||
| 2025-08-11 | 13F | Private Advisor Group, LLC | 4 067 | 246 | ||||||
| 2025-08-13 | 13F | Centiva Capital, LP | 3 882 | 235 | ||||||
| 2025-08-08 | 13F | Capital Investment Advisory Services, LLC | 100 | −90,28 | 6 | −88,46 | ||||
| 2025-08-11 | 13F | Absolute Gestao de Investimentos Ltda. | 22 000 | 1 332 | ||||||
| 2025-08-13 | 13F | PACK Private Wealth, LLC | 4 394 | 10,46 | 266 | 31,68 | ||||
| 2025-08-19 | 13F | National Asset Management, Inc. | 20 555 | 1 245 | ||||||
| 2025-08-04 | 13F | Whalen Wealth Management Inc. | 4 534 | 275 | ||||||
| 2025-06-26 | NP | BlackRock ETF Trust - iShares International Country Rotation Active ETF | 944 | 43,90 | 54 | 65,63 | ||||
| 2025-08-28 | NP | ICCIX - Dynamic International Opportunity Fund Class I | 20 581 | −43,29 | 1 246 | −39,34 | ||||
| 2025-08-12 | 13F | Richard W. Paul & Associates, LLC | 6 217 | 376 | ||||||
| 2025-08-14 | 13F | Two Sigma Investments, Lp | 44 400 | 2 689 | ||||||
| 2025-08-04 | 13F | IFG Advisory, LLC | 16 255 | 984 | ||||||
| 2025-08-14 | 13F | Wells Fargo & Company/mn | Put | 10 000 | 606 | |||||
| 2025-09-04 | 13F/A | Advisor Group Holdings, Inc. | 10 426 | 5,20 | 635 | 25,05 | ||||
| 2025-05-20 | 13F | Belpointe Asset Management LLC | 0 | −100,00 | 0 | |||||
| 2025-08-06 | 13F | Commonwealth Equity Services, Llc | 5 769 | 12,24 | 0 | |||||
| 2025-08-28 | NP | SYMIX - AlphaCentric Symmetry Strategy Fund Class I | 2 138 | 12,70 | 129 | −1,53 | ||||
| 2025-08-08 | 13F | Creative Planning | 3 360 | 203 | ||||||
| 2025-08-14 | 13F | Group One Trading, L.p. | 0 | −100,00 | 0 | |||||
| 2025-08-14 | 13F | Wells Fargo & Company/mn | 318 414 | 293,88 | 19 283 | 368,15 | ||||
| 2025-07-11 | 13F/A | Financiere des Professionnels - Fonds d,investissement inc. | 35 000 | 2 120 | ||||||
| 2025-08-06 | 13F | Nvwm, Llc | 20 571 | 132,70 | 1 246 | 176,67 | ||||
| 2025-08-13 | 13F | Capital Fund Management S.a. | 149 643 | 20,89 | 9 062 | 43,68 | ||||
| 2025-07-16 | 13F | Highline Wealth Partners Llc | 0 | −100,00 | 0 | |||||
| 2025-08-14 | 13F | Glen Eagle Advisors, LLC | 539 | 0,00 | 33 | 18,52 | ||||
| 2025-07-31 | 13F | Nisa Investment Advisors, Llc | 500 | 0,00 | 30 | 20,00 | ||||
| 2025-07-22 | 13F | 4Thought Financial Group Inc. | 233 | 2,19 | 14 | 27,27 | ||||
| 2025-08-14 | 13F | Point72 Asset Management, L.P. | Call | 0 | −100,00 | 0 | ||||
| 2025-08-14 | 13F | Hrt Financial Lp | 4 477 | 0 | ||||||
| 2025-08-12 | 13F | Steward Partners Investment Advisory, Llc | 3 416 | 11,09 | 207 | 32,05 | ||||
| 2025-08-13 | 13F | Capital Fund Management S.a. | Call | 36 300 | −67,68 | 2 198 | −61,59 | |||
| 2025-08-18 | 13F | Geneos Wealth Management Inc. | 34 321 | 234,94 | 2 078 | 298,08 | ||||
| 2025-08-13 | 13F | Capital Fund Management S.a. | Put | 25 000 | −68,31 | 1 514 | −62,34 | |||
| 2025-08-13 | 13F | Walleye Trading LLC | Call | 0 | −100,00 | 0 | −100,00 | |||
| 2025-08-14 | 13F | Mml Investors Services, Llc | 12 225 | 27,37 | 1 | |||||
| 2025-05-05 | 13F | IFP Advisors, Inc | 0 | −100,00 | 0 | |||||
| 2025-08-11 | 13F | Covestor Ltd | 3 | 0,00 | 0 | |||||
| 2025-08-11 | 13F | Mount Lucas Management LP | 14 639 | 887 | ||||||
| 2025-07-17 | 13F | Venture Visionary Partners LLC | 16 169 | −0,22 | 979 | 18,67 | ||||
| 2025-08-01 | 13F | Solstein Capital, LLC | 1 916 | −59,05 | 116 | −51,26 | ||||
| 2025-08-14 | 13F | LMR Partners LLP | 0 | −100,00 | 0 | |||||
| 2025-08-01 | 13F | Banco Santander, S.A. | 18 098 | −64,06 | 1 096 | −57,27 | ||||
| 2025-07-11 | 13F | Seacrest Wealth Management, Llc | 28 331 | 1 716 | ||||||
| 2025-08-14 | 13F | Evergreen Capital Management Llc | 49 320 | −16,53 | 2 987 | −0,83 | ||||
| 2025-07-25 | 13F | NorthRock Partners, LLC | 0 | −100,00 | 0 | |||||
| 2025-08-14 | 13F | SIH Partners, LLLP | 6 401 | −92,15 | 388 | −90,68 | ||||
| 2025-08-14 | 13F | Toronto Dominion Bank | 6 | 0,00 | 0 | |||||
| 2025-08-14 | 13F | Riggs Asset Managment Co. Inc. | 54 690 | 3 312 | ||||||
| 2025-08-18 | 13F/A | National Bank Of Canada /fi/ | 14 061 | −3,79 | 852 | 14,23 | ||||
| 2025-07-23 | 13F | Vontobel Holding Ltd. | 0 | −100,00 | 0 | |||||
| 2025-08-07 | 13F | Winch Advisory Services, LLC | 169 | 1,81 | 10 | 25,00 | ||||
| 2025-08-12 | 13F | AlphaCore Capital LLC | 100 | 6 | ||||||
| 2025-07-30 | 13F | Avidian Wealth Solutions, LLC | 111 232 | −0,30 | 6 736 | 18,49 | ||||
| 2025-08-05 | 13F | Bank Of Montreal /can/ | 1 504 | 91 | ||||||
| 2025-08-07 | 13F | Sollinda Capital Management LLC | 0 | −100,00 | 0 | −100,00 | ||||
| 2025-08-14 | 13F | Jane Street Group, Llc | 553 090 | 43,25 | 33 495 | 70,24 | ||||
| 2025-06-27 | 13F/A | Goldman Sachs Group Inc | Put | 0 | −100,00 | 0 | −100,00 | |||
| 2025-08-14 | 13F | UBS Group AG | 1 813 780 | 65,85 | 109 843 | 97,09 | ||||
| 2025-08-13 | 13F | JT Stratford LLC | 0 | −100,00 | 0 | |||||
| 2025-08-06 | 13F | North Capital, Inc. | 500 | 30 | ||||||
| 2025-07-31 | 13F | Cambridge Investment Research Advisors, Inc. | 7 222 | 40,23 | 0 | |||||
| 2025-08-14 | 13F | Cinctive Capital Management LP | 0 | −100,00 | 0 | |||||
| 2025-08-05 | 13F | Simplex Trading, Llc | 0 | −100,00 | 0 | |||||
| 2025-08-14 | 13F | Boothbay Fund Management, Llc | 7 688 | 466 | ||||||
| 2025-08-18 | 13F | Wolverine Trading, Llc | 9 928 | −79,03 | 599 | −75,52 | ||||
| 2025-08-12 | 13F | Proequities, Inc. | 0 | 0 | ||||||
| 2025-08-14 | 13F | Point72 Asset Management, L.P. | 0 | −100,00 | 0 | |||||
| 2025-08-18 | 13F | Wolverine Trading, Llc | Call | 21 400 | 32,92 | 1 291 | 55,23 | |||
| 2025-07-30 | 13F | Crewe Advisors LLC | 200 | 0,00 | 12 | 20,00 | ||||
| 2025-08-18 | 13F | Wolverine Trading, Llc | Put | 41 600 | −62,18 | 2 509 | −55,81 | |||
| 2025-07-14 | 13F | AdvisorNet Financial, Inc | 11 | 0,00 | 1 | |||||
| 2025-07-29 | NP | HFND - Unlimited HFND Multi-Strategy Return Tracker ETF | 238 | 244,93 | 14 | 250,00 | ||||
| 2025-06-17 | 13F | Ridgepath Capital Management LLC | 26 974 | 1 375 | ||||||
| 2025-08-14 | 13F | Atom Investors LP | 0 | −100,00 | 0 | |||||
| 2025-08-14 | 13F | Massar Capital Management, LP | 0 | −100,00 | 0 | |||||
| 2025-08-13 | 13F | Walleye Trading LLC | 9 735 | 590 | ||||||
| 2025-08-13 | 13F | Walleye Trading LLC | Put | 13 900 | 172,55 | 842 | 224,71 | |||
| 2025-08-13 | 13F | Renaissance Technologies Llc | 8 598 | 521 | ||||||
| 2025-04-22 | 13F | Synergy Financial Management, LLC | 0 | −100,00 | 0 | |||||
| 2025-07-31 | 13F | Sumitomo Mitsui Trust Holdings, Inc. | 4 785 | 290 | ||||||
| 2025-08-14 | 13F | Jane Street Group, Llc | Call | 18 300 | −74,08 | 1 108 | −69,20 | |||
| 2025-08-05 | 13F | Access Investment Management LLC | 35 | 2 | ||||||
| 2025-08-14 | 13F | Jane Street Group, Llc | Put | 3 700 | −45,59 | 224 | −35,26 | |||
| 2025-05-15 | 13F | Crestline Management, LP | 0 | −100,00 | 0 | |||||
| 2025-07-10 | 13F | CWC Advisors, LLC. | 9 192 | 3,95 | 557 | 23,56 | ||||
| 2025-08-14 | 13F | Goldman Sachs Group Inc | 1 838 100 | 19,97 | 111 315 | 42,57 | ||||
| 2025-07-24 | 13F | Rice Partnership, LLC | 0 | −100,00 | 0 | |||||
| 2025-08-14 | 13F | Integrated Wealth Concepts LLC | 42 683 | 2 585 | ||||||
| 2025-03-31 | NP | SSXU - Day Hagan/Ned Davis Research Smart Sector International ETF | 43 633 | 257,00 | 2 137 | 167,13 | ||||
| 2025-05-28 | NP | GHTA - Goose Hollow Tactical Allocation ETF | 32 811 | 66,65 | 1 672 | 81,54 | ||||
| 2025-08-14 | 13F | CIBC World Markets Inc. | 10 067 | 610 | ||||||
| 2025-07-25 | 13F | Cwm, Llc | 245 | −43,02 | 0 |