Grundläggande statistik
| Institutionella ägare | 145 total, 141 long only, 0 short only, 4 long/short - change of 1,38% MRQ |
| Genomsnittlig portföljallokering | 1.3204 % - change of 23,04% MRQ |
| Institutionella aktier (lång) | 10 107 799 (ex 13D/G) - change of 1,56MM shares 18,22% MRQ |
| Institutionellt värde (lång) | $ 1 737 842 USD ($1000) |
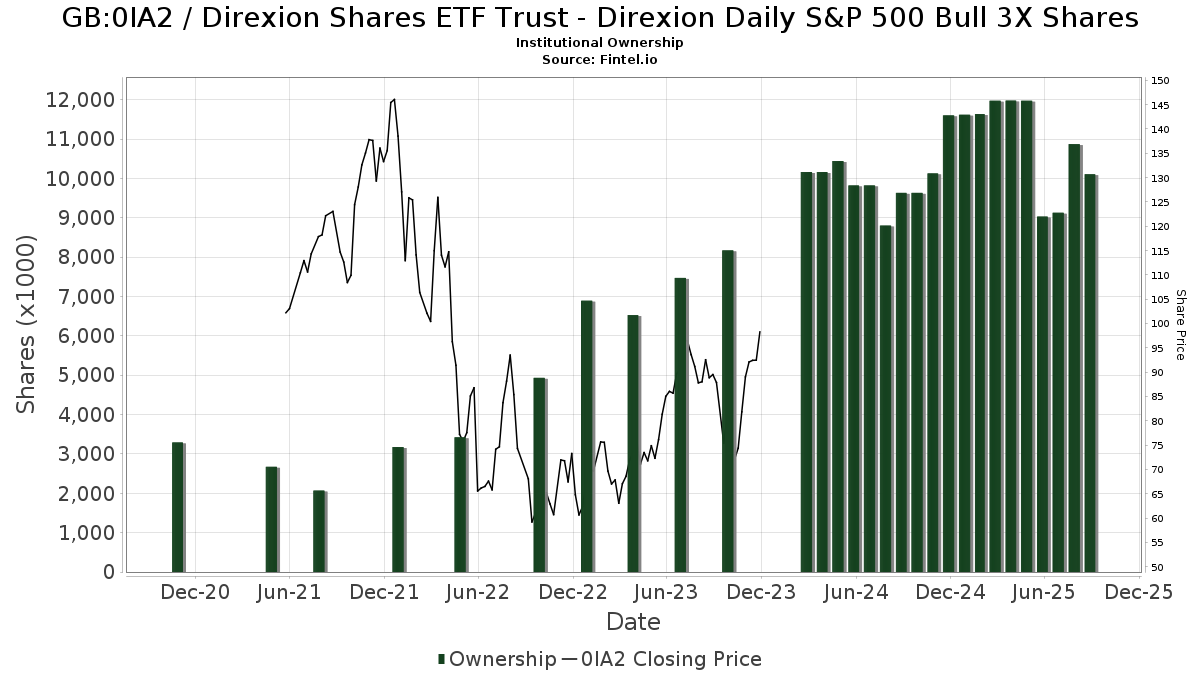
Institutionellt ägande och aktieägare
Direxion Shares ETF Trust - Direxion Daily S&P 500 Bull 3X Shares (GB:0IA2) har 145 Institutionella ägare och aktieägare som har lämnat in 13D/G- eller 13F-formulär till Securities Exchange Commission (SEC). Dessa institut innehar totalt 10,107,799 aktier. Största aktieägare inkluderar PPSC Investment Service Corp, Howard Capital Management Inc., CRDBX - Conquer Risk Defensive Bull Fund, Citadel Advisors Llc, Susquehanna International Group, Llp, HCMNX - HCM Dividend Sector Plus Fund Class A Shares, Citadel Advisors Llc, Susquehanna International Group, Llp, LGH - HCM Defender 500 Index ETF, and Wealthstar Advisors, Llc .
Direxion Shares ETF Trust - Direxion Daily S&P 500 Bull 3X Shares (LSE:0IA2) Institutionell ägarstruktur visar institutioners och fonders nuvarande positioner i företaget, samt de senaste förändringarna i positionernas storlek. Större aktieägare kan vara enskilda investerare, fonder, hedgefonder eller institutioner. Bilaga 13D visar att investeraren äger (eller ägde) mer än 5% av företaget och avser (eller avsåg) att aktivt eftersträva en förändring av affärsstrategin. Schedule 13G indikerar en passiv investering på över 5%.
Fondsentimentets poäng
Fondsentimentet poängen(fka Ägarackumulation-poäng) visar vilka aktier som är mest köpta av fonder. Det är resultatet av en sofistikerad kvantitativ flerfaktormodell som identifierar företag med de högsta nivåerna av institutionell ackumulering. Poängsättningsmodellen använder en kombination av den totala ökningen av redovisade ägare, förändringarna i portföljallokeringarna för dessa ägare och andra mått. Siffran sträcker sig från 0 till 100, där högre siffror indikerar en högre nivå av ackumulering i förhållande till sina konkurrenter, och 50 är genomsnittet.
Uppdateringsfrekvens: Dagligen
Se Ownership Explorer, som innehåller en lista över de högst rankade företagen.
AI+ Ask Fintel’s AI assistant about Direxion Shares ETF Trust - Direxion Daily S&P 500 Bull 3X Shares.
Thinking of good questions…
13F- och NPORT-arkiveringar
Detaljer om 13F-arkiveringar är gratis. Detaljer om NP-arkiveringar kräver ett premiummedlemskap. Gröna rader indikerar nya positioner. Röda rader indikerar stängda positioner. Klicka på länk symbolen för att se hela transaktionshistoriken.
Uppgradera
för att låsa upp premiumdata och exportera till Excel ![]() .
.
| Fil Datum | Källa | Investerare | Typ | Genomsnittligt pris (beräknat) |
Aktier | Δ Aktier (%) |
Rapporterat värde (1000 USD) |
Δ Värde (%) |
Portföljallokering (%) |
|
|---|---|---|---|---|---|---|---|---|---|---|
| 2025-07-22 | 13F | CPR Investments Inc. | 4 780 | 829 | ||||||
| 2025-08-27 | NP | LGH - HCM Defender 500 Index ETF | 560 757 | 97 308 | ||||||
| 2025-08-14 | 13F | Headlands Technologies LLC | 0 | −100,00 | 0 | −100,00 | ||||
| 2025-08-12 | 13F | Proequities, Inc. | 0 | 0 | ||||||
| 2025-08-14 | 13F | Jane Street Group, Llc | Put | 433 700 | 34,02 | 75 260 | 65,66 | |||
| 2025-08-01 | 13F | Ashton Thomas Private Wealth, LLC | 12 847 | 2 238 | ||||||
| 2025-08-14 | 13F | Jane Street Group, Llc | Call | 60 900 | 2,01 | 10 568 | 26,08 | |||
| 2025-07-17 | 13F | Beacon Capital Management, LLC | 570 | 92,57 | 99 | 139,02 | ||||
| 2025-07-24 | 13F | Us Bancorp \de\ | 0 | −100,00 | 0 | |||||
| 2025-08-15 | 13F | Morse Asset Management, Inc | 60 | 0,00 | 10 | 25,00 | ||||
| 2025-07-10 | 13F | PMV Capital Advisers, LLC | 4 542 | −32,22 | 788 | −16,17 | ||||
| 2025-07-22 | 13F | IMC-Chicago, LLC | 44 845 | 7 782 | ||||||
| 2025-07-10 | 13F | Financial Management Network Inc | 1 225 | 220 | ||||||
| 2025-07-15 | 13F | Main Street Group, LTD | 734 | 18,58 | 127 | 47,67 | ||||
| 2025-08-14 | 13F | Goldman Sachs Group Inc | 57 268 | −54,43 | 9 938 | −43,67 | ||||
| 2025-08-12 | 13F | CIBC Private Wealth Group, LLC | 2 813 | 0,00 | 488 | 80,74 | ||||
| 2025-08-05 | 13F | Westwood Wealth Management | 34 025 | 3,50 | 5 904 | 27,93 | ||||
| 2025-07-30 | 13F | Brookstone Capital Management | 1 232 | −28,21 | 214 | −11,25 | ||||
| 2025-08-19 | 13F | Newbridge Financial Services Group, Inc. | 32 | 5 | ||||||
| 2025-08-13 | 13F | Continuum Advisory, LLC | 0 | −100,00 | 0 | |||||
| 2025-07-07 | 13F | Discipline Wealth Solutions, LLC | 5 529 | 959 | ||||||
| 2025-07-07 | 13F | Thurston, Springer, Miller, Herd & Titak, Inc. | 6 478 | 89,25 | 1 125 | 134,17 | ||||
| 2025-07-24 | 13F | PayPay Securities Corp | 747 | −18,27 | 130 | 0,78 | ||||
| 2025-08-08 | 13F | Larson Financial Group LLC | 2 341 | 506,48 | 406 | 651,85 | ||||
| 2025-08-01 | 13F | Belvedere Trading LLC | 0 | −100,00 | 0 | −100,00 | ||||
| 2025-08-13 | 13F | Flow Traders U.s. Llc | 23 394 | −21,43 | 4 | 0,00 | ||||
| 2025-07-14 | 13F | Westend Capital Management LLC | 275 | 0,00 | 48 | 23,68 | ||||
| 2025-08-13 | 13F | Townsquare Capital Llc | 0 | −100,00 | 0 | |||||
| 2025-07-29 | 13F | Stratos Wealth Partners, LTD. | 1 654 | −19,28 | 287 | 0,00 | ||||
| 2025-08-12 | 13F | Coldstream Capital Management Inc | 0 | −100,00 | 0 | |||||
| 2025-08-13 | 13F | Cresset Asset Management, LLC | 3 435 | 7,01 | 598 | 32,30 | ||||
| 2025-08-12 | 13F | Park Square Financial Group, LLC | 0 | −100,00 | 0 | |||||
| 2025-08-15 | 13F | Morgan Stanley | 17 470 | 29,54 | 3 032 | 60,12 | ||||
| 2025-04-21 | 13F | Green Square Capital Advisors Llc | Call | 0 | −100,00 | 0 | ||||
| 2025-08-13 | 13F | Cerity Partners LLC | 2 795 | 36,74 | 485 | 69,58 | ||||
| 2025-08-14 | 13F | Jane Street Group, Llc | 0 | −100,00 | 0 | |||||
| 2025-07-14 | 13F | Clear Harbor Asset Management, LLC | 2 000 | 0,00 | 347 | 23,93 | ||||
| 2025-07-14 | 13F | Clear Harbor Asset Management, LLC | Put | 5 500 | 954 | |||||
| 2025-08-14 | 13F | Hrt Financial Lp | 10 348 | 2 | ||||||
| 2025-08-12 | 13F | Global Retirement Partners, LLC | 0 | −100,00 | 0 | |||||
| 2025-08-18 | 13F | Hollencrest Capital Management | 383 | −99,80 | 66 | −99,76 | ||||
| 2025-07-23 | 13F | Vontobel Holding Ltd. | 5 515 | −0,86 | 957 | 22,69 | ||||
| 2025-07-28 | 13F | Harbour Investments, Inc. | 4 102 | 0,00 | 712 | 23,65 | ||||
| 2025-05-15 | 13F | Wolverine Trading, Llc | 0 | −100,00 | 0 | |||||
| 2025-05-28 | NP | AIIFX - Timber Point Alternative Income Fund Institutional Class Shares | 2 500 | −16,67 | 351 | −30,83 | ||||
| 2025-08-26 | NP | CRDBX - Conquer Risk Defensive Bull Fund | 1 679 167 | −30,57 | 291 386 | −28,58 | ||||
| 2025-08-07 | 13F | Traynor Capital Management, Inc. | Call | 0 | −100,00 | 0 | −100,00 | |||
| 2025-05-15 | 13F | Wolverine Trading, Llc | Call | 0 | −100,00 | 0 | ||||
| 2025-07-29 | 13F | Stratos Wealth Advisors, LLC | 2 754 | −20,15 | 478 | −1,24 | ||||
| 2025-08-11 | 13F | Pineridge Advisors LLC | 334 | 0,30 | 58 | 23,91 | ||||
| 2025-07-29 | 13F | Members Advisory Group LLC | 34 021 | 2,88 | 5 908 | 27,20 | ||||
| 2025-04-10 | 13F | Wealth Alliance Advisory Group, LLC | 0 | −100,00 | 0 | −100,00 | ||||
| 2025-05-15 | 13F | Wolverine Trading, Llc | Put | 0 | −100,00 | 0 | ||||
| 2025-08-14 | 13F | Optiver Holding B.V. | 36 105 | 9 929,17 | 6 265 | 12 430,00 | ||||
| 2025-07-22 | 13F | Net Worth Advisory Group | 2 591 | 13,05 | 450 | 39,88 | ||||
| 2025-05-13 | 13F | Soltis Investment Advisors LLC | 0 | −100,00 | 0 | |||||
| 2025-07-30 | 13F | Bogart Wealth, LLC | 1 | 0,00 | 0 | |||||
| 2025-08-05 | 13F | Simplex Trading, Llc | 10 277 | 2 | ||||||
| 2025-05-15 | 13F | Boothbay Fund Management, Llc | 0 | −100,00 | 0 | −100,00 | ||||
| 2025-04-22 | 13F/A | NorthRock Partners, LLC | 0 | −100,00 | 0 | |||||
| 2025-07-25 | 13F | Cwm, Llc | 78 | 0,00 | 0 | |||||
| 2025-08-14 | 13F | Citadel Advisors Llc | 396 701 | 1 707,87 | 68 840 | 2 135,03 | ||||
| 2025-08-14 | 13F | Citadel Advisors Llc | Put | 775 400 | −5,28 | 134 555 | 17,08 | |||
| 2025-05-15 | 13F | DRW Securities, LLC | 0 | −100,00 | 0 | −100,00 | ||||
| 2025-07-17 | 13F | Independence Bank of Kentucky | 650 | −27,78 | 113 | −11,11 | ||||
| 2025-08-27 | NP | HCMEX - HCM Income Plus Fund Class A Shares | 276 300 | −41,83 | 47 946 | −40,17 | ||||
| 2025-08-14 | 13F | Bank Of America Corp /de/ | 412 | 0,00 | 71 | 24,56 | ||||
| 2025-08-27 | 13F/A | Brinker Capital Investments, LLC | 6 582 | 1 142 | ||||||
| 2025-05-14 | 13F | Berkshire Asset Management Llc/pa | 0 | −100,00 | 0 | |||||
| 2025-08-05 | 13F | Huntington National Bank | 76 | 24,59 | ||||||
| 2025-08-14 | 13F | Federation des caisses Desjardins du Quebec | 315 | −7,35 | 55 | 14,89 | ||||
| 2025-07-28 | 13F | Virtus Wealth Solutions LLC | 3 478 | 0,35 | 604 | 24,07 | ||||
| 2025-08-27 | 13F/A | Squarepoint Ops LLC | Put | 0 | −100,00 | 0 | −100,00 | |||
| 2025-08-11 | 13F | FSA Wealth Management LLC | 310 | 54 | ||||||
| 2025-08-14 | 13F | Modern Wealth Management, LLC | 17 140 | 2 974 | ||||||
| 2025-08-14 | 13F | Wells Fargo & Company/mn | 2 | −98,02 | 0 | −100,00 | ||||
| 2025-08-13 | 13F | Legacy Capital Wealth Partners, LLC | 0 | −100,00 | 0 | |||||
| 2025-07-10 | 13F | Park Capital Management, LLC / WI | 1 600 | −35,74 | 278 | −20,63 | ||||
| 2025-07-24 | 13F | PPSC Investment Service Corp | 2 649 688 | 2,51 | 459 800 | 26,71 | ||||
| 2025-07-30 | NP | DRAI - Draco Evolution AI ETF | 19 199 | 346,49 | 2 907 | 296,05 | ||||
| 2025-08-13 | 13F | Beacon Pointe Advisors, LLC | 2 965 | 0,37 | 514 | 24,15 | ||||
| 2025-08-12 | 13F | Jpmorgan Chase & Co | 22 659 | 3 932 | ||||||
| 2025-08-01 | 13F | Wealth Watch Advisors, INC | 1 269 | 220 | ||||||
| 2025-08-11 | 13F | HighTower Advisors, LLC | 1 412 | −57,64 | 245 | −47,54 | ||||
| 2025-08-08 | 13F | Tanglewood Legacy Advisors, LLC | 52 | 0,00 | 9 | 28,57 | ||||
| 2025-07-17 | 13F | Smith Chas P & Associates Pa Cpas | 26 056 | −2,92 | 4 522 | 19,98 | ||||
| 2025-08-27 | NP | HCMNX - HCM Dividend Sector Plus Fund Class A Shares | 835 617 | −38,41 | 145 005 | −36,64 | ||||
| 2025-07-31 | 13F | Insight Wealth Partners, LLC | 115 614 | 346,44 | 20 062 | 451,91 | ||||
| 2025-07-10 | 13F | Charter Oak Capital Management, LLC | 12 461 | −2,09 | 2 162 | 21,05 | ||||
| 2025-08-12 | 13F | MAI Capital Management | 0 | −100,00 | 0 | |||||
| 2025-08-21 | 13F | Aveo Capital Partners, LLC | 0 | −100,00 | 0 | |||||
| 2025-08-08 | 13F | Mittelman Wealth Management | 3 653 | 634 | ||||||
| 2025-07-17 | 13F | LifeGuide Financial Advisors, LLC | 6 154 | −11,75 | 1 068 | 9,10 | ||||
| 2025-08-15 | 13F | CI Private Wealth, LLC | 31 400 | 336,72 | 5 449 | 437,81 | ||||
| 2025-07-08 | 13F | Parallel Advisors, LLC | 725 | 38,10 | 126 | 71,23 | ||||
| 2025-08-11 | 13F | Private Advisor Group, LLC | 1 502 | 0,13 | 261 | 23,81 | ||||
| 2025-07-24 | 13F | Wealthstar Advisors, Llc | 481 825 | 62,72 | 83 611 | 101,13 | ||||
| 2025-08-11 | 13F | Empowered Funds, LLC | 19 199 | 372,18 | 3 332 | 484,39 | ||||
| 2025-08-12 | 13F | Blueprint Financial Advisors LLC | 15 690 | 2 723 | ||||||
| 2025-08-05 | 13F | Bank Of Montreal /can/ | 2 343 | 0,00 | 407 | 23,78 | ||||
| 2025-08-14 | 13F | Two Sigma Securities, Llc | 0 | −100,00 | 0 | |||||
| 2025-07-09 | 13F | Navigation Wealth Management, Inc. | 2 195 | −1,30 | 381 | 22,58 | ||||
| 2025-08-19 | 13F | Anchor Investment Management, LLC | 300 | 52 | ||||||
| 2025-08-12 | 13F | XTX Topco Ltd | 0 | −100,00 | 0 | |||||
| 2025-08-14 | 13F | Group One Trading, L.p. | 45 492 | 1 181,46 | 7 894 | 1 485,14 | ||||
| 2025-07-23 | 13F | Gainplan LLC | 80 191 | 13 916 | ||||||
| 2025-05-09 | 13F | Bouchey Financial Group Ltd | 0 | −100,00 | 0 | |||||
| 2025-07-28 | 13F | Triton Wealth Management, PLLC | 1 440 | 268 | ||||||
| 2025-07-31 | 13F | Blue Sky Capital Consultants Group, Inc. | 17 611 | −2,20 | 3 056 | 20,89 | ||||
| 2025-05-15 | 13F | Scientech Research LLC | 0 | −100,00 | 0 | −100,00 | ||||
| 2025-07-16 | 13F | Highline Wealth Partners Llc | 0 | −100,00 | 0 | |||||
| 2025-08-14 | 13F | Citadel Advisors Llc | Call | 1 477 900 | −2,24 | 256 460 | 20,83 | |||
| 2025-07-16 | 13F | Signaturefd, Llc | 117 | 0,86 | 20 | 25,00 | ||||
| 2025-08-06 | 13F | Raelipskie Partnership | 1 300 | 0,00 | 226 | 23,63 | ||||
| 2025-08-07 | 13F | Encompass More Asset Management | 5 990 | 1 039 | ||||||
| 2025-08-06 | 13F | Commonwealth Equity Services, Llc | 6 427 | 51,40 | 1 | |||||
| 2025-08-13 | 13F | Summit Financial, LLC | 1 641 | 4,59 | 286 | 29,55 | ||||
| 2025-08-08 | 13F | Gts Securities Llc | 120 092 | 230,17 | 20 868 | 309,00 | ||||
| 2025-07-21 | 13F | Barrett & Company, Inc. | 123 | 0,00 | 21 | 23,53 | ||||
| 2025-08-13 | 13F | Quadrature Capital Ltd | 15 912 | −83,72 | 2 760 | −79,90 | ||||
| 2025-08-11 | 13F | Covestor Ltd | 5 753 | 18,96 | 1 | |||||
| 2025-07-23 | 13F | GGM Financials LLC | 3 478 | 604 | ||||||
| 2025-08-07 | 13F | Allworth Financial LP | 0 | −100,00 | 0 | |||||
| 2025-08-14 | 13F | GWM Advisors LLC | 2 328 | −58,02 | 404 | −48,20 | ||||
| 2025-08-05 | 13F | Carolinas Wealth Consulting Llc | 0 | 0 | ||||||
| 2025-07-29 | 13F | TrueMark Investments, LLC | 7 783 | 1 351 | ||||||
| 2025-08-14 | 13F | CoreCap Advisors, LLC | 136 | 0,00 | 24 | 21,05 | ||||
| 2025-07-17 | 13F | Kelly Financial Services LLC | 5 635 | −1,95 | 978 | 21,22 | ||||
| 2025-08-18 | 13F/A | National Bank Of Canada /fi/ | 929 | 68,91 | 161 | 109,09 | ||||
| 2025-08-06 | 13F | Mark Sheptoff Financial Planning, Llc | 150 | 0,00 | 26 | 23,81 | ||||
| 2025-07-29 | 13F | BXM Wealth LLC | 15 372 | 12,70 | 2 668 | 39,41 | ||||
| 2025-08-13 | 13F | EverSource Wealth Advisors, LLC | 3 032 | −68,94 | 526 | −61,61 | ||||
| 2025-08-27 | 13F/A | Squarepoint Ops LLC | Call | 5 400 | −15,62 | 937 | 4,34 | |||
| 2025-08-12 | 13F | Change Path, LLC | 7 764 | −1,48 | 1 347 | 21,79 | ||||
| 2025-07-25 | 13F | Ellis Investment Partners, LLC | 2 382 | 13,54 | 413 | 40,48 | ||||
| 2025-08-14 | 13F/A | Barclays Plc | 150 | 0 | ||||||
| 2025-08-08 | 13F | Larson Financial Group LLC | Put | 0 | −100,00 | 0 | ||||
| 2025-08-13 | 13F | StoneX Group Inc. | 0 | −100,00 | 0 | −100,00 | ||||
| 2025-05-14 | 13F | Trinity Legacy Partners, LLC | 0 | −100,00 | 0 | |||||
| 2025-07-10 | 13F | Wealth Enhancement Advisory Services, Llc | 5 526 | 40,86 | 991 | 54,12 | ||||
| 2025-08-12 | 13F | Virtu Financial LLC | 37 469 | 88,79 | 7 | 200,00 | ||||
| 2025-07-17 | 13F | Sound Income Strategies, LLC | 0 | −100,00 | 0 | |||||
| 2025-08-08 | 13F | Citizens Financial Group Inc/ri | 5 185 | −1,44 | 903 | 21,89 | ||||
| 2025-07-15 | 13F | SJS Investment Consulting Inc. | 9 | 0,00 | 2 | 0,00 | ||||
| 2025-08-13 | 13F | First Trust Advisors Lp | 0 | −100,00 | 0 | |||||
| 2025-08-12 | 13F | SRS Capital Advisors, Inc. | 8 | 100,00 | 1 | |||||
| 2025-08-14 | 13F | Raymond James Financial Inc | 1 326 | 230 | ||||||
| 2025-08-14 | 13F | Mariner, LLC | 7 948 | 32,03 | 1 379 | 63,20 | ||||
| 2025-08-14 | 13F | Susquehanna International Group, Llp | Put | 625 700 | 52,68 | 108 578 | 88,73 | |||
| 2025-08-14 | 13F | Susquehanna International Group, Llp | 87 475 | 16,98 | 15 180 | 44,59 | ||||
| 2025-05-06 | 13F | Venturi Wealth Management, LLC | 0 | −100,00 | 0 | |||||
| 2025-08-14 | 13F | Susquehanna International Group, Llp | Call | 906 700 | 129,49 | 157 340 | 183,66 | |||
| 2025-08-14 | 13F | Riggs Asset Managment Co. Inc. | 53 | 0,00 | 9 | 28,57 | ||||
| 2025-08-08 | 13F | Creative Planning | 3 899 | −61,20 | 677 | −52,06 | ||||
| 2025-08-12 | 13F | Steward Partners Investment Advisory, Llc | 2 | −50,00 | 0 | |||||
| 2025-08-11 | 13F | TD Waterhouse Canada Inc. | 10 | 0,00 | 2 | 0,00 | ||||
| 2025-08-06 | 13F | Stone House Investment Management, LLC | 6 111 | −6,90 | 1 061 | 15,09 | ||||
| 2025-07-17 | 13F | Summit Financial Strategies, Inc. | 3 088 | −4,75 | 536 | 17,58 | ||||
| 2025-08-08 | 13F | Pnc Financial Services Group, Inc. | 202 | 0,00 | 35 | 25,00 | ||||
| 2025-08-14 | 13F | Fmr Llc | 20 | 0,00 | 3 | 50,00 | ||||
| 2025-08-07 | 13F | Traynor Capital Management, Inc. | 43 939 | 2,17 | 7 612 | 26,07 | ||||
| 2025-08-13 | 13F | Parkworth Wealth Management, Inc. | 67 | 0,00 | 12 | 22,22 | ||||
| 2025-05-09 | 13F | Washington Growth Strategies Llc | 0 | −100,00 | 0 | |||||
| 2025-08-14 | 13F | SWAN Capital LLC | 91 | −61,44 | 16 | −54,55 | ||||
| 2025-08-13 | 13F | Jump Financial, LLC | 0 | −100,00 | 0 | |||||
| 2025-07-15 | 13F | Significant Wealth Partners LLC | 6 351 | 24,90 | 1 102 | 54,56 | ||||
| 2025-08-08 | 13F | SBI Securities Co., Ltd. | 149 968 | 1,21 | 26 024 | 25,10 | ||||
| 2025-05-09 | 13F | Pathway Financial Advisers, LLC | 0 | −100,00 | 0 | |||||
| 2025-08-12 | 13F | Blueprint Investment Partners LLC | 16 279 | 2 825 | ||||||
| 2025-08-28 | NP | Elevation Series Trust - TrueShares Active Yield ETF | 7 783 | 1 351 | ||||||
| 2025-04-21 | 13F | Nelson, Van Denburg & Campbell Wealth Management Group, LLC | 0 | −100,00 | 0 | |||||
| 2025-05-15 | 13F | Parallax Volatility Advisers, L.P. | Call | 0 | −100,00 | 0 | −100,00 | |||
| 2025-08-04 | 13F | Spire Wealth Management | 39 064 | 43,36 | 6 779 | 77,20 | ||||
| 2025-05-15 | 13F | Parallax Volatility Advisers, L.P. | Put | 0 | −100,00 | 0 | −100,00 | |||
| 2025-08-06 | 13F | Founders Financial Securities Llc | 4 369 | 758 | ||||||
| 2025-08-14 | 13F | Royal Bank Of Canada | 0 | −100,00 | 0 | |||||
| 2025-05-28 | NP | CGHIX - Timber Point Global Allocations Fund Institutional Class Shares | 7 000 | −30,00 | 983 | −41,79 | ||||
| 2025-08-14 | 13F | UBS Group AG | 2 688 | −88,43 | 466 | −85,71 | ||||
| 2025-07-21 | 13F | J. Safra Sarasin Holding AG | 16 800 | 2 915 | ||||||
| 2025-08-14 | 13F | Amussen Hunsaker Associates Llc | 0 | −100,00 | 0 | |||||
| 2025-08-14 | 13F | Qube Research & Technologies Ltd | 0 | −100,00 | 0 | |||||
| 2025-08-13 | 13F | Edgestream Partners, L.P. | 2 100 | 364 | ||||||
| 2025-08-13 | 13F | HAP Trading, LLC | Call | 22 900 | 141,05 | 776 | 263,85 | |||
| 2025-08-06 | 13F | AE Wealth Management LLC | 1 299 | 29,00 | 225 | 59,57 | ||||
| 2025-08-01 | 13F | Howard Capital Management Inc. | 1 683 668 | 293 145 | ||||||
| 2025-07-23 | 13F | Kingswood Wealth Advisors, Llc | 2 760 | 479 | ||||||
| 2025-08-14 | 13F | EP Wealth Advisors, Inc. | 3 985 | 9,36 | 691 | 35,23 | ||||
| 2025-08-14 | 13F | Stifel Financial Corp | 2 250 | 2,27 | 390 | 26,62 | ||||
| 2025-07-29 | 13F | Tradewinds Capital Management, LLC | 0 | 0 | ||||||
| 2025-07-24 | 13F | IFP Advisors, Inc | 1 275 | 102,38 | 221 | 151,14 | ||||
| 2025-07-24 | 13F | Strengthening Families & Communities, LLC | 656 | 0,46 | 114 | 24,18 | ||||
| 2025-05-15 | 13F | Tudor Investment Corp Et Al | 0 | −100,00 | 0 | −100,00 | ||||
| 2025-08-13 | 13F | Lido Advisors, LLC | 8 369 | 4,25 | 1 457 | 28,82 | ||||
| 2025-08-08 | 13F | Smithfield Trust Co | 0 | −100,00 | 0 | |||||
| 2025-08-14 | 13F | Mercer Global Advisors Inc /adv | 2 137 | 1,18 | 371 | 25,00 | ||||
| 2025-09-03 | 13F | Q3 Asset Management | 0 | −100,00 | 0 | |||||
| 2025-08-08 | 13F | IMA Wealth, Inc. | 14 | 0,00 | 2 | 100,00 | ||||
| 2025-07-14 | 13F | CRA Financial Services, LLC | 1 231 | 214 | ||||||
| 2025-08-13 | 13F | Millington Financial Advisors, LLC | 4 108 | 4,77 | 765 | 68,65 | ||||
| 2025-08-15 | 13F | Tower Research Capital LLC (TRC) | 44 841 | 10,14 | 7 781 | 40,00 | ||||
| 2025-08-11 | 13F | Wealthspire Advisors, LLC | 1 404 | 244 | ||||||
| 2025-09-04 | 13F/A | Advisor Group Holdings, Inc. | 2 072 | −3,94 | 360 | 18,87 | ||||
| 2025-07-08 | 13F | Silverleafe Capital Partners, LLC | 0 | −100,00 | 0 | |||||
| 2025-08-14 | 13F | Banque Transatlantique SA | 0 | −100,00 | 0 | |||||
| 2025-07-30 | 13F | Wallace Advisory Group, LLC | 6 180 | 8,73 | 868 | −9,50 |