Grundläggande statistik
| Institutionella ägare | 170 total, 170 long only, 0 short only, 0 long/short - change of 17,12% MRQ |
| Genomsnittlig portföljallokering | 0.1897 % - change of −8,58% MRQ |
| Institutionella aktier (lång) | 12 138 541 (ex 13D/G) - change of −1,09MM shares −8,22% MRQ |
| Institutionellt värde (lång) | $ 437 718 USD ($1000) |
Institutionellt ägande och aktieägare
iShares, Inc. - iShares MSCI Global Gold Miners ETF (US:RING) har 170 Institutionella ägare och aktieägare som har lämnat in 13D/G- eller 13F-formulär till Securities Exchange Commission (SEC). Dessa institut innehar totalt 12,138,541 aktier. Största aktieägare inkluderar Envestnet Asset Management Inc, Municipal Employees' Retirement System of Michigan, Schroder Investment Management Group, LPL Financial LLC, Allianz Asset Management GmbH, Morgan Stanley, HighTower Advisors, LLC, Mml Investors Services, Llc, Proficio Capital Partners LLC, and Jpmorgan Chase & Co .
iShares, Inc. - iShares MSCI Global Gold Miners ETF (NasdaqGM:RING) Institutionell ägarstruktur visar institutioners och fonders nuvarande positioner i företaget, samt de senaste förändringarna i positionernas storlek. Större aktieägare kan vara enskilda investerare, fonder, hedgefonder eller institutioner. Bilaga 13D visar att investeraren äger (eller ägde) mer än 5% av företaget och avser (eller avsåg) att aktivt eftersträva en förändring av affärsstrategin. Schedule 13G indikerar en passiv investering på över 5%.
The share price as of September 12, 2025 is 59,40 / share. Previously, on September 13, 2024, the share price was 33,36 / share. This represents an increase of 78,06% over that period.

Fondsentimentets poäng
Fondsentimentet poängen(fka Ägarackumulation-poäng) visar vilka aktier som är mest köpta av fonder. Det är resultatet av en sofistikerad kvantitativ flerfaktormodell som identifierar företag med de högsta nivåerna av institutionell ackumulering. Poängsättningsmodellen använder en kombination av den totala ökningen av redovisade ägare, förändringarna i portföljallokeringarna för dessa ägare och andra mått. Siffran sträcker sig från 0 till 100, där högre siffror indikerar en högre nivå av ackumulering i förhållande till sina konkurrenter, och 50 är genomsnittet.
Uppdateringsfrekvens: Dagligen
Se Ownership Explorer, som innehåller en lista över de högst rankade företagen.
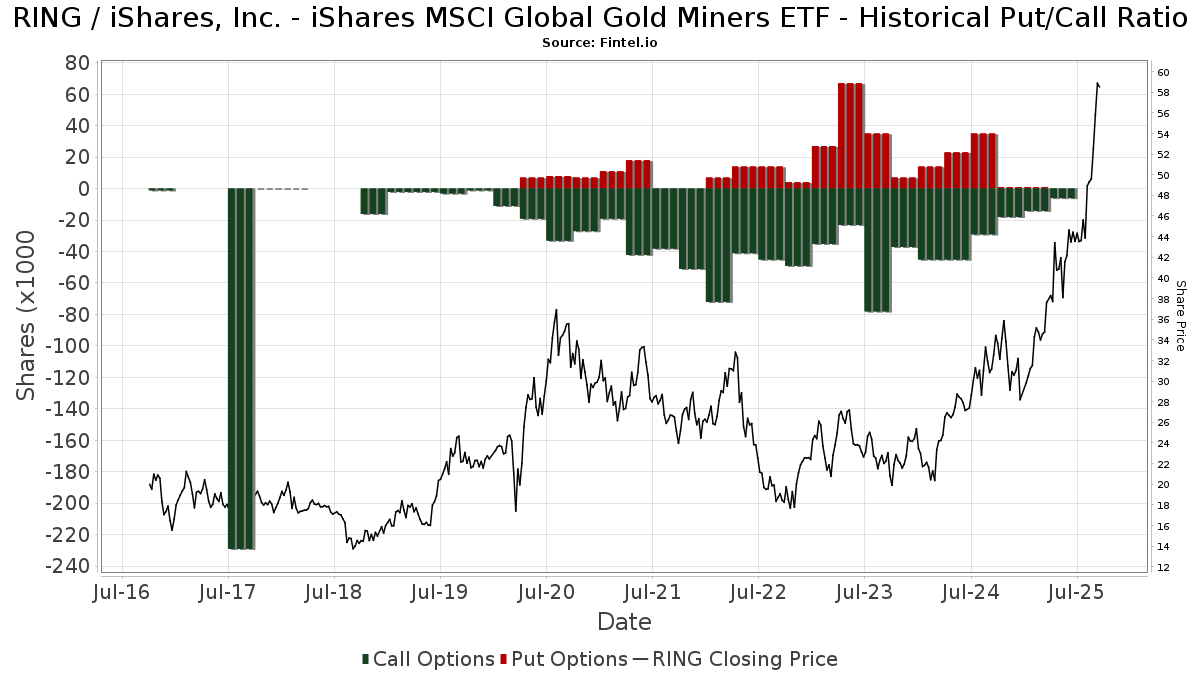
Institutionell sälj/köp-kvot
Förutom att rapportera vanliga eget kapital- och skuldemissioner måste institutioner med mer än 100MM tillgångar under förvaltning också avslöja sina innehav av sälj- och köpoptioner. Eftersom säljoptioner i allmänhet indikerar ett negativt sentiment och köpoptioner indikerar ett positivt sentiment, kan vi få en uppfattning om det övergripande institutionella sentimentet genom att plotta förhållandet mellan säljoptioner och köpoptioner. Diagrammet till höger visar det historiska förhållandet mellan sälj- och köpoptioner för detta instrument.
Genom att använda sälj/köp-kvoten som en indikator på aktieägarnas sentiment undviker man en av de största bristerna med att använda det totala institutionella ägandet, nämligen att en betydande del av de förvaltade tillgångarna investeras passivt för att följa index. Passivt förvaltade fonder köper vanligtvis inte optioner, så indikatorn för sälj/köp-kvoten ger en bättre bild av stämningen i aktivt förvaltade fonder.
13F- och NPORT-arkiveringar
Detaljer om 13F-arkiveringar är gratis. Detaljer om NP-arkiveringar kräver ett premiummedlemskap. Gröna rader indikerar nya positioner. Röda rader indikerar stängda positioner. Klicka på länk symbolen för att se hela transaktionshistoriken.
Uppgradera
för att låsa upp premiumdata och exportera till Excel ![]() .
.
| Fil Datum | Källa | Investerare | Typ | Genomsnittligt pris (beräknat) |
Aktier | Δ Aktier (%) |
Rapporterat värde (1000 USD) |
Δ Värde (%) |
Portföljallokering (%) |
|
|---|---|---|---|---|---|---|---|---|---|---|
| 2025-08-05 | 13F | GPS Wealth Strategies Group, LLC | 16 919 | 315,70 | 741 | 374,36 | ||||
| 2025-08-14 | 13F | Old Mission Capital Llc | 95 083 | 4 163 | ||||||
| 2025-08-08 | 13F | Emerald Investment Partners, Llc | 20 | 1 | ||||||
| 2025-08-12 | 13F | MAI Capital Management | 800 | 0,00 | 35 | 16,67 | ||||
| 2025-08-13 | 13F | Per Stirling Capital Management, LLC. | 10 750 | 471 | ||||||
| 2025-08-14 | 13F | EP Wealth Advisors, Inc. | 4 792 | −24,84 | 210 | −14,34 | ||||
| 2025-08-14 | 13F | Avid Wealth Partners LLC | 84 555 | 5,94 | 3 702 | 20,91 | ||||
| 2025-08-14 | 13F | Fmr Llc | 1 290 | 27,34 | 56 | 47,37 | ||||
| 2025-08-06 | 13F | Black Swift Group, LLC | 0 | −100,00 | 0 | |||||
| 2025-06-03 | 13F | Invst, LLC | 11 023 | −13,24 | 423 | 18,21 | ||||
| 2025-08-14 | 13F | CoreCap Advisors, LLC | 323 | 3,19 | 14 | 16,67 | ||||
| 2025-08-11 | 13F | Wealthgarden F.s. Llc | 6 296 | −5,75 | 275 | 7,42 | ||||
| 2025-08-13 | 13F | Northwestern Mutual Wealth Management Co | 131 640 | 9,10 | 5 763 | 24,52 | ||||
| 2025-05-16 | 13F/A | Goldman Sachs Group Inc | 0 | −100,00 | 0 | −100,00 | ||||
| 2025-08-14 | 13F | Quantinno Capital Management LP | 4 935 | −12,27 | 216 | 0,47 | ||||
| 2025-07-29 | 13F | Manchester Financial Inc | 33 849 | 55,88 | 1 482 | 78,00 | ||||
| 2025-07-09 | 13F | Sandy Cove Advisors, LLC | 16 500 | 0,00 | 722 | 14,24 | ||||
| 2025-08-13 | 13F | Valued Retirements, Inc. | 5 800 | 0,00 | 254 | 13,96 | ||||
| 2025-07-16 | 13F | Magnus Financial Group LLC | 7 351 | −12,16 | 322 | 0,00 | ||||
| 2025-05-14 | 13F | Fisher Asset Management, LLC | 0 | −100,00 | 0 | |||||
| 2025-08-13 | 13F | Twin Peaks Wealth Advisors, LLC | 93 | 5 | ||||||
| 2025-08-26 | NP | BNGLX - Ubs Global Allocation Fund Class A | 66 146 | −12,10 | 2 896 | 0,31 | ||||
| 2025-07-17 | 13F | Keystone Global Partners, LLC | 46 892 | 190,08 | 2 053 | 230,97 | ||||
| 2025-07-31 | 13F | Wealthfront Advisers Llc | 68 487 | 5,21 | 2 998 | 20,06 | ||||
| 2025-08-01 | 13F | Brookwood Investment Group LLC | 0 | −100,00 | 0 | |||||
| 2025-07-30 | 13F | White Lighthouse Investment Management Inc. | 4 738 | 207 | ||||||
| 2025-08-13 | 13F | Providence Capital Advisors, LLC | 766 | 34 | ||||||
| 2025-08-07 | 13F | Nwam Llc | 11 529 | −3,51 | 506 | 10,26 | ||||
| 2025-08-15 | 13F | Morgan Stanley | 585 916 | 2,40 | 25 651 | 16,87 | ||||
| 2025-08-12 | 13F | LPL Financial LLC | 826 193 | 15,42 | 36 171 | 31,73 | ||||
| 2025-08-14 | 13F | Sunbelt Securities, Inc. | 560 | 0,00 | 16 | −28,57 | ||||
| 2025-08-11 | 13F | HighTower Advisors, LLC | 435 035 | 7,05 | 19 046 | 22,17 | ||||
| 2025-08-14 | 13F | Mariner, LLC | 9 316 | 20,92 | 408 | 37,97 | ||||
| 2025-08-06 | 13F | Aspect Partners, LLC | 11 313 | 0,00 | 495 | 14,32 | ||||
| 2025-08-14 | 13F | Atomi Financial Group, Inc. | 7 447 | 326 | ||||||
| 2025-08-12 | 13F | Prudential Plc | 14 050 | −19,07 | 615 | −7,52 | ||||
| 2025-07-30 | 13F | Denali Advisors Llc | 10 481 | −0,40 | 459 | 13,65 | ||||
| 2025-08-11 | 13F | Aptus Capital Advisors, LLC | 2 326 | −24,53 | 102 | −14,41 | ||||
| 2025-08-06 | 13F | Legacy Wealth Managment, LLC/ID | 355 | 0,00 | 16 | 15,38 | ||||
| 2025-07-01 | 13F | Kera Capital Partners, Inc. | 5 057 | 221 | ||||||
| 2025-07-24 | 13F | Blair William & Co/il | 2 826 | 67,62 | 124 | 92,19 | ||||
| 2025-07-21 | 13F | Ameritas Advisory Services, LLC | 1 097 | 48 | ||||||
| 2025-08-06 | 13F | AE Wealth Management LLC | 416 | 0,24 | 18 | 20,00 | ||||
| 2025-05-13 | 13F | E Fund Management Co., Ltd. | 0 | −100,00 | 0 | |||||
| 2025-08-11 | 13F | TD Waterhouse Canada Inc. | 78 079 | 14,01 | 3 417 | 30,48 | ||||
| 2025-08-06 | 13F | Moors & Cabot, Inc. | 19 201 | 841 | ||||||
| 2025-08-14 | 13F | D. E. Shaw & Co., Inc. | 5 125 | 224 | ||||||
| 2025-08-14 | 13F | Raymond James Financial Inc | 161 328 | −27,03 | 7 063 | −16,72 | ||||
| 2025-07-31 | 13F | 3EDGE Asset Management, LP | 39 048 | 33,27 | 1 672 | 49,20 | ||||
| 2025-08-12 | 13F | Steward Partners Investment Advisory, Llc | 2 358 | 103 | ||||||
| 2025-07-31 | 13F | Buckingham Strategic Partners | 0 | −100,00 | 0 | |||||
| 2025-08-12 | 13F | Pathstone Holdings, LLC | 21 940 | −4,36 | 961 | 9,22 | ||||
| 2025-07-14 | 13F | Caitlin John, LLC | 4 626 | 203 | ||||||
| 2025-08-14 | 13F | Banque Transatlantique SA | 0 | −100,00 | 0 | |||||
| 2025-07-30 | 13F | Strategic Blueprint, LLC | 5 467 | 239 | ||||||
| 2025-08-15 | 13F | Kestra Advisory Services, LLC | 5 728 | −0,75 | 251 | 13,12 | ||||
| 2025-07-10 | 13F | Oliver Lagore Vanvalin Investment Group | 1 650 | 0,00 | 63 | 36,96 | ||||
| 2025-08-06 | 13F | SOUTH STATE Corp | 17 508 | 0,00 | 766 | 14,16 | ||||
| 2025-08-05 | 13F | Huntington National Bank | 168 | 16,78 | ||||||
| 2025-07-31 | 13F | 180 Wealth Advisors, Llc | 173 495 | −1,22 | 7 596 | 12,74 | ||||
| 2025-08-14 | 13F | Bnp Paribas Arbitrage, Sa | 128 | 6 | ||||||
| 2025-08-13 | 13F | Colonial Trust Co / SC | 1 529 | 67 | ||||||
| 2025-07-31 | 13F | Briaud Financial Planning, Inc | 438 | 0 | ||||||
| 2025-08-28 | NP | EDGI - 3EDGE Dynamic International Equity ETF | 28 792 | 100,50 | 1 261 | 129,09 | ||||
| 2025-07-25 | 13F | Concurrent Investment Advisors, LLC | 5 386 | 236 | ||||||
| 2025-08-12 | 13F | Global Retirement Partners, LLC | 365 | 10,61 | 16 | 66,67 | ||||
| 2025-07-16 | 13F | Perigon Wealth Management, LLC | 9 875 | 3,95 | 432 | 18,68 | ||||
| 2025-07-31 | 13F | Cambridge Investment Research Advisors, Inc. | 114 229 | 3,93 | 5 | 25,00 | ||||
| 2025-08-05 | 13F | Simplex Trading, Llc | 0 | −100,00 | 0 | |||||
| 2025-08-05 | 13F | Claro Advisors LLC | 0 | −100,00 | 0 | |||||
| 2025-08-06 | 13F | Climber Capital SA | 64 065 | −0,81 | 2 127 | 16,49 | ||||
| 2025-07-24 | 13F | Us Bancorp \de\ | 901 | 0,00 | 39 | 14,71 | ||||
| 2025-08-27 | 13F | Seneca Financial Advisors LLC | 0 | −100,00 | 0 | −100,00 | ||||
| 2025-08-04 | 13F | AlphaStar Capital Management, LLC | 8 878 | 0,00 | 389 | 14,12 | ||||
| 2025-08-06 | 13F | Walkner Condon Financial Advisors LLC | 0 | −100,00 | 0 | |||||
| 2025-07-28 | 13F | Allianz Asset Management GmbH | 654 814 | 72,72 | 28 668 | 97,13 | ||||
| 2025-08-08 | 13F | Cetera Investment Advisers | 205 089 | 1,91 | 8 979 | 16,31 | ||||
| 2025-08-12 | 13F | J.w. Cole Advisors, Inc. | 11 845 | 519 | ||||||
| 2025-08-14 | 13F | Susquehanna International Group, Llp | 17 507 | −11,25 | 766 | 1,32 | ||||
| 2025-08-08 | 13F | Hartland & Co., LLC | 25 | 0,00 | 1 | |||||
| 2025-08-04 | 13F | Creative Financial Designs Inc /adv | 3 086 | −1,78 | 135 | 12,50 | ||||
| 2025-08-14 | 13F | Susquehanna International Group, Llp | Call | 6 800 | −33,98 | 298 | −24,81 | |||
| 2025-08-25 | 13F | Silverlake Wealth Management Llc | 6 788 | −2,22 | 297 | 11,65 | ||||
| 2025-08-14 | 13F | Federation des caisses Desjardins du Quebec | 2 110 | 0,00 | 92 | 15,00 | ||||
| 2025-08-14 | 13F | Integrated Wealth Concepts LLC | 13 140 | 575 | ||||||
| 2025-05-28 | NP | TFAFX - Tactical Growth Allocation Fund Class I | 779 | −49,05 | 30 | −42,00 | ||||
| 2025-07-17 | 13F | LifeGoal Wealth Advisors | 34 140 | 9,70 | 1 495 | 25,23 | ||||
| 2025-08-12 | 13F | Jpmorgan Chase & Co | 247 447 | −5,04 | 10 833 | 8,38 | ||||
| 2025-07-21 | 13F | Synergy Financial Management, LLC | 0 | −100,00 | 0 | |||||
| 2025-07-24 | 13F | Trust Co Of Toledo Na /oh/ | 1 115 | 49 | ||||||
| 2025-08-14 | 13F | Citadel Advisors Llc | Call | 0 | −100,00 | 0 | ||||
| 2025-07-21 | 13F | Portfolio Strategies, Inc. | 6 997 | 306 | ||||||
| 2025-04-21 | 13F | Trivant Custom Portfolio Group, LLC | 0 | −100,00 | 0 | −100,00 | ||||
| 2025-07-31 | 13F | Turning Point Benefit Group, Inc. | 23 485 | 4,10 | 1 028 | 31,29 | ||||
| 2025-07-28 | 13F | Harbour Investments, Inc. | 220 | 0,00 | 10 | 12,50 | ||||
| 2025-08-12 | 13F | CIBC Private Wealth Group, LLC | 102 | 0,00 | 4 | 33,33 | ||||
| 2025-08-14 | 13F | Comerica Bank | 3 808 | −19,20 | 167 | −7,78 | ||||
| 2025-08-19 | 13F | Advisory Services Network, LLC | 24 281 | 9,38 | 1 062 | 24,68 | ||||
| 2025-07-23 | 13F | Gainplan LLC | 35 173 | −38,84 | 1 540 | −30,24 | ||||
| 2025-07-18 | 13F | Trust Co Of Vermont | 645 | 0,00 | 28 | 16,67 | ||||
| 2025-07-30 | 13F | Berkeley Capital Partners, LLC | 12 237 | 65,61 | 536 | 89,05 | ||||
| 2025-08-14 | 13F | Warren Averett Asset Management, LLC | 11 324 | 496 | ||||||
| 2025-07-10 | 13F | Secure Asset Management, LLC | 12 305 | 539 | ||||||
| 2025-08-26 | 13F/A | Thrivent Financial For Lutherans | 39 210 | 2 | ||||||
| 2025-07-17 | 13F | Sound Income Strategies, LLC | 517 | 0,58 | 23 | 15,79 | ||||
| 2025-08-14 | 13F | Stifel Financial Corp | 11 071 | 2,47 | 485 | 16,91 | ||||
| 2025-07-16 | 13F | Strategic Investment Solutions, Inc. /IL | 1 283 | 0,63 | 56 | 16,67 | ||||
| 2025-08-13 | 13F | Amundi | 6 800 | 301 | ||||||
| 2025-08-14 | 13F | Bank Of America Corp /de/ | 177 109 | 10,23 | 7 754 | 25,80 | ||||
| 2025-08-07 | 13F | Evoke Wealth, Llc | 5 209 | 228 | ||||||
| 2025-08-08 | NP | QALTX - Quantified Alternative Investment Fund Investor Class Shares | 3 577 | −64,98 | 157 | −60,10 | ||||
| 2025-08-14 | 13F | Citadel Advisors Llc | Put | 0 | −100,00 | 0 | ||||
| 2025-08-15 | 13F | Prevail Innovative Wealth Advisors, Llc | 13 489 | 591 | ||||||
| 2025-08-14 | 13F | Smartleaf Asset Management LLC | 201 | 9 | ||||||
| 2025-08-06 | 13F | Cloud Capital Management, LLC | 0 | −100,00 | 0 | |||||
| 2025-05-07 | 13F | Bearing Point Capital, Llc | 0 | −100,00 | 0 | |||||
| 2025-08-04 | 13F | Flagship Harbor Advisors, Llc | 104 549 | −1,20 | 4 577 | 12,76 | ||||
| 2025-08-14 | 13F | Citadel Advisors Llc | 11 774 | 515 | ||||||
| 2025-08-01 | 13F | Envestnet Asset Management Inc | 1 562 016 | −1,15 | 68 385 | 12,82 | ||||
| 2025-07-28 | 13F | Copia Wealth Management | 254 | 37,30 | 11 | 57,14 | ||||
| 2025-08-01 | 13F | Bessemer Group Inc | 0 | −100,00 | 0 | |||||
| 2025-05-09 | 13F | Allianz Se | 0 | −100,00 | 0 | −100,00 | ||||
| 2025-08-13 | 13F | Smith, Moore & Co. | 8 836 | 0,00 | 387 | 14,20 | ||||
| 2025-07-25 | 13F | Atria Wealth Solutions, Inc. | 0 | −100,00 | 0 | |||||
| 2025-08-12 | 13F | Clearwater Capital Advisors, LLC | 37 563 | −25,58 | 1 645 | −15,08 | ||||
| 2025-08-29 | NP | GDMA - Gadsden Dynamic Multi-Asset ETF | 111 063 | 76,35 | 4 862 | 101,33 | ||||
| 2025-07-25 | 13F | Almanack Investment Partners, LLC. | 20 669 | 24,71 | 905 | 42,36 | ||||
| 2025-08-11 | 13F | Regal Investment Advisors LLC | 8 385 | −6,18 | 367 | 7,31 | ||||
| 2025-07-30 | 13F | Wbh Advisory Inc | 34 218 | −3,80 | 1 498 | 9,82 | ||||
| 2025-08-08 | 13F | Avantax Advisory Services, Inc. | 4 948 | −21,54 | 217 | −10,37 | ||||
| 2025-08-07 | 13F | Proficio Capital Partners LLC | 287 485 | 1,01 | 12 586 | 36,54 | ||||
| 2025-08-14 | 13F | UBS Group AG | 166 760 | 2,42 | 7 301 | 16,89 | ||||
| 2025-08-11 | 13F | Principal Securities, Inc. | 125 | 5 | ||||||
| 2025-08-11 | 13F | Empowered Funds, LLC | 111 364 | 76,83 | 4 876 | 101,86 | ||||
| 2025-08-12 | 13F | BlackRock, Inc. | 965 | 793,52 | 42 | 950,00 | ||||
| 2025-07-14 | 13F | Whitener Capital Management, Inc. | 5 000 | 219 | ||||||
| 2025-08-08 | 13F | Pnc Financial Services Group, Inc. | 1 176 | 38,35 | 52 | 59,38 | ||||
| 2025-08-04 | 13F | Assetmark, Inc | 61 | −24,69 | 3 | −33,33 | ||||
| 2025-08-14 | 13F | Crestmont Private Wealth LLC | 7 246 | −2,54 | 317 | 11,23 | ||||
| 2025-07-14 | 13F | Park Avenue Securities Llc | 108 164 | −2,24 | 5 | 0,00 | ||||
| 2025-05-14 | 13F | Truvestments Capital Llc | 0 | −100,00 | 0 | |||||
| 2025-08-11 | 13F | Citigroup Inc | 56 189 | 0,00 | 2 460 | 14,11 | ||||
| 2025-08-04 | 13F | Municipal Employees' Retirement System of Michigan | 1 372 210 | −27,85 | 60 | −16,67 | ||||
| 2025-07-29 | 13F | Private Wealth Management Group, LLC | 580 | 383,33 | 25 | 525,00 | ||||
| 2025-07-25 | 13F | RHS Financial, LLC | 71 939 | 11,74 | 3 149 | 27,54 | ||||
| 2025-08-06 | 13F | Legacy Investment Solutions, LLC | 355 | 16 | ||||||
| 2025-07-15 | 13F | Main Street Group, LTD | 300 | −57,14 | 13 | −50,00 | ||||
| 2025-08-05 | 13F | Advisors Preferred, LLC | 3 577 | −64,98 | 157 | −60,10 | ||||
| 2025-07-24 | 13F | IFP Advisors, Inc | 50 | 11,11 | 2 | 100,00 | ||||
| 2025-08-14 | 13F | Syon Capital Llc | 194 047 | −14,55 | 8 495 | −2,48 | ||||
| 2025-07-14 | 13F | Financial Enhancement Group LLC | 18 302 | −4,37 | 808 | 0,12 | ||||
| 2025-08-14 | 13F | IHT Wealth Management, LLC | 9 478 | −5,29 | 415 | 8,09 | ||||
| 2025-07-24 | 13F | Williams & Novak, LLC | 27 402 | −29,54 | 1 200 | −19,53 | ||||
| 2025-08-08 | 13F | Family Firm, Inc. | 44 655 | −1,12 | 1 955 | 12,88 | ||||
| 2025-08-14 | 13F | Boston Private Wealth Llc | 0 | −100,00 | 0 | |||||
| 2025-04-14 | 13F | Umb Bank N A/mo | 0 | −100,00 | 0 | |||||
| 2025-08-13 | 13F | EverSource Wealth Advisors, LLC | 2 284 | 100 | ||||||
| 2025-05-02 | 13F | Cullen/frost Bankers, Inc. | 0 | −100,00 | 0 | |||||
| 2025-08-18 | 13F/A | National Bank Of Canada /fi/ | 283 | 12 | ||||||
| 2025-08-20 | 13F/A | Thompson Davis & Co., Inc. | 5 027 | −20,33 | 220 | −9,09 | ||||
| 2025-08-06 | 13F | Commonwealth Equity Services, Llc | 61 234 | 2,77 | 3 | 0,00 | ||||
| 2025-08-04 | 13F | Creekmur Asset Management LLC | 2 | 0,00 | 0 | |||||
| 2025-08-13 | 13F | Marshall Wace, Llp | 0 | −100,00 | 0 | |||||
| 2025-08-13 | 13F | Victory Capital Management Inc | 88 799 | 3 888 | ||||||
| 2025-08-18 | 13F | Tactive Advisors, LLC | 11 891 | 521 | ||||||
| 2025-08-14 | 13F | Group One Trading, L.p. | 100 | 0,00 | 4 | 33,33 | ||||
| 2025-08-07 | 13F | Guardian Partners Inc. | 46 300 | −87,35 | 2 027 | −86,41 | ||||
| 2025-07-10 | 13F | Wealth Enhancement Advisory Services, Llc | 4 810 | 214 | ||||||
| 2025-07-25 | NP | USAGX - Precious Metals and Minerals Fund Shares | 88 799 | 3 757 | ||||||
| 2025-07-17 | 13F | Park Place Capital Corp | 54 | 0,00 | 2 | 0,00 | ||||
| 2025-08-14 | 13F | GWM Advisors LLC | 16 058 | 42,23 | 703 | 62,12 | ||||
| 2025-05-14 | 13F | Flow Traders U.s. Llc | 0 | −100,00 | 0 | |||||
| 2025-08-14 | 13F | Mml Investors Services, Llc | 387 035 | −5,44 | 17 | 6,67 | ||||
| 2025-09-04 | 13F/A | Advisor Group Holdings, Inc. | 45 847 | 11,93 | 2 007 | 27,75 | ||||
| 2025-07-15 | 13F | Fifth Third Bancorp | 0 | −100,00 | 0 | |||||
| 2025-08-13 | 13F | Schroder Investment Management Group | 1 216 985 | −42,99 | 51 722 | −36,40 | ||||
| 2025-08-14 | 13F | Royal Bank Of Canada | 102 088 | −69,10 | 4 469 | −64,74 | ||||
| 2025-08-06 | 13F | Mark Sheptoff Financial Planning, Llc | 950 | 0,00 | 42 | 13,89 | ||||
| 2025-05-13 | 13F | Heck Capital Advisors, LLC | 0 | −100,00 | 0 | −100,00 | ||||
| 2025-07-17 | 13F | Hanson & Doremus Investment Management | 1 289 | 0,00 | 0 | |||||
| 2025-08-08 | 13F | Gts Securities Llc | 0 | −100,00 | 0 | |||||
| 2025-07-25 | 13F | Envestnet Portfolio Solutions, Inc. | 29 722 | −46,80 | 1 301 | −39,29 | ||||
| 2025-08-06 | 13F | Founders Financial Securities Llc | 12 192 | −2,40 | 534 | 3,70 | ||||
| 2025-08-12 | 13F | Proequities, Inc. | 0 | 0 | ||||||
| 2025-08-19 | 13F | Newbridge Financial Services Group, Inc. | 7 447 | 326 | ||||||
| 2025-08-05 | 13F | Bank Of Montreal /can/ | 51 968 | 2,30 | 2 275 | 16,79 | ||||
| 2025-07-24 | 13F | Comprehensive Money Management Services LLC | 22 175 | −2,80 | 971 | 10,86 | ||||
| 2025-04-30 | 13F | Stratos Wealth Advisors, LLC | 0 | −100,00 | 0 | −100,00 | ||||
| 2025-07-07 | 13F | Versant Capital Management, Inc | 76 440 | 1,25 | 3 347 | 15,54 | ||||
| 2025-07-30 | 13F | Eqis Capital Management, Inc. | 13 432 | −3,63 | 588 | 10,11 | ||||
| 2025-08-11 | 13F | Comprehensive Wealth Management, LLC | 33 048 | 22,65 | 1 447 | 39,98 | ||||
| 2025-08-13 | 13F | Jones Financial Companies Lllp | 14 799 | 38,87 | 629 | 54,68 | ||||
| 2025-08-14 | 13F | Boothbay Fund Management, Llc | 5 600 | 245 | ||||||
| 2025-08-14 | 13F | Jane Street Group, Llc | 121 795 | 5 332 | ||||||
| 2025-07-30 | 13F | Roman Butler Fullerton & Co | 4 832 | 0,29 | 220 | 8,37 | ||||
| 2025-08-08 | 13F | Creative Planning | 5 967 | −33,68 | 261 | −24,35 | ||||
| 2025-08-14 | 13F | Qube Research & Technologies Ltd | 16 | 0,00 | 1 | |||||
| 2025-07-29 | 13F | Beverly Hills Private Wealth, LLC | 38 298 | −6,43 | 1 677 | 6,75 | ||||
| 2025-08-14 | 13F | Ubs Asset Management Americas Inc | 66 146 | −12,10 | 2 896 | 0,31 | ||||
| 2025-08-07 | 13F | Allworth Financial LP | 694 | 30 | ||||||
| 2025-07-25 | 13F | Sequoia Financial Advisors, LLC | 36 110 | 3,86 | 1 581 | 18,53 | ||||
| 2025-05-09 | 13F | GeoWealth Management, LLC | 0 | −100,00 | 0 | |||||
| 2025-08-14 | 13F | Wells Fargo & Company/mn | 226 096 | 3,84 | 9 898 | 18,51 | ||||
| 2025-07-30 | 13F | LGT Financial Advisors LLC | 192 | −13,90 | 8 | 0,00 |
Other Listings
| MX:RING |