Grundläggande statistik
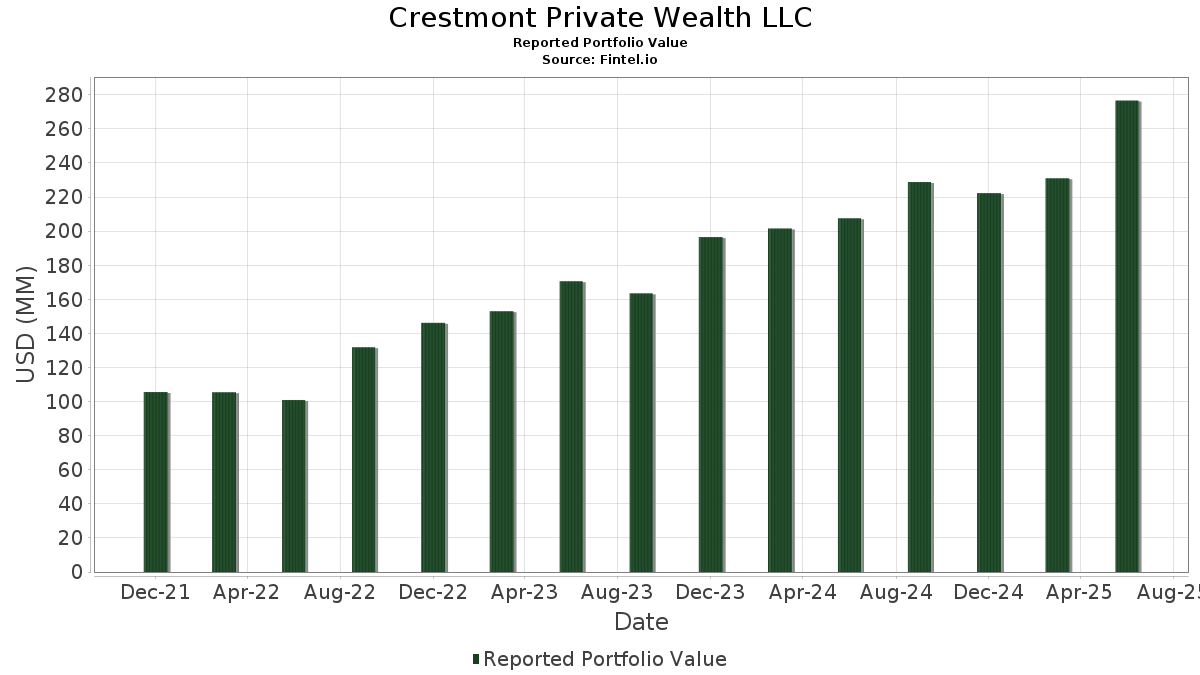
| Portföljvärde | $ 276 610 660 |
| Aktuella positioner | 83 |
Senaste innehav, resultat, förvaltat kapital (från 13F, 13D)
Crestmont Private Wealth LLC har redovisat 83 totala innehav i sina senaste SEC-arkiveringar. Det senaste portföljvärdet beräknas vara $ 276 610 660 USD. Faktiskt förvaltade tillgångar (AUM) är detta värde plus likvida medel (som inte redovisas). Crestmont Private Wealth LLCs största innehav är iShares Trust - iShares Core S&P 500 ETF (US:IVV) , Vanguard Index Funds - Vanguard S&P 500 ETF (US:VOO) , PIMCO ETF Trust - PIMCO Multisector Bond Active Exchange-Traded Fund (US:PYLD) , PIMCO ETF Trust - PIMCO Active Bond Exchange-Traded Fund (US:BOND) , and Vanguard International Equity Index Funds - Vanguard FTSE Emerging Markets ETF (US:VWO) . Crestmont Private Wealth LLCs nya positioner inkluderar PIMCO ETF Trust - PIMCO Active Bond Exchange-Traded Fund (US:BOND) , PIMCO ETF Trust - PIMCO Intermediate Municipal Bond Active Exchange-Traded Fund (US:MUNI) , iShares Trust - iShares Russell 1000 ETF (US:IWB) , .
Största ökningarna detta kvartal
Vi använder förändringen i portföljallokeringen eftersom det är det mest meningsfulla måttet. Förändringar kan bero på transaktioner eller förändringar i aktiekurser.
| Värdepapper | Aktier (MM) |
Värde (MM$) |
Portfölj % av | ΔPortfölj % av |
|---|---|---|---|---|
| 0,18 | 16,61 | 6,0036 | 6,0036 | |
| 0,18 | 9,30 | 3,3607 | 3,3607 | |
| 0,00 | 1,54 | 0,5551 | 0,5551 | |
| 0,00 | 0,25 | 0,0895 | 0,0895 | |
| 0,00 | 0,23 | 0,0846 | 0,0846 | |
| 0,00 | 0,23 | 0,0833 | 0,0833 | |
| 0,00 | 0,22 | 0,0800 | 0,0800 | |
| 0,00 | 0,22 | 0,0789 | 0,0789 | |
| 0,00 | 0,22 | 0,0781 | 0,0781 | |
| 0,00 | 0,21 | 0,0767 | 0,0767 |
Största minskningarna detta kvartal
Vi använder förändringen i portföljallokeringen eftersom det är det mest meningsfulla måttet. Förändringar kan bero på transaktioner eller förändringar i aktiepriser.
| Värdepapper | Aktier (MM) |
Värde (MM$) |
Portfölj % av | ΔPortfölj % av |
|---|---|---|---|---|
| 0,10 | 61,63 | 22,2790 | −2,3234 | |
| 1,09 | 28,91 | 10,4506 | −1,8657 | |
| 0,09 | 53,71 | 19,4185 | −1,1497 | |
| 0,23 | 11,61 | 4,1987 | −0,7537 | |
| 0,33 | 7,73 | 2,7928 | −0,6837 | |
| 0,19 | 10,07 | 3,6406 | −0,5257 | |
| 0,29 | 14,27 | 5,1578 | −0,4848 | |
| 0,11 | 6,96 | 2,5169 | −0,3525 | |
| 0,25 | 14,05 | 5,0776 | −0,3230 | |
| 0,04 | 4,59 | 1,6600 | −0,2835 |
13F- och fond arkiveringar
Denna blankett lämnades in den 2025-08-14 för rapporteringsperioden 2025-06-30. Klicka på länksymbolen för att se hela transaktionshistoriken.
Uppgradera för att låsa upp premiumdata och exportera till Excel![]() .
.
| Värdepapper | Typ | Genomsnittligt aktiepris | Aktier (MM) |
ΔAktier (%) |
ΔAktier (%) |
Värde ($MM) |
Portfölj (%) |
ΔPortfölj (%) |
|
|---|---|---|---|---|---|---|---|---|---|
| IVV / iShares Trust - iShares Core S&P 500 ETF | 0,10 | −1,87 | 61,63 | 8,44 | 22,2790 | −2,3234 | |||
| VOO / Vanguard Index Funds - Vanguard S&P 500 ETF | 0,09 | 2,28 | 53,71 | 13,05 | 19,4185 | −1,1497 | |||
| PYLD / PIMCO ETF Trust - PIMCO Multisector Bond Active Exchange-Traded Fund | 1,09 | 0,88 | 28,91 | 1,61 | 10,4506 | −1,8657 | |||
| BOND / PIMCO ETF Trust - PIMCO Active Bond Exchange-Traded Fund | 0,18 | 16,61 | 6,0036 | 6,0036 | |||||
| VWO / Vanguard International Equity Index Funds - Vanguard FTSE Emerging Markets ETF | 0,29 | 0,16 | 14,27 | 9,46 | 5,1578 | −0,4848 | |||
| VEA / Vanguard Tax-Managed Funds - Vanguard FTSE Developed Markets ETF | 0,25 | 0,38 | 14,05 | 12,59 | 5,0776 | −0,3230 | |||
| JPST / J.P. Morgan Exchange-Traded Fund Trust - JPMorgan Ultra-Short Income ETF | 0,23 | 1,42 | 11,61 | 1,52 | 4,1987 | −0,7537 | |||
| DFAT / Dimensional ETF Trust - Dimensional U.S. Targeted Value ETF | 0,19 | −0,15 | 10,07 | 4,65 | 3,6406 | −0,5257 | |||
| MUNI / PIMCO ETF Trust - PIMCO Intermediate Municipal Bond Active Exchange-Traded Fund | 0,18 | 9,30 | 3,3607 | 3,3607 | |||||
| DFAR / Dimensional ETF Trust - Dimensional US Real Estate ETF | 0,33 | −2,53 | 7,73 | −3,80 | 2,7928 | −0,6837 | |||
| IJH / iShares Trust - iShares Core S&P Mid-Cap ETF | 0,11 | −1,18 | 6,96 | 5,04 | 2,5169 | −0,3525 | |||
| IJR / iShares Trust - iShares Core S&P Small-Cap ETF | 0,04 | −2,14 | 4,59 | 2,27 | 1,6600 | −0,2835 | |||
| IBDQ / iShares Trust - iShares iBonds Dec 2025 Term Corporate ETF | 0,07 | 2,32 | 1,86 | 2,42 | 0,6731 | −0,1137 | |||
| IBTF / iShares Trust - iShares iBonds Dec 2025 Term Treasury ETF | 0,08 | 2,05 | 1,85 | 1,99 | 0,6678 | −0,1161 | |||
| IWB / iShares Trust - iShares Russell 1000 ETF | 0,00 | 1,54 | 0,5551 | 0,5551 | |||||
| V / Visa Inc. | 0,00 | 7,05 | 0,99 | 8,42 | 0,3585 | −0,0373 | |||
| GOOGL / Alphabet Inc. | 0,01 | 6,51 | 0,94 | 21,47 | 0,3396 | 0,0046 | |||
| GDXJ / VanEck ETF Trust - VanEck Junior Gold Miners ETF | 0,01 | −2,55 | 0,89 | 15,19 | 0,3210 | −0,0128 | |||
| SPGI / S&P Global Inc. | 0,00 | 2,19 | 0,89 | 5,98 | 0,3206 | −0,0414 | |||
| VRSN / VeriSign, Inc. | 0,00 | 7,80 | 0,89 | 22,71 | 0,3204 | 0,0075 | |||
| NDAQ / Nasdaq, Inc. | 0,01 | 5,86 | 0,87 | 24,86 | 0,3142 | 0,0127 | |||
| ICE / Intercontinental Exchange, Inc. | 0,00 | 6,60 | 0,82 | 13,36 | 0,2976 | −0,0167 | |||
| BRK.B / Berkshire Hathaway Inc. | 0,00 | 9,35 | 0,78 | −0,26 | 0,2813 | −0,0564 | |||
| MKL / Markel Group Inc. | 0,00 | 10,54 | 0,77 | 17,99 | 0,2802 | −0,0039 | |||
| ITW / Illinois Tool Works Inc. | 0,00 | 6,80 | 0,77 | 6,48 | 0,2794 | −0,0348 | |||
| MLI / Mueller Industries, Inc. | 0,01 | 1,99 | 0,77 | 6,50 | 0,2786 | −0,0348 | |||
| AAPL / Apple Inc. | 0,00 | 8,42 | 0,75 | 0,13 | 0,2695 | −0,0528 | |||
| DGX / Quest Diagnostics Incorporated | 0,00 | 10,38 | 0,74 | 17,25 | 0,2680 | −0,0059 | |||
| VRSK / Verisk Analytics, Inc. | 0,00 | 10,16 | 0,70 | 15,35 | 0,2528 | −0,0098 | |||
| MCO / Moody's Corporation | 0,00 | 8,48 | 0,70 | 16,89 | 0,2528 | −0,0063 | |||
| HD / The Home Depot, Inc. | 0,00 | 7,13 | 0,69 | 7,26 | 0,2509 | −0,0294 | |||
| NVDA / NVIDIA Corporation | 0,00 | −37,09 | 0,69 | −8,36 | 0,2500 | −0,0765 | |||
| AZO / AutoZone, Inc. | 0,00 | 9,88 | 0,66 | 6,97 | 0,2389 | −0,0285 | |||
| MA / Mastercard Incorporated | 0,00 | 4,47 | 0,66 | 7,01 | 0,2375 | −0,0280 | |||
| TH / Target Hospitality Corp. | 0,09 | 0,00 | 0,64 | 8,11 | 0,2316 | −0,0247 | |||
| AVGO / Broadcom Inc. | 0,00 | 1,73 | 0,63 | 67,37 | 0,2284 | 0,0651 | |||
| ROP / Roper Technologies, Inc. | 0,00 | 14,08 | 0,62 | 9,67 | 0,2258 | −0,0207 | |||
| CVX / Chevron Corporation | 0,00 | 0,00 | 0,62 | −14,48 | 0,2244 | −0,0895 | |||
| STEL / Stellar Bancorp, Inc. | 0,02 | −15,55 | 0,61 | −14,63 | 0,2198 | −0,0883 | |||
| ADSK / Autodesk, Inc. | 0,00 | 2,34 | 0,58 | 21,00 | 0,2106 | 0,0022 | |||
| QCOM / QUALCOMM Incorporated | 0,00 | 4,52 | 0,53 | 8,38 | 0,1916 | −0,0201 | |||
| NVR / NVR, Inc. | 0,00 | 10,94 | 0,52 | 13,17 | 0,1896 | −0,0111 | |||
| MSCI / MSCI Inc. | 0,00 | 12,03 | 0,52 | 14,29 | 0,1883 | −0,0090 | |||
| COP / ConocoPhillips | 0,01 | 0,02 | 0,50 | −14,55 | 0,1805 | −0,0724 | |||
| LRCX / Lam Research Corporation | 0,01 | 6,28 | 0,49 | 42,32 | 0,1776 | 0,0281 | |||
| IDXX / IDEXX Laboratories, Inc. | 0,00 | 5,46 | 0,49 | 34,63 | 0,1761 | 0,0195 | |||
| SCHX / Schwab Strategic Trust - Schwab U.S. Large-Cap ETF | 0,02 | 7,02 | 0,48 | 18,34 | 0,1753 | −0,0019 | |||
| ADBE / Adobe Inc. | 0,00 | 3,93 | 0,46 | 4,78 | 0,1666 | −0,0237 | |||
| GLD / SPDR Gold Trust | 0,00 | −2,51 | 0,44 | 3,06 | 0,1585 | −0,0255 | |||
| GDX / VanEck ETF Trust - VanEck Gold Miners ETF | 0,01 | −2,56 | 0,43 | 10,43 | 0,1571 | −0,0134 | |||
| PH / Parker-Hannifin Corporation | 0,00 | 0,00 | 0,39 | 14,87 | 0,1427 | −0,0060 | |||
| NEM / Newmont Corporation | 0,01 | −2,42 | 0,38 | 17,76 | 0,1369 | −0,0023 | |||
| CAT / Caterpillar Inc. | 0,00 | 0,33 | 0,35 | 18,18 | 0,1270 | −0,0018 | |||
| GILD / Gilead Sciences, Inc. | 0,00 | −19,52 | 0,32 | −20,35 | 0,1162 | −0,0585 | |||
| RING / iShares, Inc. - iShares MSCI Global Gold Miners ETF | 0,01 | −2,54 | 0,32 | 11,23 | 0,1147 | −0,0088 | |||
| EMR / Emerson Electric Co. | 0,00 | 0,47 | 0,31 | 22,18 | 0,1138 | 0,0023 | |||
| HAS / Hasbro, Inc. | 0,00 | 1,19 | 0,31 | 21,43 | 0,1108 | 0,0016 | |||
| NFLX / Netflix, Inc. | 0,00 | 4,65 | 0,30 | 50,50 | 0,1089 | 0,0221 | |||
| EOG / EOG Resources, Inc. | 0,00 | 0,90 | 0,30 | −5,73 | 0,1071 | −0,0292 | |||
| SNA / Snap-on Incorporated | 0,00 | 0,64 | 0,30 | −7,23 | 0,1069 | −0,0309 | |||
| PSA / Public Storage | 0,00 | 0,31 | 0,28 | −1,39 | 0,1024 | −0,0223 | |||
| PKG / Packaging Corporation of America | 0,00 | 0,47 | 0,28 | −4,44 | 0,1015 | −0,0256 | |||
| LMT / Lockheed Martin Corporation | 0,00 | 0,51 | 0,27 | 4,21 | 0,0985 | −0,0147 | |||
| PG / The Procter & Gamble Company | 0,00 | 1,73 | 0,26 | −5,07 | 0,0950 | −0,0246 | |||
| AMGN / Amgen Inc. | 0,00 | 0,55 | 0,26 | −9,86 | 0,0926 | −0,0304 | |||
| RL / Ralph Lauren Corporation | 0,00 | 0,00 | 0,25 | 24,02 | 0,0918 | 0,0033 | |||
| PRU / Prudential Financial, Inc. | 0,00 | −0,93 | 0,25 | −4,53 | 0,0915 | −0,0235 | |||
| XOM / Exxon Mobil Corporation | 0,00 | 0,00 | 0,25 | −9,39 | 0,0910 | −0,0292 | |||
| TSLA / Tesla, Inc. | 0,00 | 0,25 | 0,0895 | 0,0895 | |||||
| META / Meta Platforms, Inc. | 0,00 | 0,23 | 0,0846 | 0,0846 | |||||
| XOP / SPDR Series Trust - SPDR S&P Oil & Gas Exploration & Production ETF | 0,00 | −2,52 | 0,23 | −6,80 | 0,0844 | −0,0242 | |||
| IBM / International Business Machines Corporation | 0,00 | 0,23 | 0,0833 | 0,0833 | |||||
| LYV / Live Nation Entertainment, Inc. | 0,00 | 0,22 | 0,0800 | 0,0800 | |||||
| CBRE / CBRE Group, Inc. | 0,00 | 0,22 | 0,0789 | 0,0789 | |||||
| GE / General Electric Company | 0,00 | 0,22 | 0,0781 | 0,0781 | |||||
| JPM / JPMorgan Chase & Co. | 0,00 | 0,21 | 0,0767 | 0,0767 | |||||
| UAL / United Airlines Holdings, Inc. | 0,00 | 0,21 | 0,0761 | 0,0761 | |||||
| UPS / United Parcel Service, Inc. | 0,00 | 9,56 | 0,21 | 0,98 | 0,0748 | −0,0143 | |||
| RSG / Republic Services, Inc. | 0,00 | 0,00 | 0,21 | 1,99 | 0,0742 | −0,0131 | |||
| PSX / Phillips 66 | 0,00 | 0,00 | 0,20 | −3,35 | 0,0732 | −0,0175 | |||
| GRMN / Garmin Ltd. | 0,00 | 0,00 | 0,20 | −3,83 | 0,0729 | −0,0179 | |||
| F_KZ / Ford Motor Company | 0,01 | −1,78 | 0,12 | 6,19 | 0,0434 | −0,0055 | |||
| EGY / VAALCO Energy, Inc. | 0,01 | 0,00 | 0,04 | −4,88 | 0,0143 | −0,0035 | |||
| TMUS / T-Mobile US, Inc. | 0,00 | −100,00 | 0,00 | 0,0000 | |||||
| FOX / Fox Corporation | 0,00 | −100,00 | 0,00 | 0,0000 | |||||
| TPL / Texas Pacific Land Corporation | 0,00 | −100,00 | 0,00 | 0,0000 | |||||
| LYB / LyondellBasell Industries N.V. | 0,00 | −100,00 | 0,00 | 0,0000 | |||||
| CTRA / Coterra Energy Inc. | 0,00 | −100,00 | 0,00 | 0,0000 |