Grundläggande statistik
| Institutionella ägare | 244 total, 244 long only, 0 short only, 0 long/short - change of −2,38% MRQ |
| Genomsnittlig portföljallokering | 0.2452 % - change of −9,97% MRQ |
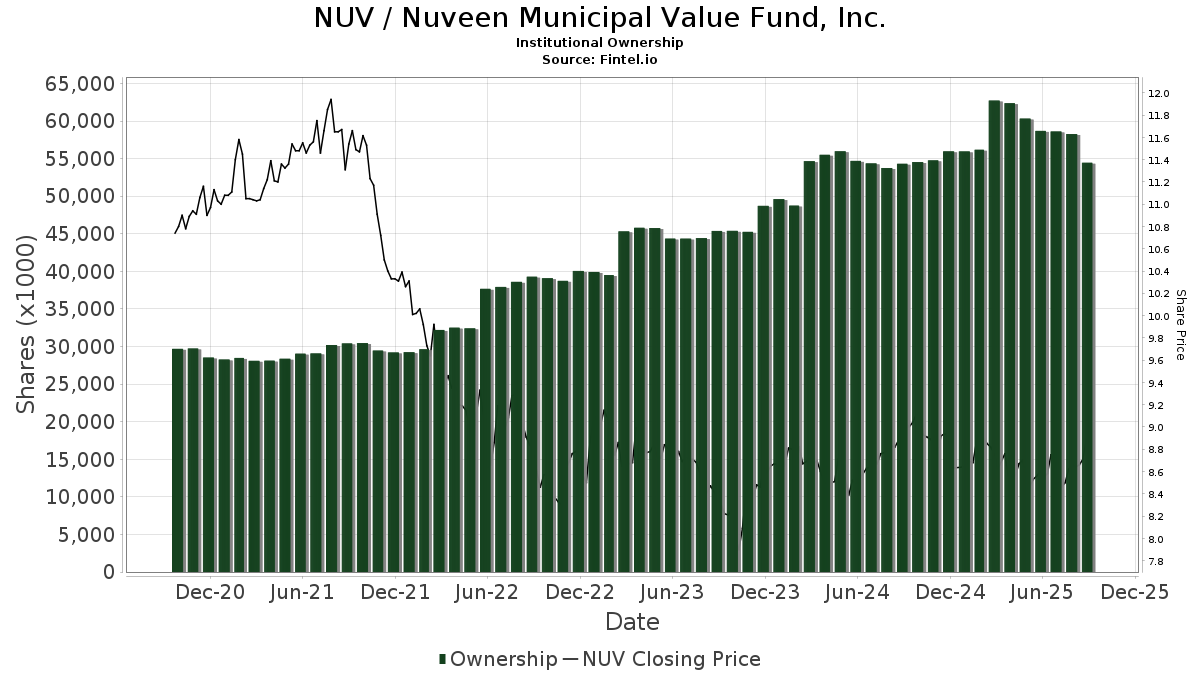
| Institutionella aktier (lång) | 54 447 775 (ex 13D/G) - change of −4,17MM shares −7,12% MRQ |
| Institutionellt värde (lång) | $ 454 004 USD ($1000) |
Institutionellt ägande och aktieägare
Nuveen Municipal Value Fund, Inc. (US:NUV) har 244 Institutionella ägare och aktieägare som har lämnat in 13D/G- eller 13F-formulär till Securities Exchange Commission (SEC). Dessa institut innehar totalt 54,447,775 aktier. Största aktieägare inkluderar UBS Group AG, Rivernorth Capital Management, Llc, Morgan Stanley, Kovitz Investment Group Partners, LLC, 1607 Capital Partners, LLC, Hennion & Walsh Asset Management, Inc., Wells Fargo & Company/mn, Raymond James Financial Inc, Guggenheim Capital Llc, and LPL Financial LLC .
Nuveen Municipal Value Fund, Inc. (NYSE:NUV) Institutionell ägarstruktur visar institutioners och fonders nuvarande positioner i företaget, samt de senaste förändringarna i positionernas storlek. Större aktieägare kan vara enskilda investerare, fonder, hedgefonder eller institutioner. Bilaga 13D visar att investeraren äger (eller ägde) mer än 5% av företaget och avser (eller avsåg) att aktivt eftersträva en förändring av affärsstrategin. Schedule 13G indikerar en passiv investering på över 5%.
The share price as of September 12, 2025 is 8,92 / share. Previously, on September 16, 2024, the share price was 9,07 / share. This represents a decline of 1,65% over that period.
Fondsentimentets poäng
Fondsentimentet poängen(fka Ägarackumulation-poäng) visar vilka aktier som är mest köpta av fonder. Det är resultatet av en sofistikerad kvantitativ flerfaktormodell som identifierar företag med de högsta nivåerna av institutionell ackumulering. Poängsättningsmodellen använder en kombination av den totala ökningen av redovisade ägare, förändringarna i portföljallokeringarna för dessa ägare och andra mått. Siffran sträcker sig från 0 till 100, där högre siffror indikerar en högre nivå av ackumulering i förhållande till sina konkurrenter, och 50 är genomsnittet.
Uppdateringsfrekvens: Dagligen
Se Ownership Explorer, som innehåller en lista över de högst rankade företagen.
Institutionell sälj/köp-kvot
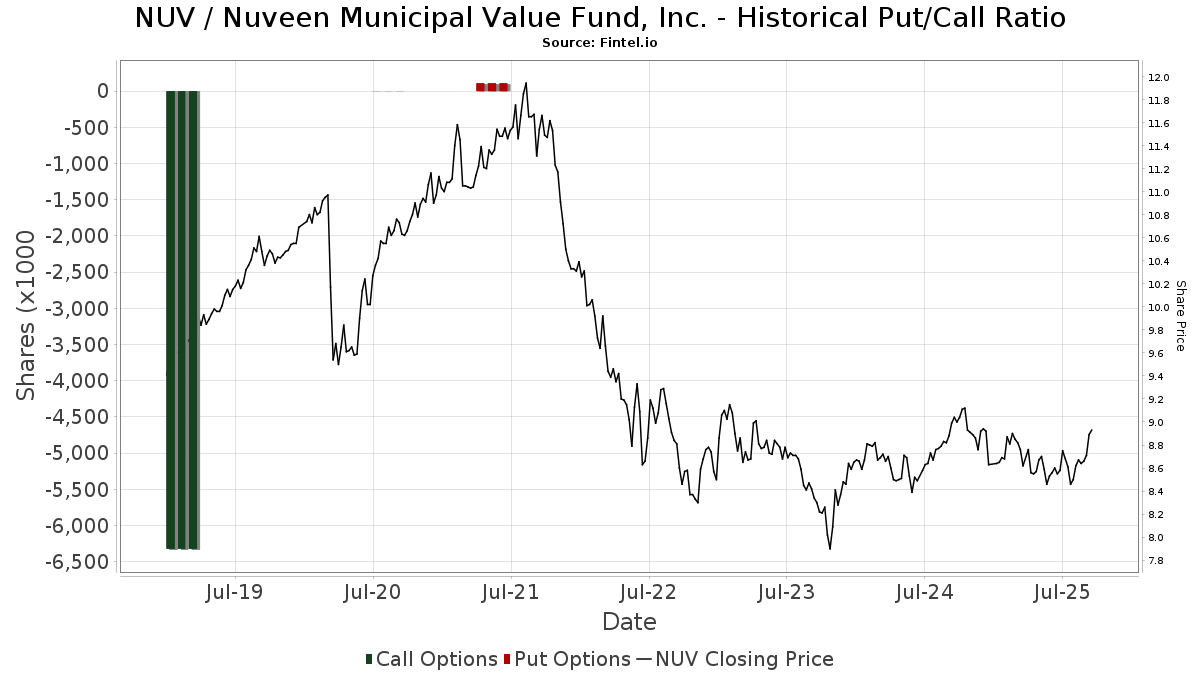
Förutom att rapportera vanliga eget kapital- och skuldemissioner måste institutioner med mer än 100MM tillgångar under förvaltning också avslöja sina innehav av sälj- och köpoptioner. Eftersom säljoptioner i allmänhet indikerar ett negativt sentiment och köpoptioner indikerar ett positivt sentiment, kan vi få en uppfattning om det övergripande institutionella sentimentet genom att plotta förhållandet mellan säljoptioner och köpoptioner. Diagrammet till höger visar det historiska förhållandet mellan sälj- och köpoptioner för detta instrument.
Genom att använda sälj/köp-kvoten som en indikator på aktieägarnas sentiment undviker man en av de största bristerna med att använda det totala institutionella ägandet, nämligen att en betydande del av de förvaltade tillgångarna investeras passivt för att följa index. Passivt förvaltade fonder köper vanligtvis inte optioner, så indikatorn för sälj/köp-kvoten ger en bättre bild av stämningen i aktivt förvaltade fonder.
13F- och NPORT-arkiveringar
Detaljer om 13F-arkiveringar är gratis. Detaljer om NP-arkiveringar kräver ett premiummedlemskap. Gröna rader indikerar nya positioner. Röda rader indikerar stängda positioner. Klicka på länk symbolen för att se hela transaktionshistoriken.
Uppgradera
för att låsa upp premiumdata och exportera till Excel ![]() .
.
| Fil Datum | Källa | Investerare | Typ | Genomsnittligt pris (beräknat) |
Aktier | Δ Aktier (%) |
Rapporterat värde (1000 USD) |
Δ Värde (%) |
Portföljallokering (%) |
|
|---|---|---|---|---|---|---|---|---|---|---|
| 2025-08-01 | 13F | James Investment Research Inc | 54 116 | 0,00 | 470 | −0,84 | ||||
| 2025-07-25 | 13F | Dynamic Financial Group | 153 522 | 47,53 | 1 334 | 46,27 | ||||
| 2025-08-13 | 13F | Millstone Evans Group, LLC | 500 | 0,00 | 4 | 0,00 | ||||
| 2025-08-01 | 13F | Oarsman Capital, Inc. | 10 692 | −17,39 | 93 | −18,58 | ||||
| 2025-08-14 | 13F | Hilltop Holdings Inc. | 72 066 | 3,42 | 626 | 2,45 | ||||
| 2025-07-24 | 13F | IFP Advisors, Inc | 20 941 | 0,21 | 182 | −1,09 | ||||
| 2025-08-08 | 13F | Tortoise Investment Management, LLC | 765 156 | −43,73 | 6 649 | −44,24 | ||||
| 2025-08-06 | 13F | SOUTH STATE Corp | 6 718 | 58 | ||||||
| 2025-07-09 | 13F | Wolff Financial Management Llc | 11 956 | 1,12 | 0 | |||||
| 2025-07-11 | 13F | Lantz Financial LLC | 22 947 | 0,00 | 199 | −1,00 | ||||
| 2025-07-18 | 13F | Access Financial Services, Inc. | 0 | −100,00 | 0 | |||||
| 2025-07-31 | 13F/A | Avion Wealth | 462 | 0,00 | 0 | |||||
| 2025-08-14 | 13F | GWM Advisors LLC | 25 163 | 2,83 | 219 | 1,87 | ||||
| 2025-08-05 | 13F | Corps Capital Advisors, LLC | 23 500 | 0,00 | 204 | −0,97 | ||||
| 2025-08-14 | 13F | Staley Capital Advisers Inc | 24 500 | 0,00 | 213 | −0,93 | ||||
| 2025-07-29 | 13F | Uhlmann Price Securities, Llc | 13 497 | 0,39 | 117 | 0,00 | ||||
| 2025-07-07 | 13F | Wesbanco Bank Inc | 18 157 | 0,00 | 158 | −1,26 | ||||
| 2025-07-17 | 13F | Sound Income Strategies, LLC | 4 035 | 0,00 | 35 | 0,00 | ||||
| 2025-07-31 | 13F | Moloney Securities Asset Management, LLC | 12 039 | −45,37 | 105 | −46,11 | ||||
| 2025-08-12 | 13F | Global Retirement Partners, LLC | 1 942 | 1,89 | 17 | 0,00 | ||||
| 2025-04-14 | 13F | Old National Bancorp /in/ | 0 | −100,00 | 0 | |||||
| 2025-07-11 | 13F | Coastwise Capital Group, LLC | 12 917 | 0,00 | 112 | −0,88 | ||||
| 2025-07-24 | 13F | Accredited Investor Services, Llc | 105 301 | 0,00 | 915 | −0,87 | ||||
| 2025-08-07 | 13F | Hennion & Walsh Asset Management, Inc. | 1 917 495 | 11,29 | 16 663 | 10,28 | ||||
| 2025-08-14 | 13F | Dagco, Inc. | 4 806 | 1,12 | 42 | 0,00 | ||||
| 2025-08-11 | 13F | Principal Securities, Inc. | 0 | −100,00 | 0 | |||||
| 2025-07-14 | 13F | Sowell Financial Services LLC | 11 761 | 9,29 | 102 | 8,51 | ||||
| 2025-08-14 | 13F | Rock Point Advisors, LLC | 13 250 | 0,00 | 115 | −0,86 | ||||
| 2025-08-15 | 13F | Equitable Holdings, Inc. | 14 110 | 0,12 | 123 | −0,81 | ||||
| 2025-07-10 | 13F | PMV Capital Advisers, LLC | 2 178 | 1,11 | 19 | 0,00 | ||||
| 2025-07-11 | 13F | Seacrest Wealth Management, Llc | 25 878 | −0,29 | 225 | −1,32 | ||||
| 2025-08-13 | 13F | Cary Street Partners Financial Llc | 23 465 | 0,00 | 204 | −0,98 | ||||
| 2025-07-09 | 13F | Breakwater Capital Group | 89 998 | −31,38 | 782 | −32,00 | ||||
| 2025-08-12 | 13F | Steward Partners Investment Advisory, Llc | 90 837 | −18,13 | 789 | −18,91 | ||||
| 2025-08-15 | 13F | Tower Research Capital LLC (TRC) | 19 | 216,67 | 0 | |||||
| 2025-08-12 | 13F | Proequities, Inc. | 0 | 0 | ||||||
| 2025-08-15 | 13F | Kestra Advisory Services, LLC | 125 689 | 0,25 | 1 092 | −0,64 | ||||
| 2025-07-31 | 13F | Cambridge Investment Research Advisors, Inc. | 395 558 | −10,74 | 3 | 0,00 | ||||
| 2025-08-07 | 13F | Ibex Wealth Advisors | 178 728 | −0,64 | 1 553 | −1,52 | ||||
| 2025-08-14 | 13F | Gould Capital, LLC | 1 550 | 0,00 | 13 | 0,00 | ||||
| 2025-07-23 | 13F | Venturi Wealth Management, LLC | 92 765 | 0,20 | 806 | −0,62 | ||||
| 2025-08-13 | 13F | Brown Advisory Inc | 32 674 | −25,70 | 284 | −26,49 | ||||
| 2025-08-15 | 13F | Captrust Financial Advisors | 33 947 | 65,02 | 295 | 63,89 | ||||
| 2025-08-15 | 13F | CI Private Wealth, LLC | 33 491 | 99,87 | 291 | 99,32 | ||||
| 2025-08-27 | NP | HCIMX - The Intermediate Term Municipal Bond Portfolio HC Strategic Shares | 101 974 | 0,00 | 886 | −0,89 | ||||
| 2025-04-30 | 13F | Sofos Investments, Inc. | 2 000 | 18 | ||||||
| 2025-05-12 | 13F | Sandy Spring Bank | 750 | 0,00 | 7 | 0,00 | ||||
| 2025-08-13 | 13F | StoneX Group Inc. | 14 143 | −4,95 | 123 | −5,38 | ||||
| 2025-08-14 | 13F/A | Rockefeller Capital Management L.P. | 491 082 | 25,66 | 4 268 | 24,51 | ||||
| 2025-07-18 | 13F | Bartlett & Co. Wealth Management Llc | 1 830 | 0,00 | 16 | −6,25 | ||||
| 2025-07-17 | 13F | Venture Visionary Partners LLC | 13 032 | −39,48 | 113 | −39,89 | ||||
| 2025-08-06 | 13F | Aspect Partners, LLC | 1 000 | 0,00 | 9 | 0,00 | ||||
| 2025-07-17 | 13F | Janney Montgomery Scott LLC | 142 681 | −7,60 | 1 | 0,00 | ||||
| 2025-08-07 | 13F | CENTRAL TRUST Co | 25 183 | −3,32 | 219 | −4,39 | ||||
| 2025-08-28 | NP | RiverNorth Managed Duration Municipal Income Fund II, Inc. | 754 880 | −12,30 | 6 560 | −13,10 | ||||
| 2025-08-04 | 13F | Wealth Management Associates, Inc. | 14 403 | −2,26 | 125 | −3,10 | ||||
| 2025-05-14 | 13F | Clarity Asset Management, Inc. | 0 | −100,00 | 0 | |||||
| 2025-08-14 | 13F | Goldman Sachs Group Inc | 12 992 | 2,36 | 113 | 0,90 | ||||
| 2025-07-25 | 13F | We Are One Seven, LLC | 26 648 | −28,52 | 232 | −29,14 | ||||
| 2025-08-12 | 13F | TCTC Holdings, LLC | 4 265 | 0,00 | 37 | 0,00 | ||||
| 2025-08-14 | 13F | Jane Street Group, Llc | 11 630 | 101 | ||||||
| 2025-04-15 | 13F | Fifth Third Bancorp | 0 | −100,00 | 0 | |||||
| 2025-07-29 | 13F | Disciplined Investments, LLC | 60 402 | 0,83 | 525 | −0,19 | ||||
| 2025-07-17 | 13F | Melfa Wealth Management, Llc | 40 619 | 0,00 | 353 | −1,12 | ||||
| 2025-04-29 | 13F | Bank of New York Mellon Corp | 0 | −100,00 | 0 | |||||
| 2025-08-13 | 13F | Johnson Financial Group, Inc. | 41 500 | −42,76 | 362 | −43,42 | ||||
| 2025-08-01 | 13F | Envestnet Asset Management Inc | 32 544 | 6,60 | 283 | 5,62 | ||||
| 2025-08-12 | 13F | LPL Financial LLC | 1 190 266 | 3,08 | 10 343 | 2,14 | ||||
| 2025-08-12 | 13F | Wayfinding Financial, LLC | 0 | −100,00 | 0 | |||||
| 2025-07-21 | 13F | Barrett & Company, Inc. | 8 445 | 0,00 | 73 | −1,35 | ||||
| 2025-08-19 | 13F | Cape Investment Advisory, Inc. | 500 | 0,00 | 4 | 0,00 | ||||
| 2025-08-08 | 13F | Hartland & Co., LLC | 43 000 | 0,00 | 374 | −1,06 | ||||
| 2025-08-14 | 13F | Robinson Capital Management, Llc | 165 384 | 1 437 | ||||||
| 2025-07-21 | 13F | Hudson Valley Investment Advisors Inc /adv | 41 215 | −14,07 | 358 | −14,76 | ||||
| 2025-08-14 | 13F | Ancora Advisors, LLC | 8 093 | −0,87 | 70 | −1,41 | ||||
| 2025-08-04 | 13F | Pinnacle Associates Ltd | 12 639 | 0,00 | 110 | −0,91 | ||||
| 2025-07-25 | 13F | Second Half Financial Partners, LLC | 29 464 | 0,00 | 256 | −0,78 | ||||
| 2025-08-07 | 13F | Kestra Private Wealth Services, Llc | 108 596 | 17,51 | 944 | 16,42 | ||||
| 2025-08-14 | 13F | Wells Fargo & Company/mn | 1 785 135 | 13,99 | 15 513 | 12,95 | ||||
| 2025-07-29 | 13F | Tradewinds Capital Management, LLC | 6 023 | 0,00 | 52 | 0,00 | ||||
| 2025-04-21 | 13F | Old Second National Bank Of Aurora | 0 | −100,00 | 0 | |||||
| 2025-08-14 | 13F | Tandem Financial, LLC | 132 065 | 0,88 | 1 152 | −0,09 | ||||
| 2025-08-04 | 13F | Mayflower Financial Advisors, LLC | 27 370 | 0,00 | 238 | −1,25 | ||||
| 2025-05-15 | 13F | Cohen & Steers, Inc. | 0 | −100,00 | 0 | |||||
| 2025-07-14 | 13F | Caitlin John, LLC | 11 000 | −29,49 | 96 | −30,15 | ||||
| 2025-07-14 | 13F | UMA Financial Services, Inc. | 14 382 | 0,43 | 125 | −0,80 | ||||
| 2025-08-14 | 13F | Principia Wealth Advisory, LLC | 9 614 | 0,00 | 84 | 1,22 | ||||
| 2025-04-17 | 13F | Nbt Bank N A /ny | 0 | −100,00 | 0 | |||||
| 2025-08-08 | 13F | Financial Gravity Companies, Inc. | 2 000 | 0,00 | 17 | 0,00 | ||||
| 2025-08-11 | 13F | Citigroup Inc | 4 370 | 0,88 | 38 | 0,00 | ||||
| 2025-08-15 | 13F | Morgan Stanley | 4 490 565 | −1,13 | 39 023 | −2,03 | ||||
| 2025-07-17 | 13F | Investment Research & Advisory Group, Inc. | 54 | 0,00 | 7 | 0,00 | ||||
| 2025-05-15 | 13F | Citadel Advisors Llc | 0 | −100,00 | 0 | |||||
| 2025-07-21 | 13F | Ameritas Advisory Services, LLC | 3 753 | 33 | ||||||
| 2025-07-31 | 13F | AlTi Global, Inc. | 132 210 | −23,59 | 1 149 | −24,62 | ||||
| 2025-07-16 | 13F | True North Advisors, LLC | 412 922 | −19,16 | 3 588 | −19,89 | ||||
| 2025-07-28 | 13F/A | Penbrook Management LLC | 20 000 | 0,00 | 174 | −1,14 | ||||
| 2025-08-06 | 13F | Commonwealth Equity Services, Llc | 417 171 | −1,80 | 4 | 0,00 | ||||
| 2025-08-11 | 13F | Capital Square, LLC | 44 486 | −0,00 | 386 | −1,03 | ||||
| 2025-08-28 | NP | Rivernorth Opportunities Fund, Inc. | 871 367 | −43,59 | 7 572 | −44,11 | ||||
| 2025-07-25 | NP | PMSAX - Global Multi-Strategy Fund Class A | 14 992 | 0,00 | 128 | −3,76 | ||||
| 2025-07-29 | 13F | Chicago Partners Investment Group LLC | 784 377 | −0,58 | 6 636 | −3,32 | ||||
| 2025-05-08 | 13F | Private Advisory Group LLC | 0 | −100,00 | 0 | |||||
| 2025-08-27 | NP | ROBAX - Robinson Tax Advantaged Income Fund Class A Shares | 165 384 | 1 437 | ||||||
| 2025-08-14 | 13F | Benjamin Edwards Inc | 19 400 | 0,00 | 169 | −1,18 | ||||
| 2025-08-04 | 13F | Saxony Capital Management, LLC | 14 250 | 0,00 | 124 | −0,81 | ||||
| 2025-08-08 | 13F | Good Life Advisors, LLC | 42 700 | 1,06 | 371 | 0,27 | ||||
| 2025-07-29 | 13F | Regions Financial Corp | 0 | −100,00 | 0 | |||||
| 2025-08-14 | 13F | Federation des caisses Desjardins du Quebec | 1 000 | 0,00 | 9 | 0,00 | ||||
| 2025-08-12 | 13F | Coldstream Capital Management Inc | 0 | −100,00 | 0 | |||||
| 2025-08-12 | 13F | Franklin Resources Inc | 13 060 | 113 | ||||||
| 2025-08-19 | 13F | Anchor Investment Management, LLC | 436 | 0,46 | 4 | 0,00 | ||||
| 2025-08-14 | 13F | UBS Group AG | 6 915 017 | 0,47 | 60 091 | −0,45 | ||||
| 2025-08-11 | 13F | Shufro Rose & Co Llc | 10 000 | 0,00 | 88 | 0,00 | ||||
| 2025-08-14 | 13F | Bank Of America Corp /de/ | 925 266 | −2,34 | 8 041 | −3,23 | ||||
| 2025-07-08 | 13F | Ransom Advisory, Ltd | 0 | −100,00 | 0 | |||||
| 2025-07-29 | 13F | Oxbow Advisors, LLC | 14 839 | 0,00 | 129 | −1,54 | ||||
| 2025-08-13 | 13F | Rsm Us Wealth Management Llc | 11 938 | 104 | ||||||
| 2025-07-11 | 13F | Busey Wealth Management | 21 755 | 0,00 | 189 | −0,53 | ||||
| 2025-07-31 | 13F | Optimum Investment Advisors | 43 700 | −22,24 | 380 | −22,97 | ||||
| 2025-09-04 | 13F/A | Advisor Group Holdings, Inc. | 186 936 | 37,90 | 1 625 | 36,70 | ||||
| 2025-07-15 | 13F | Sightline Wealth Advisors, LLC | 13 099 | −21,00 | 114 | −22,07 | ||||
| 2025-08-28 | NP | RiverNorth Opportunistic Municipal Income Fund, Inc. | 255 572 | −12,34 | 2 221 | −13,15 | ||||
| 2025-07-28 | 13F | Eq Wealth Advisors, Llc | 5 138 | 0,37 | 45 | 0,00 | ||||
| 2025-08-14 | 13F | Van Eck Associates Corp | 1 000 623 | 0,53 | 9 | 0,00 | ||||
| 2025-08-28 | NP | RiverNorth Flexible Municipal Income Fund II, Inc. | 975 797 | −21,96 | 8 480 | −22,67 | ||||
| 2025-07-10 | 13F | High Net Worth Advisory Group LLC | 70 000 | 7,69 | 608 | 6,67 | ||||
| 2025-07-29 | 13F | Private Trust Co Na | 5 723 | 0,00 | 50 | −2,00 | ||||
| 2025-08-14 | 13F | Mariner, LLC | 46 929 | −9,26 | 408 | −10,15 | ||||
| 2025-08-12 | 13F | Virtu Financial LLC | 0 | −100,00 | 0 | |||||
| 2025-08-13 | 13F | Russell Investments Group, Ltd. | 575 | 0,00 | 5 | −20,00 | ||||
| 2025-08-14 | 13F | Westchester Capital Management, LLC | 59 644 | 0,00 | 518 | −0,96 | ||||
| 2025-07-22 | 13F | DAVENPORT & Co LLC | 47 239 | 0,00 | 411 | −0,97 | ||||
| 2025-07-30 | 13F | D.a. Davidson & Co. | 16 972 | 147 | ||||||
| 2025-08-14 | 13F | Hurley Capital, LLC | 5 000 | 0,00 | 43 | 0,00 | ||||
| 2025-08-08 | 13F | City Of London Investment Management Co Ltd | 101 974 | −20,45 | 886 | −21,17 | ||||
| 2025-08-14 | 13F | Royal Bank Of Canada | 556 349 | 9,21 | 4 834 | 8,19 | ||||
| 2025-07-22 | 13F | Valley National Advisers Inc | 1 000 | 0 | ||||||
| 2025-07-17 | 13F | Beacon Capital Management, LLC | 257 | 1,18 | 2 | 0,00 | ||||
| 2025-07-15 | 13F | Mather Group, Llc. | 0 | −100,00 | 0 | |||||
| 2025-07-28 | 13F | Pettinga Financial Advisors, LLC | 25 688 | −3,75 | 223 | −4,70 | ||||
| 2025-07-31 | 13F | Glass Jacobson Investment Advisors llc | 0 | −100,00 | 0 | |||||
| 2025-07-31 | 13F | Oppenheimer & Co Inc | 14 988 | 0,00 | 130 | −0,76 | ||||
| 2025-08-19 | 13F | National Asset Management, Inc. | 0 | −100,00 | 0 | |||||
| 2025-08-12 | 13F | Wealthbridge Capital Management, Llc | 31 710 | −22,47 | 276 | −23,18 | ||||
| 2025-08-08 | 13F | Creative Planning | 19 029 | −11,50 | 165 | −12,23 | ||||
| 2025-05-12 | 13F | Fmr Llc | 0 | −100,00 | 0 | |||||
| 2025-04-29 | 13F | Resources Investment Advisors, LLC. | 0 | −100,00 | 0 | −100,00 | ||||
| 2025-08-13 | 13F | Baird Financial Group, Inc. | 240 372 | 3,97 | 2 089 | 3,01 | ||||
| 2025-08-13 | 13F | Lido Advisors, LLC | 0 | −100,00 | 0 | |||||
| 2025-07-28 | 13F | Harbour Investments, Inc. | 8 507 | −10,52 | 74 | −12,05 | ||||
| 2025-07-14 | 13F | Golden State Equity Partners | 16 066 | 140 | ||||||
| 2025-08-11 | 13F | Advisor Resource Council | 0 | −100,00 | 0 | |||||
| 2025-08-11 | 13F | HighTower Advisors, LLC | 105 005 | −2,25 | 912 | −3,18 | ||||
| 2025-07-18 | 13F | Trust Co Of Vermont | 0 | −100,00 | 0 | |||||
| 2025-04-21 | 13F | ORG Partners LLC | 0 | −100,00 | 0 | |||||
| 2025-07-23 | 13F | Prime Capital Investment Advisors, LLC | 19 516 | −20,37 | 170 | −21,03 | ||||
| 2025-05-08 | 13F | Essential Planning, LLC. | 0 | −100,00 | 0 | |||||
| 2025-08-12 | 13F | CIBC Private Wealth Group, LLC | 30 264 | 0,00 | 263 | 1,55 | ||||
| 2025-07-22 | 13F | Fortitude Advisory Group L.L.C. | 43 488 | 0,00 | 378 | 1,62 | ||||
| 2025-08-14 | 13F | Icon Wealth Advisors, LLC | 21 518 | 0,00 | 187 | −1,06 | ||||
| 2025-05-08 | 13F | XTX Topco Ltd | 0 | −100,00 | 0 | |||||
| 2025-08-04 | 13F | Mesirow Financial Investment Management, Inc. | 49 537 | 0,21 | 430 | −0,69 | ||||
| 2025-07-23 | 13F | Element Wealth, LLC | 27 664 | 240 | ||||||
| 2025-07-28 | 13F | BRYN MAWR TRUST Co | 0 | −100,00 | 0 | |||||
| 2025-08-12 | 13F | MAI Capital Management | 34 026 | 4,14 | 296 | 3,15 | ||||
| 2025-07-24 | 13F | Us Bancorp \de\ | 1 000 | 0,00 | 9 | 0,00 | ||||
| 2025-07-29 | 13F | Stratos Wealth Partners, LTD. | 44 225 | 10,88 | 384 | 10,03 | ||||
| 2025-05-14 | 13F | Summit Financial Wealth Advisors, LLC | 105 797 | −0,19 | 928 | −0,75 | ||||
| 2025-08-28 | NP | RiverNorth Managed Duration Municipal Income Fund, Inc. | 1 013 114 | −9,53 | 8 804 | −10,37 | ||||
| 2025-07-24 | 13F | Coordinated Financial Services, Inc. | 10 000 | 87 | ||||||
| 2025-08-13 | 13F | Jones Financial Companies Lllp | 431 719 | 72,83 | 3 747 | 71,49 | ||||
| 2025-08-07 | 13F | Summit X, LLC | 24 391 | −45,53 | 212 | −46,17 | ||||
| 2025-07-18 | 13F | Truist Financial Corp | 30 646 | −3,26 | 266 | −3,97 | ||||
| 2025-07-01 | 13F | Harbor Investment Advisory, Llc | 37 600 | −2,59 | 327 | −3,55 | ||||
| 2025-07-22 | 13F | IVC Wealth Advisors LLC | 12 845 | 0,00 | 112 | −0,89 | ||||
| 2025-08-14 | 13F | Broyhill Asset Management | 303 568 | −39,79 | 2 638 | −40,33 | ||||
| 2025-08-26 | NP | WCERX - WCM Alternatives: Event-Driven Fund - Investor Class Shares | 42 616 | 0,00 | 370 | −0,80 | ||||
| 2025-07-31 | 13F | Buckingham Strategic Partners | 22 913 | 199 | ||||||
| 2025-08-06 | 13F | Atlantic Union Bankshares Corp | 750 | 7 | ||||||
| 2025-08-14 | 13F | Comerica Bank | 22 511 | 9,75 | 196 | 8,94 | ||||
| 2025-08-12 | 13F | Jacobi Capital Management LLC | 27 274 | 237 | ||||||
| 2025-04-23 | 13F | Western Wealth Management, LLC | 0 | −100,00 | 0 | −100,00 | ||||
| 2025-08-14 | 13F | CoreCap Advisors, LLC | 1 040 | −13,84 | 9 | −10,00 | ||||
| 2025-07-16 | 13F | Dakota Wealth Management | 15 533 | −26,47 | 135 | −27,03 | ||||
| 2025-07-17 | 13F | Sonora Investment Management Group, LLC | 15 120 | 0,00 | 131 | −0,76 | ||||
| 2025-07-30 | 13F | Cullen/frost Bankers, Inc. | 0 | −100,00 | 0 | |||||
| 2025-08-13 | 13F | Plan Group Financial, LLC | 12 978 | 113 | ||||||
| 2025-07-10 | 13F | Wealth Enhancement Advisory Services, Llc | 27 021 | 85,67 | 236 | 85,83 | ||||
| 2025-08-21 | 13F | Pathway Financial Advisers, LLC | 62 028 | −0,89 | 539 | −1,64 | ||||
| 2025-07-16 | 13F | ORG Wealth Partners, LLC | 14 773 | −25,85 | 129 | −25,86 | ||||
| 2025-07-28 | 13F | Callahan Advisors, LLC | 46 001 | −51,31 | 400 | −51,81 | ||||
| 2025-07-18 | 13F | PFG Investments, LLC | 35 829 | 1,17 | 311 | 0,32 | ||||
| 2025-07-11 | 13F | Annex Advisory Services, LLC | 11 590 | 101 | ||||||
| 2025-08-06 | 13F | Moors & Cabot, Inc. | 24 543 | 1,63 | 213 | 0,95 | ||||
| 2025-08-12 | 13F | Jpmorgan Chase & Co | 0 | −100,00 | 0 | |||||
| 2025-04-15 | 13F | Sanibel Captiva Trust Company, Inc. | 0 | −100,00 | 0 | |||||
| 2025-08-12 | 13F | Advisors Asset Management, Inc. | 355 312 | −25,02 | 3 088 | −25,70 | ||||
| 2025-08-13 | 13F | Beacon Pointe Advisors, LLC | 18 983 | 0,90 | 165 | 0,00 | ||||
| 2025-07-29 | 13F | Koshinski Asset Management, Inc. | 166 513 | −0,84 | 1 447 | −1,77 | ||||
| 2025-08-07 | 13F | King Luther Capital Management Corp | 348 | 257,73 | ||||||
| 2025-08-12 | 13F | Wood Tarver Financial Group, LLC | 0 | −100,00 | 0 | |||||
| 2025-08-13 | 13F | WCG Wealth Advisors LLC | 61 180 | 0,54 | 532 | −0,38 | ||||
| 2025-08-13 | 13F | Baker Avenue Asset Management, LP | 0 | −100,00 | 0 | |||||
| 2025-07-18 | 13F | Clarity Financial LLC | 12 255 | 0,00 | 106 | −0,93 | ||||
| 2025-08-06 | 13F | Prospera Financial Services Inc | 474 774 | −1,01 | 4 126 | −1,93 | ||||
| 2025-08-08 | 13F | Cetera Investment Advisers | 110 887 | 25,95 | 964 | 24,74 | ||||
| 2025-08-28 | NP | RNDLX - RiverNorth/DoubleLine Strategic Income Fund Class R | 900 000 | −6,15 | 7 821 | −7,00 | ||||
| 2025-05-13 | 13F | NINE MASTS CAPITAL Ltd | 0 | −100,00 | 0 | |||||
| 2025-05-13 | 13F | Elequin Capital Lp | 0 | −100,00 | 0 | |||||
| 2025-08-14 | 13F | Raymond James Financial Inc | 1 771 323 | −23,24 | 15 393 | −23,95 | ||||
| 2025-08-14 | 13F | 1607 Capital Partners, LLC | 2 551 754 | −6,12 | 22 175 | −6,98 | ||||
| 2025-08-11 | 13F | Private Advisor Group, LLC | 19 580 | −2,35 | 170 | −2,86 | ||||
| 2025-05-15 | 13F | Wiley Bros.-aintree Capital, Llc | 0 | −100,00 | 0 | |||||
| 2025-05-09 | 13F | Atria Wealth Solutions, Inc. | 0 | −100,00 | 0 | |||||
| 2025-05-30 | NP | Rivernorth Marketplace Lending Corp | 0 | −100,00 | 0 | −100,00 | ||||
| 2025-07-23 | 13F | Seamount Financial Group Inc | 62 799 | 4,73 | 546 | 3,81 | ||||
| 2025-08-13 | 13F | Northwestern Mutual Wealth Management Co | 6 873 | 30,76 | 60 | 28,26 | ||||
| 2025-08-14 | 13F | Hrt Financial Lp | 0 | −100,00 | 0 | |||||
| 2025-07-11 | 13F | Marshall & Sullivan Inc /wa/ | 1 840 | 16 | ||||||
| 2025-07-22 | 13F | Investors Asset Management Of Georgia Inc /ga/ /adv | 16 250 | 0,00 | 141 | −0,70 | ||||
| 2025-08-11 | 13F | Wealthspire Advisors, LLC | 11 090 | −48,37 | 96 | −48,94 | ||||
| 2025-08-11 | 13F | Lummis Asset Management, LP | 22 000 | 0,00 | 191 | −0,52 | ||||
| 2025-08-07 | 13F | Allworth Financial LP | 86 534 | 752 | ||||||
| 2025-08-14 | 13F | Ameriprise Financial Inc | 202 819 | −15,93 | 1 762 | −16,69 | ||||
| 2025-08-15 | 13F | Provenance Wealth Advisors, LLC | 0 | −100,00 | 0 | −100,00 | ||||
| 2025-08-14 | 13F | Kovitz Investment Group Partners, LLC | 2 758 585 | 37,10 | 23 972 | 35,86 | ||||
| 2025-07-30 | 13F | BlueChip Wealth Advisors LLC | 25 445 | 0,00 | 221 | −0,90 | ||||
| 2025-08-28 | NP | RiverNorth Flexible Municipal Income Fund, Inc. | 372 588 | −8,45 | 3 238 | −9,30 | ||||
| 2025-08-04 | 13F | Spire Wealth Management | 430 | 0,00 | 4 | 0,00 | ||||
| 2025-07-17 | 13F | Independence Bank of Kentucky | 1 800 | 0,00 | 16 | 0,00 | ||||
| 2025-08-14 | 13F | Granby Capital Management, LLC | 1 100 000 | 0,00 | 9 559 | −0,91 | ||||
| 2025-07-11 | 13F | Congress Park Capital LLC | 551 632 | 9,69 | 4 794 | 8,68 | ||||
| 2025-04-11 | 13F | Radnor Capital Management, LLC | 0 | −100,00 | 0 | |||||
| 2025-07-24 | 13F | Eastern Bank | 828 | 0,00 | 7 | 0,00 | ||||
| 2025-08-11 | 13F | Teachers Insurance & Annuity Association Of America | 91 358 | 0,00 | 794 | −1,00 | ||||
| 2025-07-16 | 13F | Cresta Advisors, Ltd. | 180 840 | 0,00 | 1 572 | −0,88 | ||||
| 2025-07-16 | 13F | Signaturefd, Llc | 0 | −100,00 | 0 | |||||
| 2025-08-05 | 13F | Wellington Shields Capital Management, LLC | 50 000 | 0,00 | 434 | −0,91 | ||||
| 2025-07-22 | 13F | Mascoma Wealth Management LLC | 5 706 | 0,00 | 50 | −2,00 | ||||
| 2025-08-27 | NP | JNL SERIES TRUST - JNL/Westchester Capital Event Driven Fund (A) | 1 795 | 0,00 | 16 | 0,00 | ||||
| 2025-07-07 | 13F | Whitaker-Myers Wealth Managers, LTD. | 47 337 | 411 | ||||||
| 2025-08-14 | 13F | Sunbelt Securities, Inc. | 2 280 | 20 | ||||||
| 2025-08-06 | 13F | Modera Wealth Management, LLC | 17 359 | 0,28 | 151 | −0,66 | ||||
| 2025-05-07 | 13F | Sheaff Brock Investment Advisors, LLC | 14 600 | 0,00 | 128 | 2,40 | ||||
| 2025-07-22 | 13F | Orca Wealth Management, LLC | 20 266 | 0,95 | 176 | 0,00 | ||||
| 2025-07-25 | 13F | Cwm, Llc | 8 147 | 8,61 | 0 | |||||
| 2025-07-17 | 13F/A | Capital Investment Advisors, LLC | 34 815 | −3,56 | 303 | −4,43 | ||||
| 2025-05-15 | 13F | Nomura Holdings Inc | 0 | −100,00 | 0 | −100,00 | ||||
| 2025-08-01 | 13F | Chilton Capital Management Llc | 2 500 | 0,00 | 22 | 0,00 | ||||
| 2025-08-13 | 13F | Capital Advisors Wealth Management, LLC | 22 332 | 50,87 | 194 | 50,39 | ||||
| 2025-08-14 | 13F | Shepherd Kaplan Krochuk, Llc | 61 432 | 0,00 | 534 | −0,93 | ||||
| 2025-08-08 | 13F | Islay Capital Management, Llc | 11 500 | 0,00 | 100 | −1,00 | ||||
| 2025-08-08 | 13F | Larson Financial Group LLC | 897 | 8 | ||||||
| 2025-08-14 | 13F | Susquehanna International Group, Llp | 0 | −100,00 | 0 | |||||
| 2025-07-11 | 13F | Pinnacle Bancorp, Inc. | 26 000 | 0,00 | 226 | −1,32 | ||||
| 2025-08-11 | 13F | Rothschild Investment Llc | 13 104 | 0,00 | 114 | −0,88 | ||||
| 2025-07-31 | 13F | Nilsine Partners, LLC | 10 220 | −8,50 | 89 | −9,28 | ||||
| 2025-08-14 | 13F | Harmony Asset Management Llc | 102 500 | 7,33 | 891 | 6,33 | ||||
| 2025-07-23 | 13F | Narwhal Capital Management | 26 100 | 105,11 | 227 | 103,60 | ||||
| 2025-07-30 | 13F | FNY Investment Advisers, LLC | 400 | 0,00 | 0 | |||||
| 2025-08-01 | 13F | Petra Financial Advisors Inc | 14 038 | −9,43 | 122 | −10,37 | ||||
| 2025-08-19 | 13F | Advisory Services Network, LLC | 11 082 | 5,53 | 95 | 2,17 | ||||
| 2025-07-18 | 13F | Vicus Capital | 33 234 | 1,13 | 289 | 0,00 | ||||
| 2025-07-23 | 13F | Charter Trust Co | 295 458 | −16,37 | 2 568 | −17,14 | ||||
| 2025-08-14 | 13F | Colony Group, LLC | 61 593 | −0,09 | 535 | −0,93 | ||||
| 2025-07-23 | 13F | 1 North Wealth Services Llc | 0 | 0 | ||||||
| 2025-07-30 | 13F | Roman Butler Fullerton & Co | 224 776 | 1,14 | 1 920 | 1,16 | ||||
| 2025-08-01 | 13F | Schmidt P J Investment Management Inc | 10 854 | 0,00 | 94 | −1,05 | ||||
| 2025-08-28 | NP | RNCOX - RiverNorth Core Opportunity Fund Class R | 170 958 | −33,48 | 1 486 | −34,09 | ||||
| 2025-07-18 | 13F | Naples Global Advisors, Llc | 42 000 | 0,00 | 366 | −0,81 | ||||
| 2025-07-25 | 13F | Concurrent Investment Advisors, LLC | 89 363 | 24,69 | 777 | 23,57 | ||||
| 2025-07-23 | 13F | Citizens National Bank Trust Department | 149 175 | −6,40 | 1 296 | −7,23 | ||||
| 2025-07-28 | 13F | Fairman Group, LLC | 0 | −100,00 | 0 | |||||
| 2025-08-06 | 13F | Ethos Financial Group, LLC | 19 939 | 0,00 | 174 | 1,17 | ||||
| 2025-08-13 | 13F | Guggenheim Capital Llc | 1 550 540 | 2,84 | 13 474 | 1,90 | ||||
| 2025-08-05 | 13F | Mathes Company, Inc. | 140 000 | −3,45 | 1 | 0,00 | ||||
| 2025-07-29 | 13F | Stephens Inc /ar/ | 15 333 | −38,26 | 133 | −38,71 | ||||
| 2025-08-14 | 13F | Stifel Financial Corp | 659 535 | −2,63 | 5 731 | −3,52 | ||||
| 2025-08-13 | 13F | Smith, Moore & Co. | 142 485 | 0,76 | 1 238 | −0,16 | ||||
| 2025-05-06 | 13F | Avantax Advisory Services, Inc. | 0 | −100,00 | 0 | |||||
| 2025-07-29 | 13F | Dumont & Blake Investment Advisors Llc | 16 217 | 27,90 | 141 | 26,13 | ||||
| 2025-07-25 | 13F | Ackerman Capital Advisors, LLC | 0 | −100,00 | 0 | |||||
| 2025-07-11 | 13F | Farther Finance Advisors, LLC | 3 877 | 0,21 | 34 | 0,00 | ||||
| 2025-07-31 | 13F | Blake Schutter Theil Wealth Advisors, LLC | 128 959 | 38,90 | 1 121 | 37,59 | ||||
| 2025-08-12 | 13F | South Plains Financial, Inc. | 4 250 | 0,00 | 37 | −2,70 | ||||
| 2025-08-13 | 13F | Orleans Capital Management Corp/la | 79 325 | 0,00 | 689 | −0,86 | ||||
| 2025-08-12 | 13F | PKS Advisory Services, LLC | 91 720 | 101,80 | 797 | 100,25 | ||||
| 2025-08-14 | 13F | Rivernorth Capital Management, Llc | 5 314 276 | −31,29 | 46 181 | −31,92 | ||||
| 2025-05-14 | 13F | Landscape Capital Management, L.l.c. | 0 | −100,00 | 0 | |||||
| 2025-08-07 | 13F | Cahill Financial Advisors Inc | 0 | −100,00 | 0 | |||||
| 2025-08-12 | 13F | Horizon Kinetics Asset Management Llc | 12 350 | 0,00 | 107 | −0,93 | ||||
| 2025-08-18 | 13F | Geneos Wealth Management Inc. | 200 | 0,00 | 2 | 0,00 | ||||
| 2025-08-08 | 13F | Pnc Financial Services Group, Inc. | 29 547 | 0,00 | 257 | −1,16 | ||||
| 2025-08-07 | 13F | Flagship Wealth Advisors, Llc | 5 625 | 0,00 | 49 | −2,04 | ||||
| 2025-06-25 | NP | XMPT - VanEck Vectors CEF Municipal Income ETF | 1 001 438 | −0,90 | 8 682 | −2,36 | ||||
| 2025-05-06 | 13F | Guardian Wealth Management, Inc. | 0 | −100,00 | 0 | |||||
| 2025-08-06 | 13F | Wedbush Securities Inc | 48 349 | −5,38 | 0 |