Grundläggande statistik
| Institutionella ägare | 186 total, 186 long only, 0 short only, 0 long/short - change of 1,64% MRQ |
| Genomsnittlig portföljallokering | 0.1130 % - change of −9,02% MRQ |
| Institutionella aktier (lång) | 18 453 169 (ex 13D/G) - change of −0,13MM shares −0,73% MRQ |
| Institutionellt värde (lång) | $ 1 153 729 USD ($1000) |
Institutionellt ägande och aktieägare
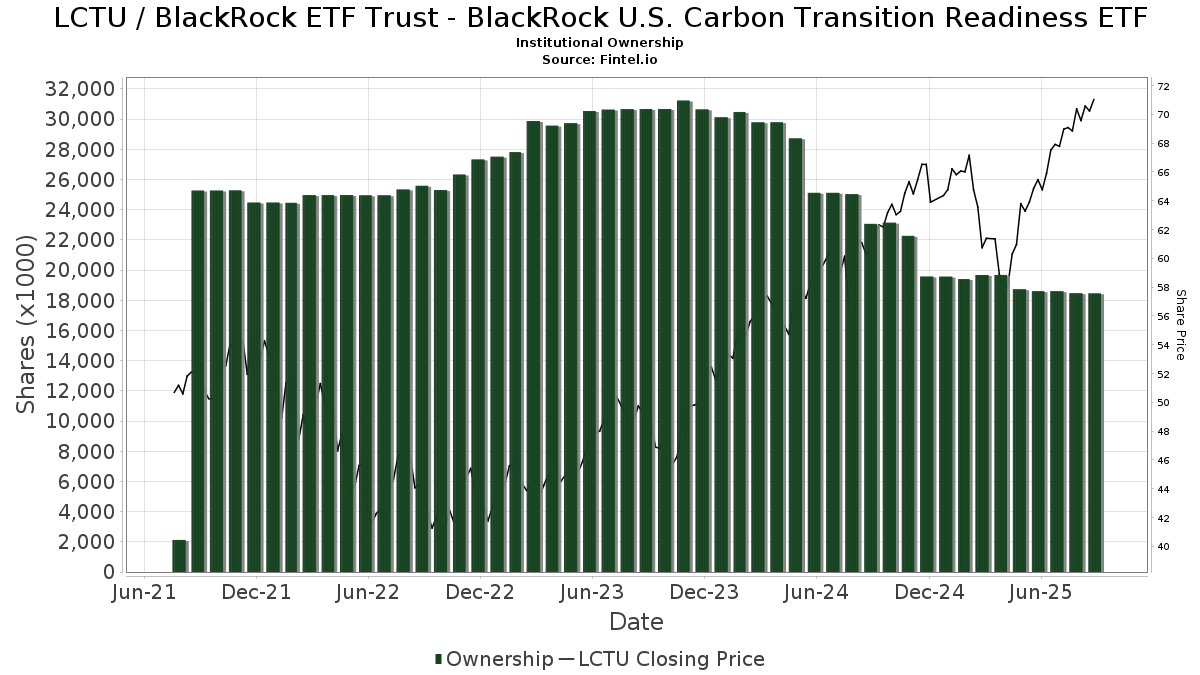
BlackRock ETF Trust - BlackRock U.S. Carbon Transition Readiness ETF (US:LCTU) har 186 Institutionella ägare och aktieägare som har lämnat in 13D/G- eller 13F-formulär till Securities Exchange Commission (SEC). Dessa institut innehar totalt 18,453,169 aktier. Största aktieägare inkluderar Envestnet Asset Management Inc, Varma Mutual Pension Insurance Co, Ubs Asset Management Americas Inc, LPL Financial LLC, Envestnet Portfolio Solutions, Inc., Jpmorgan Chase & Co, Park Avenue Securities Llc, Cetera Investment Advisers, Cwm, Llc, and Mml Investors Services, Llc .
BlackRock ETF Trust - BlackRock U.S. Carbon Transition Readiness ETF (ARCA:LCTU) Institutionell ägarstruktur visar institutioners och fonders nuvarande positioner i företaget, samt de senaste förändringarna i positionernas storlek. Större aktieägare kan vara enskilda investerare, fonder, hedgefonder eller institutioner. Bilaga 13D visar att investeraren äger (eller ägde) mer än 5% av företaget och avser (eller avsåg) att aktivt eftersträva en förändring av affärsstrategin. Schedule 13G indikerar en passiv investering på över 5%.
The share price as of September 15, 2025 is 71,94 / share. Previously, on September 16, 2024, the share price was 61,44 / share. This represents an increase of 17,09% over that period.
Fondsentimentets poäng
Fondsentimentet poängen(fka Ägarackumulation-poäng) visar vilka aktier som är mest köpta av fonder. Det är resultatet av en sofistikerad kvantitativ flerfaktormodell som identifierar företag med de högsta nivåerna av institutionell ackumulering. Poängsättningsmodellen använder en kombination av den totala ökningen av redovisade ägare, förändringarna i portföljallokeringarna för dessa ägare och andra mått. Siffran sträcker sig från 0 till 100, där högre siffror indikerar en högre nivå av ackumulering i förhållande till sina konkurrenter, och 50 är genomsnittet.
Uppdateringsfrekvens: Dagligen
Se Ownership Explorer, som innehåller en lista över de högst rankade företagen.
Institutionell sälj/köp-kvot
Förutom att rapportera vanliga eget kapital- och skuldemissioner måste institutioner med mer än 100MM tillgångar under förvaltning också avslöja sina innehav av sälj- och köpoptioner. Eftersom säljoptioner i allmänhet indikerar ett negativt sentiment och köpoptioner indikerar ett positivt sentiment, kan vi få en uppfattning om det övergripande institutionella sentimentet genom att plotta förhållandet mellan säljoptioner och köpoptioner. Diagrammet till höger visar det historiska förhållandet mellan sälj- och köpoptioner för detta instrument.
Genom att använda sälj/köp-kvoten som en indikator på aktieägarnas sentiment undviker man en av de största bristerna med att använda det totala institutionella ägandet, nämligen att en betydande del av de förvaltade tillgångarna investeras passivt för att följa index. Passivt förvaltade fonder köper vanligtvis inte optioner, så indikatorn för sälj/köp-kvoten ger en bättre bild av stämningen i aktivt förvaltade fonder.
13D/G-Arkiveringar
Vi presenterar 13D/G-arkiveringar separat från 13F-arkiveringar på grund av att de behandlas olika av SEC. 13D/G-arkiveringar kan lämnas in av grupper av investerare (med en ledare), medan 13F-arkiveringar inte kan det. Detta leder till situationer där en investerare kan lämna in en 13D/G-ansökan med ett värde för de totala aktierna (vilket motsvarar alla aktier som ägs av investerargruppen), men sedan lämna in en 13F-ansökan med ett annat värde för de totala aktierna (vilket motsvarar enbart deras eget ägande). Detta innebär att aktieägandet i 13D/G-arkiveringar och 13F-arkiveringar ofta inte är direkt jämförbara, så vi presenterar dem separat.
Notera: Från och med den 16 maj 2021 visar vi inte längre ägare som inte har lämnat in en 13D/G under det senaste året. Tidigare visade vi hela historiken för 13D/G-arkiveringar. I allmänhet måste enheter som är skyldiga att lämna in 13D/G-arkiveringar lämna in minst en gång per år innan de lämnar in en stängningsarkivering. Fonder avslutar dock ibland positioner utan att lämna in en avslutande arkivering (dvs. de avvecklar), så att visa hela historiken resulterade ibland i förvirring om det nuvarande ägandet. För att förhindra förvirring visar vi nu endast "nuvarande" ägare - det vill säga ägare som har lämnat in en ansökan under det senaste året.
Upgrade to unlock premium data.
| Fil Datum | Formulär | Investerare | Föregående aktier |
Senaste aktier |
Δ Aktier (Procent) |
Ägande (Procent) |
Δ Ägande (Procent) |
|
|---|---|---|---|---|---|---|---|---|
| 2024-12-06 | BlackRock, Inc. | 400,000 | 400,000 | 0.00 | 38.50 | -23.00 |
13F- och NPORT-arkiveringar
Detaljer om 13F-arkiveringar är gratis. Detaljer om NP-arkiveringar kräver ett premiummedlemskap. Gröna rader indikerar nya positioner. Röda rader indikerar stängda positioner. Klicka på länk symbolen för att se hela transaktionshistoriken.
Uppgradera
för att låsa upp premiumdata och exportera till Excel ![]() .
.
| Fil Datum | Källa | Investerare | Typ | Genomsnittligt pris (beräknat) |
Aktier | Δ Aktier (%) |
Rapporterat värde (1000 USD) |
Δ Värde (%) |
Portföljallokering (%) |
|
|---|---|---|---|---|---|---|---|---|---|---|
| 2025-08-04 | 13F | Atria Investments Llc | 12 474 | 18,85 | 839 | 31,92 | ||||
| 2025-07-10 | 13F | Focus Financial Network, Inc. | 4 862 | 0,02 | 327 | 11,22 | ||||
| 2025-08-06 | 13F | Valtinson Bruner Financial Planning LLC | 5 221 | 6,90 | 351 | 18,98 | ||||
| 2025-07-09 | 13F | Sterling Manor Financial, LLC | 4 559 | 8,60 | 307 | 20,47 | ||||
| 2025-08-11 | 13F | Regal Investment Advisors LLC | 25 868 | 0,31 | 1 740 | 11,40 | ||||
| 2025-08-12 | 13F | Global Retirement Partners, LLC | 3 204 | 79,60 | 216 | 88,60 | ||||
| 2025-08-13 | 13F | Capital Analysts, Inc. | 8 486 | 4,48 | 1 | |||||
| 2025-08-11 | 13F | Aptus Capital Advisors, LLC | 24 413 | −0,49 | 1 642 | 10,50 | ||||
| 2025-08-15 | 13F | Morgan Stanley | 1 201 | −38,00 | 81 | −31,62 | ||||
| 2025-08-12 | 13F | BlackRock, Inc. | 2 094 | 1,55 | 141 | 12,90 | ||||
| 2025-07-16 | 13F | MBE Wealth Management, LLC | 8 922 | 0,28 | 600 | 11,32 | ||||
| 2025-08-13 | 13F | Vertex Planning Partners, LLC | 3 297 | 222 | ||||||
| 2025-07-25 | 13F | Atria Wealth Solutions, Inc. | 16 357 | −84,98 | 1 103 | −83,29 | ||||
| 2025-08-01 | 13F | Transcend Wealth Collective, Llc | 3 940 | 1,60 | 265 | 12,77 | ||||
| 2025-08-07 | 13F | Varma Mutual Pension Insurance Co | 4 814 000 | 0,00 | 323 847 | 11,00 | ||||
| 2025-08-14 | 13F | IHT Wealth Management, LLC | 3 763 | −1,10 | 253 | 10,00 | ||||
| 2025-08-13 | 13F | Transce3nd, LLC | 746 | 2,05 | 50 | 13,64 | ||||
| 2025-08-13 | 13F | Continuum Advisory, LLC | 0 | −100,00 | 0 | |||||
| 2025-08-14 | 13F | Hilltop Holdings Inc. | 5 882 | 1,98 | 396 | 13,18 | ||||
| 2025-07-29 | 13F | Two West Capital Advisors LLC | 5 288 | 367 | ||||||
| 2025-08-13 | 13F | Flow Traders U.s. Llc | 0 | −100,00 | 0 | |||||
| 2025-07-29 | 13F | Horst & Graben Wealth Management LLC | 71 468 | −5,10 | 4 808 | 5,32 | ||||
| 2025-07-10 | 13F | Oliver Lagore Vanvalin Investment Group | 1 630 | −1,09 | 99 | −6,67 | ||||
| 2025-07-11 | 13F | Farther Finance Advisors, LLC | 21 737 | 0,18 | 1 462 | 10,67 | ||||
| 2025-08-04 | 13F | Creative Financial Designs Inc /adv | 3 854 | −13,10 | 259 | −3,36 | ||||
| 2025-07-28 | 13F | RCS Financial Planning, LLC | 5 082 | 0,10 | 342 | 11,07 | ||||
| 2025-08-15 | 13F | Equitable Holdings, Inc. | 59 718 | −0,62 | 4 017 | 10,33 | ||||
| 2025-08-05 | 13F | Bank of New York Mellon Corp | 36 339 | 2,89 | 2 445 | 14,21 | ||||
| 2025-08-12 | 13F | LPL Financial LLC | 1 110 937 | 15,40 | 74 735 | 28,09 | ||||
| 2025-08-13 | 13F | GeoWealth Management, LLC | 59 403 | 61,62 | 3 996 | 79,43 | ||||
| 2025-08-11 | 13F | United Capital Financial Advisers, Llc | 71 963 | −3,05 | 4 841 | 7,60 | ||||
| 2025-07-17 | 13F | Janney Montgomery Scott LLC | 111 905 | 27,06 | 8 | 40,00 | ||||
| 2025-08-08 | 13F | Meridian Wealth Management, LLC | 3 676 | 0,57 | 247 | 11,76 | ||||
| 2025-08-11 | 13F | Eq Llc | 12 587 | 14,29 | 847 | 26,84 | ||||
| 2025-07-24 | 13F | MA Private Wealth | 30 152 | 0,00 | 2 028 | 11,00 | ||||
| 2025-08-12 | 13F | Archer Investment Corp | 227 | 0,00 | 15 | 15,38 | ||||
| 2025-08-15 | 13F | High Falls Advisors, Inc | 4 200 | 1,87 | 283 | 13,25 | ||||
| 2025-07-21 | 13F | Ameritas Advisory Services, LLC | 65 | 4 | ||||||
| 2025-07-30 | 13F | Strategic Blueprint, LLC | 11 222 | −19,30 | 755 | −10,45 | ||||
| 2025-08-14 | 13F | Talisman Wealth Advisors LLC | 6 809 | 1,61 | 458 | 12,81 | ||||
| 2025-07-31 | 13F | Cambridge Investment Research Advisors, Inc. | 66 290 | 8,40 | 4 | 33,33 | ||||
| 2025-04-08 | 13F | Parallel Advisors, LLC | 0 | −100,00 | 0 | |||||
| 2025-07-08 | 13F | Braun-Bostich & Associates Inc. | 6 087 | 0,16 | 409 | 11,14 | ||||
| 2025-07-11 | 13F | My Legacy Advisors, LLC | 6 458 | −14,57 | 439 | −4,15 | ||||
| 2025-07-14 | 13F | Park Avenue Securities Llc | 455 019 | 2,03 | 31 | 11,11 | ||||
| 2025-08-18 | 13F/A | Kestra Investment Management, LLC | 5 392 | −0,13 | 363 | 10,70 | ||||
| 2025-07-21 | 13F | Patriot Financial Group Insurance Agency, LLC | 8 051 | −1,56 | 542 | 9,29 | ||||
| 2025-07-14 | 13F | UMA Financial Services, Inc. | 491 | 2,08 | 33 | 13,79 | ||||
| 2025-07-23 | 13F | Nbt Bank N A /ny | 736 | 0,00 | 50 | 11,36 | ||||
| 2025-08-06 | 13F | Csenge Advisory Group | 3 976 | 1,64 | 255 | 14,35 | ||||
| 2025-08-14 | 13F | Susquehanna International Group, Llp | 0 | −100,00 | 0 | |||||
| 2025-08-14 | 13F | Jane Street Group, Llc | 0 | −100,00 | 0 | |||||
| 2025-07-25 | 13F | Apollon Wealth Management, LLC | 4 772 | 6,09 | 321 | 18,01 | ||||
| 2025-07-16 | 13F | MKT Advisors LLC | 3 390 | 228 | ||||||
| 2025-08-11 | 13F | HighTower Advisors, LLC | 27 374 | −3,75 | 1 841 | 6,85 | ||||
| 2025-07-18 | 13F | Trilogy Capital Inc. | 8 133 | 28,77 | 547 | 43,19 | ||||
| 2025-07-15 | 13F | Armis Advisers, LLC | 8 068 | 2,57 | 543 | 13,87 | ||||
| 2025-04-24 | 13F | Renaissancere Holdings Ltd | 0 | 0 | ||||||
| 2025-08-06 | 13F | First Horizon Advisors, Inc. | 12 923 | 51,38 | 869 | 68,09 | ||||
| 2025-04-16 | 13F | Wealth Enhancement Advisory Services, Llc | 0 | −100,00 | 0 | |||||
| 2025-07-30 | 13F | Wbh Advisory Inc | 9 089 | 3,48 | 611 | 14,85 | ||||
| 2025-08-13 | 13F | Milestone Investment Advisors LLC | 333 | 0,00 | 22 | 10,00 | ||||
| 2025-08-14 | 13F | UBS Group AG | 9 421 | −21,62 | 634 | −13,05 | ||||
| 2025-08-08 | 13F | Wealth Alliance | 29 844 | −0,63 | 2 008 | 10,27 | ||||
| 2025-08-08 | 13F | W.H. Cornerstone Investments Inc. | 3 820 | 8,93 | 257 | 20,75 | ||||
| 2025-08-12 | 13F | Change Path, LLC | 18 461 | 1,82 | 1 242 | 13,02 | ||||
| 2025-07-25 | 13F | Concurrent Investment Advisors, LLC | 4 305 | 29,40 | 290 | 43,78 | ||||
| 2025-08-12 | 13F | Journey Strategic Wealth Llc | 4 682 | −0,57 | 315 | 10,18 | ||||
| 2025-08-01 | 13F | Rossby Financial, LCC | 2 355 | −18,90 | 158 | −8,67 | ||||
| 2025-08-12 | 13F | MAI Capital Management | 307 | 0,00 | 21 | 11,11 | ||||
| 2025-08-11 | 13F | Theory Financial Llc | 14 194 | 6,76 | 978 | 21,37 | ||||
| 2025-08-12 | 13F | Investor's Fiduciary Advisor Network, LLC | 33 796 | −30,91 | 2 | 0,00 | ||||
| 2025-07-22 | 13F | Miracle Mile Advisors, LLC | 18 112 | 1 218 | ||||||
| 2025-05-02 | 13F | Capital A Wealth Management, LLC | 815 | 0,00 | 49 | −5,77 | ||||
| 2025-08-14 | 13F | Royal Bank Of Canada | 87 425 | 2,52 | 5 881 | 13,80 | ||||
| 2025-09-04 | 13F/A | Advisor Group Holdings, Inc. | 82 234 | 88,05 | 5 408 | 104,08 | ||||
| 2025-08-05 | 13F | Claro Advisors LLC | 0 | −100,00 | 0 | |||||
| 2025-07-09 | 13F | Massmutual Trust Co Fsb/adv | 1 569 | 0,00 | 106 | 10,53 | ||||
| 2025-07-10 | 13F | Sharkey, Howes & Javer | 62 220 | 2,01 | 4 186 | 13,23 | ||||
| 2025-07-14 | 13F | Buttonwood Financial Group, LLC | 11 142 | −0,09 | 753 | 18,96 | ||||
| 2025-07-30 | 13F | Eqis Capital Management, Inc. | 8 029 | 1,13 | 540 | 12,27 | ||||
| 2025-07-14 | 13F | U.S. Capital Wealth Advisors, LLC | 8 159 | 1,12 | 549 | 12,07 | ||||
| 2025-07-24 | 13F | Drucker Wealth 3.0, LLC | 3 211 | 218 | ||||||
| 2025-07-10 | 13F | Global Financial Private Client, LLC | 0 | −100,00 | 0 | |||||
| 2025-08-07 | 13F | Sound View Wealth Advisors Group, LLC | 10 771 | 0,00 | 725 | 11,04 | ||||
| 2025-07-07 | 13F | Centurion Wealth Management LLC | 5 680 | 1,76 | 382 | 7,00 | ||||
| 2025-08-06 | 13F | Commonwealth Equity Services, Llc | 47 535 | −2,16 | 3 | 50,00 | ||||
| 2025-08-12 | 13F | O'shaughnessy Asset Management, Llc | 22 222 | −2,65 | 1 495 | 8,03 | ||||
| 2025-07-15 | 13F | Spectrum Planning & Advisory Services Inc. | 8 930 | −5,71 | 601 | 4,71 | ||||
| 2025-07-30 | 13F | Black Diamond Financial, LLC | 4 019 | 270 | ||||||
| 2025-07-28 | 13F | Harbour Investments, Inc. | 6 565 | −1,57 | 442 | 9,16 | ||||
| 2025-07-28 | 13F | Axxcess Wealth Management, Llc | 6 875 | 57,50 | 462 | 75,00 | ||||
| 2025-04-28 | 13F | Fedenia Advisers LLC | 0 | −100,00 | 0 | |||||
| 2025-07-21 | 13F | Barrett & Company, Inc. | 445 | 0,00 | 30 | 11,54 | ||||
| 2025-07-22 | 13F | Macroview Investment Management Llc | 5 212 | 351 | ||||||
| 2025-08-13 | 13F | Cerity Partners LLC | 35 986 | −3,13 | 2 421 | 7,51 | ||||
| 2025-08-13 | 13F | Mount Yale Investment Advisors, LLC | 3 398 | −10,65 | 229 | −0,87 | ||||
| 2025-07-21 | 13F | Ascent Group, LLC | 10 202 | −3,64 | 686 | 7,02 | ||||
| 2025-08-06 | 13F | Golden State Wealth Management, LLC | 3 589 | 653,99 | 241 | 760,71 | ||||
| 2025-08-08 | 13F | Hartland & Co., LLC | 162 | 0,00 | 11 | 11,11 | ||||
| 2025-07-28 | 13F | RFG Advisory, LLC | 27 562 | 0,23 | 1 854 | 11,28 | ||||
| 2025-07-29 | 13F | Goldstein Advisors, LLC | 3 572 | 0,14 | 240 | 11,11 | ||||
| 2025-08-13 | 13F | Elios Financial Group Inc. | 38 239 | −11,23 | 2 572 | −1,46 | ||||
| 2025-08-14 | 13F | Goldman Sachs Group Inc | 4 735 | −82,40 | 319 | −80,49 | ||||
| 2025-08-12 | 13F | Coldstream Capital Management Inc | 0 | −100,00 | 0 | |||||
| 2025-08-11 | 13F | CFS Investment Advisory Services, LLC | 7 454 | 4,11 | 1 | |||||
| 2025-08-01 | 13F | Envestnet Asset Management Inc | 4 858 967 | −0,10 | 326 872 | 10,89 | ||||
| 2025-08-04 | 13F | Assetmark, Inc | 122 685 | 7,88 | 8 253 | 19,75 | ||||
| 2025-07-07 | 13F | Insight Wealth Strategies, LLC | 5 253 | 2,14 | 353 | 13,50 | ||||
| 2025-07-23 | 13F | Dohj, Llc | 17 151 | 3,51 | 997 | −0,70 | ||||
| 2025-08-07 | 13F | Financially Speaking Inc | 60 | −91,07 | 4 | −90,00 | ||||
| 2025-08-14 | 13F | Mariner, LLC | 11 767 | 19,16 | 792 | 32,27 | ||||
| 2025-08-13 | 13F | Maia Wealth LLC | 17 204 | 2,61 | 1 157 | 18,55 | ||||
| 2025-08-14 | 13F | GWM Advisors LLC | 36 553 | −20,72 | 2 459 | −11,99 | ||||
| 2025-08-14 | 13F | Wells Fargo & Company/mn | 210 | 14 | ||||||
| 2025-07-21 | 13F | Ameriflex Group, Inc. | 388 | −27,34 | 26 | −21,87 | ||||
| 2025-07-17 | 13F | Tempus Wealth Planning, LLC | 9 450 | 7,36 | 636 | 19,14 | ||||
| 2025-08-07 | 13F | Kestra Private Wealth Services, Llc | 9 423 | 0,24 | 634 | 11,25 | ||||
| 2025-08-26 | 13F/A | Thrivent Financial For Lutherans | 4 865 | −95,76 | 0 | −100,00 | ||||
| 2025-04-21 | 13F | PSI Advisors, LLC | 0 | −100,00 | 0 | −100,00 | ||||
| 2025-08-29 | 13F | Evolution Wealth Management Inc. | 834 | 56 | ||||||
| 2025-07-17 | 13F | Hanson & Doremus Investment Management | 266 | 0,00 | 0 | |||||
| 2025-08-12 | 13F | Jpmorgan Chase & Co | 640 711 | −1,56 | 43 102 | 9,26 | ||||
| 2025-04-08 | 13F/A | California State Teachers Retirement System | 0 | −100,00 | 0 | |||||
| 2025-07-07 | 13F | Capital Asset Advisory Services LLC | 6 875 | 57,50 | 462 | 73,03 | ||||
| 2025-08-07 | 13F | Keystone Financial Services | 17 624 | −6,31 | 1 186 | 3,95 | ||||
| 2025-07-25 | 13F | Sovereign Financial Group, Inc. | 4 367 | −30,63 | 294 | −23,10 | ||||
| 2025-08-14 | 13F | Guardian Wealth Advisors, Llc / Nc | 1 043 | 0,00 | 70 | 11,11 | ||||
| 2025-07-09 | 13F | Beacon Financial Group | 8 207 | −0,41 | 552 | 10,62 | ||||
| 2025-08-14 | 13F | Diversify Advisory Services, LLC | 9 785 | −44,32 | 685 | −35,19 | ||||
| 2025-08-01 | 13F | Ashton Thomas Private Wealth, LLC | 4 141 | 0,12 | 279 | 11,20 | ||||
| 2025-07-16 | 13F | Perigon Wealth Management, LLC | 45 178 | −14,89 | 3 039 | −5,53 | ||||
| 2025-07-23 | 13F | Venturi Wealth Management, LLC | 10 756 | −1,94 | 724 | 8,89 | ||||
| 2025-08-12 | 13F | Zacks Investment Management | 7 843 | 0,00 | 528 | 10,95 | ||||
| 2025-07-25 | 13F | We Are One Seven, LLC | 43 121 | 5,43 | 2 901 | 17,03 | ||||
| 2025-08-07 | 13F | Allworth Financial LP | 29 | 0,00 | 2 | 0,00 | ||||
| 2025-08-13 | 13F | Northwestern Mutual Wealth Management Co | 739 | 0,00 | 50 | 11,36 | ||||
| 2025-08-15 | 13F | WFA of San Diego, LLC | 762 | 0,00 | 51 | 8,51 | ||||
| 2025-08-06 | 13F | Wedbush Securities Inc | 5 476 | −3,01 | 0 | |||||
| 2025-04-21 | 13F | ORG Partners LLC | 0 | −100,00 | 0 | −100,00 | ||||
| 2025-08-14 | 13F | CoreCap Advisors, LLC | 11 255 | 1,78 | 757 | 12,99 | ||||
| 2025-08-11 | 13F | Sofi Wealth, Llc | 56 266 | 67,74 | 3 785 | 86,27 | ||||
| 2025-08-01 | 13F | Austin Private Wealth, LLC | 31 251 | 3,31 | 2 102 | 14,68 | ||||
| 2025-08-13 | 13F | Kilter Group LLC | 431 | 29 | ||||||
| 2025-08-06 | 13F | AE Wealth Management LLC | 4 251 | 5,69 | 286 | 17,28 | ||||
| 2025-04-17 | 13F | Factory Mutual Insurance Co | 0 | −100,00 | 0 | |||||
| 2025-07-22 | 13F | Olistico Wealth, LLC | 155 | 0,00 | 10 | 11,11 | ||||
| 2025-08-14 | 13F | Comerica Bank | 4 010 | 0,00 | 270 | 10,70 | ||||
| 2025-08-11 | 13F | Cornerstone Planning Group LLC | 0 | −100,00 | 0 | |||||
| 2025-07-15 | 13F | Oregon Pacific Wealth Management, LLC | 13 497 | −0,35 | 908 | 10,61 | ||||
| 2025-04-30 | 13F | Stratos Wealth Advisors, LLC | 0 | −100,00 | 0 | −100,00 | ||||
| 2025-08-12 | 13F | Steward Partners Investment Advisory, Llc | 54 835 | −4,61 | 3 689 | 5,89 | ||||
| 2025-07-25 | 13F | Cwm, Llc | 297 942 | −0,75 | 20 | 11,11 | ||||
| 2025-08-13 | 13F | First Trust Advisors Lp | 3 230 | 217 | ||||||
| 2025-08-14 | 13F | Raymond James Financial Inc | 9 040 | 27,90 | 608 | 42,06 | ||||
| 2025-07-10 | 13F | Sovran Advisors, LLC | 6 054 | −2,29 | 409 | 15,86 | ||||
| 2025-08-12 | 13F | Proequities, Inc. | 0 | 0 | ||||||
| 2025-08-13 | 13F | Ally Invest Advisors Inc. | 4 629 | −6,14 | 311 | 4,36 | ||||
| 2025-08-07 | 13F | Resources Investment Advisors, LLC. | 74 002 | −3,74 | 4 978 | 6,85 | ||||
| 2025-08-11 | 13F | Principal Securities, Inc. | 679 | 0,00 | 46 | 4,65 | ||||
| 2025-08-12 | 13F | WealthTrak Capital Management LLC | 816 | 0,00 | 55 | 10,20 | ||||
| 2025-08-13 | 13F | Townsquare Capital Llc | 0 | −100,00 | 0 | |||||
| 2025-07-15 | 13F | Mather Group, Llc. | 0 | −100,00 | 0 | |||||
| 2025-07-24 | 13F | IFP Advisors, Inc | 80 | −96,31 | 5 | −96,18 | ||||
| 2025-08-13 | 13F | Twin Peaks Wealth Advisors, LLC | 4 214 | 295 | ||||||
| 2025-08-08 | 13F | Avantax Advisory Services, Inc. | 24 626 | 3,39 | 1 657 | 14,76 | ||||
| 2025-07-22 | 13F | Simplicity Wealth,LLC | 8 170 | 65,35 | 550 | 83,61 | ||||
| 2025-07-24 | 13F | JB Capital LLC | 7 283 | 13,62 | 490 | 26,03 | ||||
| 2025-08-05 | 13F | GPS Wealth Strategies Group, LLC | 136 | 0,00 | 9 | 12,50 | ||||
| 2025-08-08 | 13F | Emerald Investment Partners, Llc | 506 | 1,61 | 34 | 13,33 | ||||
| 2025-07-09 | 13F | Lifelong Wealth Advisors, Inc. | 11 575 | 0,63 | 779 | 11,62 | ||||
| 2025-08-14 | 13F | Ubs Asset Management Americas Inc | 1 785 000 | 0,00 | 120 081 | 11,00 | ||||
| 2025-08-04 | 13F | Pensionmark Financial Group, Llc | 26 538 | −0,79 | 1 785 | 10,12 | ||||
| 2025-08-14 | 13F | LifePlan Investment Advisors, Inc. | 15 758 | 0,96 | 1 060 | 12,17 | ||||
| 2025-07-24 | 13F | Jfs Wealth Advisors, Llc | 4 278 | −1,99 | 288 | 8,71 | ||||
| 2025-08-08 | 13F | Pnc Financial Services Group, Inc. | 1 486 | −6,95 | 100 | 3,13 | ||||
| 2025-07-22 | 13F | Merit Financial Group, LLC | 31 372 | 50,95 | 2 110 | 67,59 | ||||
| 2025-08-08 | 13F | Wrapmanager Inc | 5 465 | −28,54 | 368 | −20,73 | ||||
| 2025-08-08 | 13F | Cetera Investment Advisers | 303 697 | 5,09 | 20 430 | 16,65 | ||||
| 2025-07-28 | 13F | Cypress Wealth Services, LLC | 6 911 | 465 | ||||||
| 2025-08-14 | 13F | Mml Investors Services, Llc | 259 660 | −1,54 | 17 | 13,33 | ||||
| 2025-08-11 | 13F | Wealthgarden F.s. Llc | 10 466 | −3,29 | 721 | 9,92 | ||||
| 2025-08-06 | 13F | Hoxton Planning & Management, LLC | 8 340 | −15,92 | 561 | −6,66 | ||||
| 2025-08-13 | 13F | Gateway Wealth Partners, LLC | 6 011 | 1,11 | 404 | 12,22 | ||||
| 2025-08-08 | 13F | Gts Securities Llc | 15 854 | −24,10 | 1 067 | −15,73 | ||||
| 2025-08-14 | 13F | Snowden Capital Advisors LLC | 22 450 | −1,96 | 1 510 | 8,87 | ||||
| 2025-07-18 | 13F | SigFig Wealth Management, LLC | 51 745 | 4,07 | 3 458 | 15,23 | ||||
| 2025-08-11 | 13F | Perennial Investment Advisors, LLC | 3 307 | 222 | ||||||
| 2025-08-27 | 13F/A | Brinker Capital Investments, LLC | 40 393 | 26,90 | 2 717 | 40,85 | ||||
| 2025-07-22 | 13F | BridgePort Financial Solutions, LLC | 3 388 | 1,47 | 228 | 12,38 | ||||
| 2025-07-28 | 13F | Sagespring Wealth Partners, Llc | 22 542 | 10,50 | 1 516 | 22,65 | ||||
| 2025-07-25 | 13F | Envestnet Portfolio Solutions, Inc. | 1 013 142 | −9,05 | 68 156 | 0,96 | ||||
| 2025-07-17 | 13F | One Wealth Advisors, LLC | 150 586 | −0,25 | 10 130 | 10,73 | ||||
| 2025-08-11 | 13F | Copperleaf Capital, LLC | 12 487 | 0,49 | 840 | 11,55 | ||||
| 2025-08-14 | 13F | Integrated Wealth Concepts LLC | 61 158 | 6,23 | 4 114 | 17,91 | ||||
| 2025-08-04 | 13F | Savvy Advisors, Inc. | 6 164 | −11,32 | 415 | −1,66 | ||||
| 2025-08-14 | 13F | Citadel Advisors Llc | 5 783 | −73,39 | 389 | −70,46 | ||||
| 2025-07-24 | 13F | Endeavor Private Wealth, Inc. | 4 712 | 4,04 | 317 | 15,33 | ||||
| 2025-08-06 | 13F | One Wealth Capital Management, Llc | 19 773 | 3,94 | 1 330 | 15,45 | ||||
| 2025-08-19 | 13F | Advisory Services Network, LLC | 81 489 | 0,84 | 5 614 | 14,62 | ||||
| 2025-03-18 | 13F/A | Bank Of America Corp /de/ | 0 | −100,00 | 0 | −100,00 | ||||
| 2025-08-13 | 13F | West Wealth Group, LLC | 10 035 | 0,98 | 691 | 14,05 | ||||
| 2025-08-14 | 13F | Wiley Bros.-aintree Capital, Llc | 9 509 | 140,55 | 647 | 92,84 | ||||
| 2025-05-15 | 13F/A | Orion Portfolio Solutions, LLC | 31 831 | 5,95 | 1 929 | 0,26 | ||||
| 2025-08-13 | 13F | EverSource Wealth Advisors, LLC | 14 816 | 2,06 | 997 | 13,31 | ||||
| 2025-08-14 | 13F | Gen-Wealth Partners Inc | 7 951 | −2,60 | 535 | 8,10 | ||||
| 2025-08-13 | 13F | Van Hulzen Asset Management, LLC | 7 019 | 0,00 | 472 | 11,06 |