Grundläggande statistik
| Institutionella ägare | 301 total, 301 long only, 0 short only, 0 long/short - change of 8,24% MRQ |
| Genomsnittlig portföljallokering | 0.3476 % - change of 11,73% MRQ |
| Institutionella aktier (lång) | 19 050 285 (ex 13D/G) - change of 0,62MM shares 3,37% MRQ |
| Institutionellt värde (lång) | $ 1 724 492 USD ($1000) |
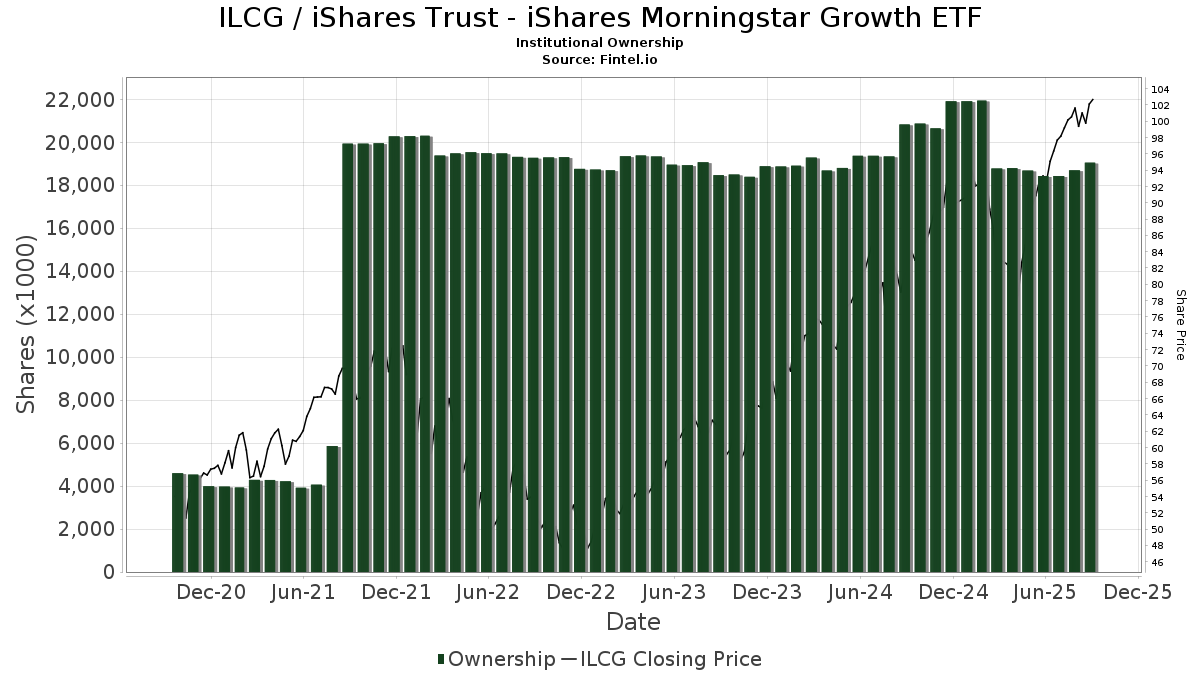
Institutionellt ägande och aktieägare
iShares Trust - iShares Morningstar Growth ETF (US:ILCG) har 301 Institutionella ägare och aktieägare som har lämnat in 13D/G- eller 13F-formulär till Securities Exchange Commission (SEC). Dessa institut innehar totalt 19,050,285 aktier. Största aktieägare inkluderar Equitable Holdings, Inc., EQ ADVISORS TRUST - EQ/Large Cap Growth Managed Volatility Portfolio Class IB, Morgan Stanley, LPL Financial LLC, Wells Fargo & Company/mn, Financial Advisory Service, Inc., Atlantic Trust, LLC, Bank Of America Corp /de/, McKinley Carter Wealth Services, Inc., and Avantax Advisory Services, Inc. .
iShares Trust - iShares Morningstar Growth ETF (ARCA:ILCG) Institutionell ägarstruktur visar institutioners och fonders nuvarande positioner i företaget, samt de senaste förändringarna i positionernas storlek. Större aktieägare kan vara enskilda investerare, fonder, hedgefonder eller institutioner. Bilaga 13D visar att investeraren äger (eller ägde) mer än 5% av företaget och avser (eller avsåg) att aktivt eftersträva en förändring av affärsstrategin. Schedule 13G indikerar en passiv investering på över 5%.
The share price as of September 23, 2025 is 103,76 / share. Previously, on September 24, 2024, the share price was 84,06 / share. This represents an increase of 23,44% over that period.
Fondsentimentets poäng
Fondsentimentet poängen(fka Ägarackumulation-poäng) visar vilka aktier som är mest köpta av fonder. Det är resultatet av en sofistikerad kvantitativ flerfaktormodell som identifierar företag med de högsta nivåerna av institutionell ackumulering. Poängsättningsmodellen använder en kombination av den totala ökningen av redovisade ägare, förändringarna i portföljallokeringarna för dessa ägare och andra mått. Siffran sträcker sig från 0 till 100, där högre siffror indikerar en högre nivå av ackumulering i förhållande till sina konkurrenter, och 50 är genomsnittet.
Uppdateringsfrekvens: Dagligen
Se Ownership Explorer, som innehåller en lista över de högst rankade företagen.
AI+ Ask Fintel’s AI assistant about iShares Trust - iShares Morningstar Growth ETF.
Thinking of good questions…
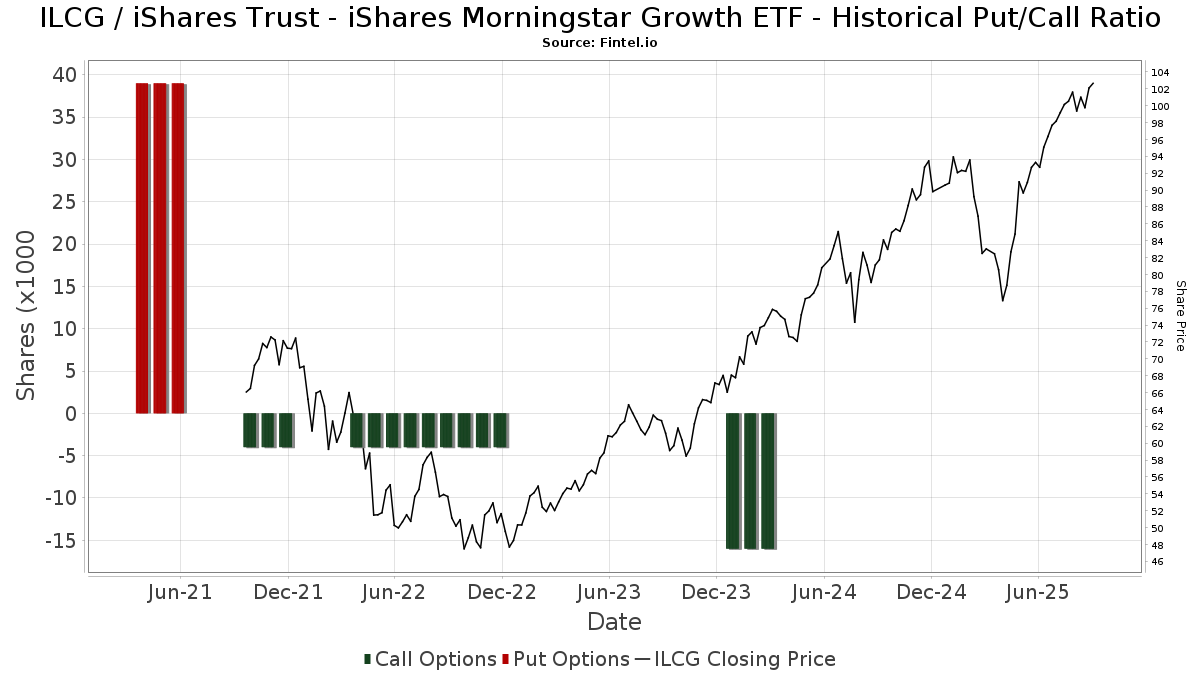
Institutionell sälj/köp-kvot
Förutom att rapportera vanliga eget kapital- och skuldemissioner måste institutioner med mer än 100MM tillgångar under förvaltning också avslöja sina innehav av sälj- och köpoptioner. Eftersom säljoptioner i allmänhet indikerar ett negativt sentiment och köpoptioner indikerar ett positivt sentiment, kan vi få en uppfattning om det övergripande institutionella sentimentet genom att plotta förhållandet mellan säljoptioner och köpoptioner. Diagrammet till höger visar det historiska förhållandet mellan sälj- och köpoptioner för detta instrument.
Genom att använda sälj/köp-kvoten som en indikator på aktieägarnas sentiment undviker man en av de största bristerna med att använda det totala institutionella ägandet, nämligen att en betydande del av de förvaltade tillgångarna investeras passivt för att följa index. Passivt förvaltade fonder köper vanligtvis inte optioner, så indikatorn för sälj/köp-kvoten ger en bättre bild av stämningen i aktivt förvaltade fonder.
13F- och NPORT-arkiveringar
Detaljer om 13F-arkiveringar är gratis. Detaljer om NP-arkiveringar kräver ett premiummedlemskap. Gröna rader indikerar nya positioner. Röda rader indikerar stängda positioner. Klicka på länk symbolen för att se hela transaktionshistoriken.
Uppgradera
för att låsa upp premiumdata och exportera till Excel ![]() .
.
| Fil Datum | Källa | Investerare | Typ | Genomsnittligt pris (beräknat) |
Aktier | Δ Aktier (%) |
Rapporterat värde (1000 USD) |
Δ Värde (%) |
Portföljallokering (%) |
|
|---|---|---|---|---|---|---|---|---|---|---|
| 2025-07-29 | 13F | Elevation Capital Advisory, LLC | 18 728 | 1 815 | ||||||
| 2025-08-14 | 13F | Wharton Business Group, LLC | 43 675 | 490,20 | 1 | |||||
| 2025-08-08 | 13F | Kane Investment Management, Inc. | 18 135 | 1,73 | 1 757 | 21,76 | ||||
| 2025-08-14 | 13F | Money Concepts Capital Corp | 74 387 | −10,64 | 7 208 | 6,91 | ||||
| 2025-07-15 | 13F | North Star Investment Management Corp. | 25 144 | −0,71 | 2 436 | 18,77 | ||||
| 2025-04-29 | 13F | Element Wealth, LLC | 0 | −100,00 | 0 | |||||
| 2025-07-25 | 13F | Cwm, Llc | 67 532 | −1,44 | 7 | 20,00 | ||||
| 2025-08-14 | 13F | Ameriprise Financial Inc | 347 741 | 1,30 | 33 696 | 21,09 | ||||
| 2025-08-07 | 13F | Kestra Private Wealth Services, Llc | 11 193 | 0,02 | 1 085 | 19,65 | ||||
| 2025-08-14 | 13F | Diversify Advisory Services, LLC | 2 068 | 210 | ||||||
| 2025-08-14 | 13F | UBS Group AG | 302 585 | −0,04 | 29 320 | 19,60 | ||||
| 2025-08-04 | 13F | Pinnacle Associates Ltd | 8 641 | −1,34 | 837 | 18,05 | ||||
| 2025-07-09 | 13F | Bowman & Co S.C. | 6 715 | −10,99 | 651 | 6,38 | ||||
| 2025-07-15 | 13F | Evanson Asset Management, LLC | 3 100 | 0,00 | 300 | 19,52 | ||||
| 2025-07-22 | 13F | Beacon Financial Advisory LLC | 19 425 | 0,02 | 1 882 | 19,72 | ||||
| 2025-08-11 | 13F | HHM Wealth Advisors, LLC | 7 625 | 0,00 | 739 | 19,61 | ||||
| 2025-08-14 | 13F | Wells Fargo & Company/mn | 642 659 | −1,99 | 62 274 | 17,27 | ||||
| 2025-08-05 | 13F | Huntington National Bank | 0 | |||||||
| 2025-08-04 | 13F | Creative Financial Designs Inc /adv | 15 177 | 0,90 | 1 471 | 20,69 | ||||
| 2025-08-01 | 13F | Rossby Financial, LCC | 372 | 0,00 | 36 | 20,00 | ||||
| 2025-08-08 | 13F | Good Life Advisors, LLC | 2 610 | −0,27 | 253 | 19,43 | ||||
| 2025-08-18 | 13F | Geneos Wealth Management Inc. | 14 200 | 26,75 | 1 376 | 51,60 | ||||
| 2025-07-11 | 13F/A | Umb Bank N A/mo | 898 | 0,00 | 87 | 20,83 | ||||
| 2025-07-22 | 13F | BridgePort Financial Solutions, LLC | 2 468 | 239 | ||||||
| 2025-07-22 | 13F | Red Tortoise LLC | 6 074 | 0,00 | 589 | 19,76 | ||||
| 2025-08-14 | 13F | Synovus Financial Corp | 2 209 | −12,65 | 214 | 4,90 | ||||
| 2025-08-13 | 13F | Cheviot Value Management, LLC | 458 | 0,00 | 46 | 21,05 | ||||
| 2025-08-19 | 13F | Advisory Services Network, LLC | 25 437 | 28,17 | 2 554 | 58,93 | ||||
| 2025-07-22 | 13F | Marietta Wealth Management, LLC | 71 718 | 0,81 | 6 949 | 20,62 | ||||
| 2025-08-07 | 13F | Brio Consultants, LLC | 8 465 | 820 | ||||||
| 2025-08-14 | 13F | Sunbelt Securities, Inc. | 6 661 | 0,71 | 597 | 11,40 | ||||
| 2025-08-13 | 13F | SCS Capital Management LLC | 4 575 | 0,00 | 443 | 19,73 | ||||
| 2025-05-09 | 13F | GeoWealth Management, LLC | 0 | −100,00 | 0 | |||||
| 2025-07-10 | 13F | Wealth Enhancement Advisory Services, Llc | 100 967 | 3,03 | 9 838 | 23,97 | ||||
| 2025-07-16 | 13F | Kiley Juergens Wealth Management, Llc | 148 090 | −0,45 | 14 350 | 19,10 | ||||
| 2025-08-14 | 13F | Full Sail Capital, LLC | 13 716 | −5,25 | 1 329 | 13,40 | ||||
| 2025-08-05 | 13F | Bank Of Montreal /can/ | 493 | 0,00 | 48 | 20,51 | ||||
| 2025-08-12 | 13F | Proequities, Inc. | 0 | 0 | ||||||
| 2025-07-09 | 13F | Fiduciary Alliance LLC | 2 692 | 0,00 | 261 | 19,27 | ||||
| 2025-07-10 | 13F | Exchange Traded Concepts, Llc | 1 074 | 104 | ||||||
| 2025-08-12 | 13F | Gladstone Institutional Advisory LLC | 16 875 | −12,21 | 1 635 | 5,08 | ||||
| 2025-07-23 | 13F | Prime Capital Investment Advisors, LLC | 114 106 | −28,96 | 11 057 | −15,01 | ||||
| 2025-07-25 | 13F | Sequoia Financial Advisors, LLC | 3 740 | 0,00 | 362 | 19,87 | ||||
| 2025-07-30 | 13F | Crewe Advisors LLC | 1 740 | 0,00 | 169 | 20,00 | ||||
| 2025-04-25 | 13F | MidAtlantic Capital Management, Inc. | 0 | −100,00 | 0 | |||||
| 2025-08-01 | 13F | Gwn Securities Inc. | 10 863 | 43,18 | 1 056 | 71,99 | ||||
| 2025-08-05 | 13F | Key FInancial Inc | 6 840 | 45,66 | 663 | 74,21 | ||||
| 2025-07-24 | 13F | Us Bancorp \de\ | 2 928 | 187,62 | 284 | 245,12 | ||||
| 2025-04-29 | 13F | Strategic Blueprint, LLC | 0 | −100,00 | 0 | |||||
| 2025-08-12 | 13F | Global Retirement Partners, LLC | 13 358 | 121,71 | 1 294 | 140,07 | ||||
| 2025-08-14 | 13F | Paragon Private Wealth Management, LLC | 10 094 | 18,64 | 978 | 41,94 | ||||
| 2025-08-14 | 13F | Mml Investors Services, Llc | 278 609 | 0,98 | 27 | 18,18 | ||||
| 2025-05-14 | 13F | Caitlin John, LLC | 0 | −100,00 | 0 | |||||
| 2025-08-13 | 13F | Transce3nd, LLC | 331 | 32 | ||||||
| 2025-07-24 | 13F | Eastern Bank | 2 490 | 0,00 | 241 | 19,90 | ||||
| 2025-08-04 | 13F | Fortune 45 LLC | 6 916 | −0,09 | 670 | 19,64 | ||||
| 2025-08-11 | 13F | Aptus Capital Advisors, LLC | 63 303 | −0,17 | 6 134 | 19,45 | ||||
| 2025-08-19 | 13F | National Asset Management, Inc. | 16 873 | 0,60 | 1 635 | 8,85 | ||||
| 2025-07-15 | 13F | McCarthy & Cox | 2 250 | 218 | ||||||
| 2025-08-13 | 13F | GM Advisory Group, Inc. | 246 525 | 182,17 | 23 888 | 237,64 | ||||
| 2025-07-24 | 13F | Capital Advisors, Ltd. LLC | 17 579 | 1,29 | 2 | 0,00 | ||||
| 2025-08-07 | 13F | Allworth Financial LP | 1 642 | 0,00 | 159 | 19,55 | ||||
| 2025-08-14 | 13F | Royal Bank Of Canada | 84 372 | −0,65 | 8 176 | 18,87 | ||||
| 2025-08-14 | 13F | CoreCap Advisors, LLC | 3 195 | −2,56 | 310 | 16,60 | ||||
| 2025-09-04 | 13F/A | Advisor Group Holdings, Inc. | 107 243 | −13,26 | 10 392 | 3,76 | ||||
| 2025-07-18 | 13F | Cooper Financial Group | 9 645 | 0,00 | 935 | 19,59 | ||||
| 2025-08-11 | 13F | Anb Bank | 13 648 | −0,39 | 1 322 | 19,21 | ||||
| 2025-08-13 | 13F | Russell Investments Group, Ltd. | 62 | −31,87 | 6 | −14,29 | ||||
| 2025-07-24 | 13F | Blair William & Co/il | 6 151 | 0,23 | 596 | 19,72 | ||||
| 2025-08-13 | 13F | Holos Integrated Wealth LLC | 36 | 0,00 | 4 | 50,00 | ||||
| 2025-07-25 | 13F | Envestnet Portfolio Solutions, Inc. | 7 392 | 174,80 | 716 | 229,95 | ||||
| 2025-07-15 | 13F | Family Investment Center, Inc. | 2 398 | 232 | ||||||
| 2025-08-08 | 13F | Kingsview Wealth Management, LLC | 12 545 | 3,83 | 1 216 | 24,23 | ||||
| 2025-08-06 | 13F | Commonwealth Equity Services, Llc | 371 067 | −12,78 | 36 | 2,94 | ||||
| 2025-08-07 | 13F | Summit Asset Management, LLC | 8 285 | −8,81 | 803 | 9,12 | ||||
| 2025-08-14 | 13F | Hrt Financial Lp | 0 | −100,00 | 0 | |||||
| 2025-07-16 | 13F | Eagle Global Advisors Llc | 3 385 | 0,00 | 328 | 19,71 | ||||
| 2025-07-29 | 13F | Roof Eidam & Maycock/adv | 4 250 | 0,00 | 412 | 19,48 | ||||
| 2025-08-12 | 13F | Archer Investment Corp | 160 | 0,00 | 16 | 25,00 | ||||
| 2025-07-17 | 13F | HB Wealth Management, LLC | 8 200 | 0,00 | 795 | 19,58 | ||||
| 2025-08-14 | 13F | Stifel Financial Corp | 48 266 | −0,33 | 4 677 | 19,22 | ||||
| 2025-07-24 | 13F | Mainstay Capital Management Llc /adv | 6 770 | 100,00 | 656 | 139,42 | ||||
| 2025-08-12 | 13F | O'shaughnessy Asset Management, Llc | 28 | −62,16 | 3 | −60,00 | ||||
| 2025-07-31 | 13F | Glass Jacobson Investment Advisors llc | 436 | 0,23 | 42 | 7,69 | ||||
| 2025-08-14 | 13F | Goldman Sachs Group Inc | 4 728 | −31,28 | 458 | −17,77 | ||||
| 2025-08-08 | 13F | Opinicus Capital, Inc. | 2 896 | −0,65 | 281 | 18,64 | ||||
| 2025-07-11 | 13F | SILVER OAK SECURITIES, Inc | 14 614 | 820,28 | 1 416 | 1 006,25 | ||||
| 2025-08-11 | 13F | Nations Financial Group Inc, /ia/ /adv | 2 566 | 0,04 | 249 | 19,81 | ||||
| 2025-08-14 | 13F | Bank Of America Corp /de/ | 472 917 | −12,67 | 45 826 | 4,49 | ||||
| 2025-08-12 | 13F | Personal Cfo Solutions, Llc | 4 135 | 401 | ||||||
| 2025-07-25 | 13F | Atria Wealth Solutions, Inc. | 30 594 | −0,71 | 2 968 | 18,92 | ||||
| 2025-08-04 | 13F | Noesis Capital Mangement Corp | 0 | −100,00 | 0 | |||||
| 2025-08-13 | 13F | Marshall Wace, Llp | 7 632 | 740 | ||||||
| 2025-08-14 | 13F | Wiley Bros.-aintree Capital, Llc | 54 080 | 1,23 | 5 240 | 20,96 | ||||
| 2025-05-12 | 13F | Townsquare Capital Llc | 0 | −100,00 | 0 | |||||
| 2025-07-29 | 13F | Woodard & Co Asset Management Group Inc /adv | 69 828 | −0,58 | 6 766 | 18,95 | ||||
| 2025-08-04 | 13F | Kovack Advisors, Inc. | 3 548 | −2,74 | 344 | 16,27 | ||||
| 2025-07-07 | 13F | Investors Research Corp | 68 045 | 23,34 | 6 594 | 47,56 | ||||
| 2025-07-18 | 13F | B.O.S.S. Retirement Advisors, LLC | 5 846 | 566 | ||||||
| 2025-08-12 | 13F | MAI Capital Management | 13 637 | 0,10 | 1 321 | 19,76 | ||||
| 2025-05-14 | 13F | Flow Traders U.s. Llc | 0 | −100,00 | 0 | |||||
| 2025-08-12 | 13F | Cornerstone Wealth Management, LLC | 111 758 | −7,05 | 10 829 | 11,21 | ||||
| 2025-07-18 | 13F | SOA Wealth Advisors, LLC. | 2 710 | 0,00 | 263 | 19,63 | ||||
| 2025-07-02 | 13F | Dentgroup LLC | 38 243 | −11,58 | 3 706 | 5,80 | ||||
| 2025-07-17 | 13F | White Pine Investment CO | 68 190 | −0,34 | 7 | 20,00 | ||||
| 2025-08-08 | 13F | Atlantic Trust, LLC | 493 585 | −2,57 | 47 828 | 16,57 | ||||
| 2025-07-31 | 13F | Washington Trust Advisors, Inc. | 750 | 0,00 | 73 | 20,00 | ||||
| 2025-08-11 | 13F | Wealthspire Advisors, LLC | 4 626 | 68,83 | 448 | 102,71 | ||||
| 2025-07-25 | 13F | Gw Henssler & Associates Ltd | 7 709 | 58,04 | 747 | 89,11 | ||||
| 2025-08-05 | 13F | Plante Moran Financial Advisors, LLC | 107 | 0,00 | 10 | 25,00 | ||||
| 2025-04-23 | 13F | VisionPoint Advisory Group, LLC | 0 | −100,00 | 0 | |||||
| 2025-08-04 | 13F | Daymark Wealth Partners, Llc | 20 473 | 119,29 | 1 984 | 162,30 | ||||
| 2025-08-04 | 13F | Hantz Financial Services, Inc. | 410 | 0 | ||||||
| 2025-08-13 | 13F | Congress Wealth Management LLC / DE / | 0 | −100,00 | 0 | |||||
| 2025-07-29 | 13F | Horst & Graben Wealth Management LLC | 19 083 | −0,01 | 1 849 | 19,68 | ||||
| 2025-07-30 | 13F | First Interstate Bank | 2 500 | 0,00 | 242 | 19,80 | ||||
| 2025-07-17 | 13F | Halbert Hargrove Global Advisors, Llc | 2 021 | 0,00 | 196 | 19,63 | ||||
| 2025-08-13 | 13F | Northwestern Mutual Wealth Management Co | 91 382 | 11,92 | 8 855 | 33,91 | ||||
| 2025-07-22 | 13F | Merit Financial Group, LLC | 55 144 | −1,48 | 5 343 | 17,87 | ||||
| 2025-08-13 | 13F | B&D White Capital Company, LLC | 348 695 | 33 789 | ||||||
| 2025-07-08 | 13F | Nbc Securities, Inc. | 550 | 0,00 | 0 | |||||
| 2025-08-14 | 13F | Win Advisors, Inc | 43 902 | 4 254 | ||||||
| 2025-08-18 | 13F | Hershey Financial Advisers, LLC | 36 986 | −14,40 | 3 584 | −7,44 | ||||
| 2025-08-14 | 13F | Smartleaf Asset Management LLC | 3 | −40,00 | 0 | |||||
| 2025-08-19 | 13F | Asset Dedication, LLC | 200 | 78,57 | 19 | 111,11 | ||||
| 2025-07-24 | 13F | IFP Advisors, Inc | 5 469 | −33,71 | 530 | −20,81 | ||||
| 2025-08-08 | 13F | Avalon Trust Co | 0 | −100,00 | 0 | |||||
| 2025-07-29 | 13F | Madison Wealth Partners, Inc | 40 838 | −2,44 | 3 957 | 16,73 | ||||
| 2025-08-14 | 13F | Raymond James Financial Inc | 242 583 | −21,30 | 23 506 | −5,84 | ||||
| 2025-08-15 | 13F | Equitable Holdings, Inc. | 2 432 116 | −6,59 | 235 672 | 11,76 | ||||
| 2025-07-31 | 13F | WFA Asset Management Corp | 52 | 0,00 | 4 | 33,33 | ||||
| 2025-08-14 | 13F | Citadel Advisors Llc | 0 | −100,00 | 0 | |||||
| 2025-08-12 | 13F | Twin Focus Capital Partners, Llc | 35 142 | 0,77 | 3 405 | 20,57 | ||||
| 2025-05-14 | 13F | Eqis Capital Management, Inc. | 0 | −100,00 | 0 | −100,00 | ||||
| 2025-08-07 | 13F | Summit X, LLC | 2 982 | 0,00 | 289 | 19,50 | ||||
| 2025-07-30 | 13F | Cornerstone Advisory, LLC | 2 513 | 0,08 | 244 | 15,17 | ||||
| 2025-08-15 | 13F | First Heartland Consultants, Inc. | 2 939 | 0,10 | 285 | 19,83 | ||||
| 2025-08-14 | 13F | Financial Advisory Service, Inc. | 598 563 | 2,26 | 58 001 | 22,35 | ||||
| 2025-07-29 | 13F | Signature Estate & Investment Advisors Llc | 7 240 | 0,11 | 702 | 19,83 | ||||
| 2025-07-08 | 13F | Atwood & Palmer Inc | 29 | 3 | ||||||
| 2025-07-01 | 13F | Harbor Investment Advisory, Llc | 2 325 | 1,09 | 225 | 20,97 | ||||
| 2025-08-08 | 13F | Pnc Financial Services Group, Inc. | 4 312 | 0,02 | 418 | 19,48 | ||||
| 2025-08-05 | 13F | Dunhill Financial, LLC | 129 | −0,77 | 13 | 20,00 | ||||
| 2025-08-12 | 13F | CIBC Private Wealth Group, LLC | 880 | −48,08 | 85 | −30,33 | ||||
| 2025-07-16 | 13F | MKT Advisors LLC | 5 805 | 0,00 | 556 | 30,59 | ||||
| 2025-08-13 | 13F | VestGen Advisors, LLC | 35 401 | −1,52 | 3 430 | 17,83 | ||||
| 2025-08-14 | 13F | Catalyst Financial Partners Llc | 7 850 | 0,00 | 761 | 19,69 | ||||
| 2025-08-11 | 13F | Principal Securities, Inc. | 10 468 | 42,79 | 1 014 | 54,57 | ||||
| 2025-08-15 | 13F | Captrust Financial Advisors | 85 641 | 0,00 | 8 299 | 19,64 | ||||
| 2025-07-31 | 13F | Blue Sky Capital Consultants Group, Inc. | 2 545 | 0,00 | 247 | 19,42 | ||||
| 2025-08-12 | 13F | Laurel Wealth Advisors LLC | 251 940 | 9 590,00 | 3 | −99,05 | ||||
| 2025-07-16 | 13F | Paragon Capital Management Ltd | 4 011 | −2,55 | 389 | 16,52 | ||||
| 2025-08-11 | 13F | Outlook Wealth Advisors, LLC | 5 980 | 0,00 | 579 | 19,63 | ||||
| 2025-08-06 | 13F | Ipsen Advisor Group LLC | 68 347 | 3,08 | 6 623 | 23,34 | ||||
| 2025-08-11 | 13F | Citigroup Inc | 33 727 | 0,86 | 3 268 | 20,68 | ||||
| 2025-07-11 | 13F | Pinnacle Bancorp, Inc. | 13 505 | 0,00 | 1 309 | 19,67 | ||||
| 2025-08-12 | 13F | J.w. Cole Advisors, Inc. | 12 009 | 39,57 | 1 164 | 67,10 | ||||
| 2025-08-05 | 13F | Tsfg, Llc | 1 300 | 0,00 | 0 | |||||
| 2025-08-13 | 13F | Cerity Partners LLC | 2 469 | 239 | ||||||
| 2025-08-25 | 13F | Fulcrum Equity Management | 2 339 | 227 | ||||||
| 2025-07-30 | 13F | Syntegra Private Wealth Group, LLC | 4 168 | 0,00 | 404 | 19,58 | ||||
| 2025-08-14 | 13F/A | Rockefeller Capital Management L.P. | 167 692 | 11,94 | 16 249 | 33,94 | ||||
| 2025-05-14 | 13F | Venture Visionary Partners LLC | 0 | −100,00 | 0 | −100,00 | ||||
| 2025-08-08 | 13F | Hartland & Co., LLC | 85 | 8 | ||||||
| 2025-07-07 | 13F | Nova Wealth Management, Inc. | 175 | 0,00 | 17 | 14,29 | ||||
| 2025-07-21 | 13F | Creative Capital Management Investments LLC | 1 007 | 0,00 | 98 | 19,75 | ||||
| 2025-08-05 | 13F | Sunburst Financial Group, LLC | 61 538 | −0,27 | 5 963 | 19,33 | ||||
| 2025-08-11 | 13F | Nomura Asset Management Co Ltd | 5 709 | 0,00 | 553 | 19,70 | ||||
| 2025-08-14 | 13F | Mariner, LLC | 100 646 | 11,53 | 9 753 | 33,44 | ||||
| 2025-08-14 | 13F/A | Skopos Labs, Inc. | 565 | 103,97 | 55 | 145,45 | ||||
| 2025-08-01 | 13F | Envestnet Asset Management Inc | 304 261 | 191,37 | 29 483 | 248,61 | ||||
| 2025-07-10 | 13F | Focus Financial Network, Inc. | 43 060 | −5,77 | 4 172 | 12,73 | ||||
| 2025-07-07 | 13F | Thurston, Springer, Miller, Herd & Titak, Inc. | 8 000 | 0,00 | 775 | 19,78 | ||||
| 2025-08-13 | 13F | StoneX Group Inc. | 3 068 | 9,38 | 297 | 30,84 | ||||
| 2025-04-23 | 13F | International Assets Investment Management, Llc | 0 | −100,00 | 0 | |||||
| 2025-07-11 | 13F | Annex Advisory Services, LLC | 4 125 | 0,00 | 400 | 19,46 | ||||
| 2025-07-29 | 13F | Stratos Wealth Advisors, LLC | 2 515 | 0,12 | 244 | 19,70 | ||||
| 2025-08-08 | 13F | Cetera Investment Advisers | 110 908 | 71,87 | 10 747 | 105,64 | ||||
| 2025-05-16 | 13F | Everstar Asset Management, LLC | 0 | −100,00 | 0 | |||||
| 2025-07-23 | 13F | Avantra Family Wealth, Inc. | 5 400 | 0,00 | 523 | 19,68 | ||||
| 2025-08-13 | 13F | Twin Peaks Wealth Advisors, LLC | 6 546 | 666 | ||||||
| 2025-08-12 | 13F | LPL Financial LLC | 1 344 424 | −5,44 | 130 275 | 13,14 | ||||
| 2025-07-14 | 13F | Signature Securities Group Corporation | 4 938 | 0,10 | 478 | 19,80 | ||||
| 2025-07-25 | 13F | Johnson Investment Counsel Inc | 53 594 | −1,28 | 5 193 | 18,13 | ||||
| 2025-07-30 | 13F | Retirement Planning Group | 41 653 | 11,34 | 4 036 | 33,25 | ||||
| 2025-07-10 | 13F | McHugh Group, LLC | 2 530 | 0,00 | 245 | 20,10 | ||||
| 2025-08-14 | 13F | Financial Engines Advisors L.L.C. | 19 429 | 608,57 | 1 883 | 747,75 | ||||
| 2025-05-12 | 13F | Simplex Trading, Llc | 0 | −100,00 | 0 | |||||
| 2025-08-04 | 13F | Atria Investments Llc | 3 162 | 306 | ||||||
| 2025-08-14 | 13F | MGB Wealth Management, LLC | 1 000 | 0,00 | 97 | 20,00 | ||||
| 2025-08-14 | 13F | EP Wealth Advisors, Inc. | 3 258 | 17,83 | 316 | 41,26 | ||||
| 2025-07-17 | 13F | XML Financial, LLC | 17 902 | −0,36 | 1 735 | 19,18 | ||||
| 2025-08-01 | 13F | Zhang Financial LLC | 0 | −100,00 | 0 | |||||
| 2025-07-15 | 13F | Mather Group, Llc. | 5 837 | 0,00 | 566 | 19,70 | ||||
| 2025-07-21 | 13F | Patriot Financial Group Insurance Agency, LLC | 8 365 | −1,08 | 811 | 18,42 | ||||
| 2025-08-14 | 13F | Destination Wealth Management | 2 407 | −17,88 | 233 | −1,69 | ||||
| 2025-08-04 | 13F | Jim Saulnier & Associates, Llc | 36 888 | −5,76 | 3 574 | 12,74 | ||||
| 2025-08-12 | 13F | Absolute Capital Management, LLC | 35 504 | −27,54 | 3 440 | −13,31 | ||||
| 2025-07-28 | 13F | RFG Advisory, LLC | 38 839 | −2,70 | 3 764 | 16,43 | ||||
| 2025-07-29 | 13F | Private Trust Co Na | 8 688 | 0,00 | 842 | 19,63 | ||||
| 2025-07-24 | 13F | JNBA Financial Advisors | 256 | 0,00 | 25 | 20,00 | ||||
| 2025-07-21 | 13F | Ameritas Advisory Services, LLC | 12 417 | −8,20 | 1 203 | 9,86 | ||||
| 2025-07-24 | 13F | McKinley Carter Wealth Services, Inc. | 461 073 | 0,40 | 44 678 | 20,12 | ||||
| 2025-08-06 | 13F | Aspect Partners, LLC | 4 755 | 0,00 | 461 | 19,48 | ||||
| 2025-08-11 | 13F | HighTower Advisors, LLC | 18 973 | −10,24 | 1 838 | 7,42 | ||||
| 2025-08-14 | 13F | Qube Research & Technologies Ltd | 0 | −100,00 | 0 | |||||
| 2025-08-06 | 13F | AE Wealth Management LLC | 61 416 | 2 904,70 | 5 951 | 3 506,67 | ||||
| 2025-07-11 | 13F | Farther Finance Advisors, LLC | 0 | −100,00 | 0 | |||||
| 2025-08-06 | 13F | Csenge Advisory Group | 13 379 | 0,00 | 1 218 | 18,37 | ||||
| 2025-07-28 | 13F | Cornerstone Wealth Group, LLC | 4 860 | 0,00 | 471 | 19,59 | ||||
| 2025-08-04 | 13F | Adell Harriman & Carpenter Inc | 27 270 | 0,00 | 2 642 | 19,66 | ||||
| 2025-08-05 | 13F | Blue Barn Wealth, LLC | 8 718 | 0,23 | 845 | 19,89 | ||||
| 2025-07-09 | 13F | Towerpoint Wealth, LLC | 16 373 | −6,06 | 1 587 | 12,40 | ||||
| 2025-08-26 | NP | EQ ADVISORS TRUST - EQ/Large Cap Growth Managed Volatility Portfolio Class IB | 2 383 885 | −2,39 | 230 998 | 16,79 | ||||
| 2025-08-05 | 13F | Optivise Advisory Services LLC | 10 169 | 1,16 | 985 | 21,01 | ||||
| 2025-08-12 | 13F | Jpmorgan Chase & Co | 307 252 | −4,48 | 29 773 | 14,28 | ||||
| 2025-07-14 | 13F | Park Avenue Securities Llc | 52 551 | 5 | ||||||
| 2025-08-14 | 13F | Susquehanna International Group, Llp | 11 350 | −24,58 | 1 100 | −9,77 | ||||
| 2025-08-13 | 13F | Baird Financial Group, Inc. | 3 150 | −1,56 | 305 | 17,76 | ||||
| 2025-07-22 | 13F | Wealthcare Advisory Partners LLC | 7 074 | 685 | ||||||
| 2025-08-08 | 13F | Avantax Advisory Services, Inc. | 383 000 | 2,32 | 37 113 | 22,43 | ||||
| 2025-08-14 | 13F | Integrated Wealth Concepts LLC | 9 215 | 1,80 | 893 | 21,69 | ||||
| 2025-07-18 | 13F | Truist Financial Corp | 16 916 | −40,84 | 1 639 | −29,20 | ||||
| 2025-08-04 | 13F | Pensionmark Financial Group, Llc | 2 956 | 0,00 | 286 | 19,67 | ||||
| 2025-07-25 | 13F | Courage Miller Partners, LLC | 5 732 | −2,93 | 555 | 16,11 | ||||
| 2025-08-14 | 13F | Colony Group, LLC | 7 899 | 3,08 | 765 | 23,39 | ||||
| 2025-05-12 | 13F | Sandy Spring Bank | 737 | 0,00 | 60 | −10,61 | ||||
| 2025-08-26 | NP | EQ ADVISORS TRUST - EQ/Large Cap Core Managed Volatility Portfolio Class IB | 33 990 | −56,42 | 3 294 | −47,86 | ||||
| 2025-08-28 | NP | ACMAX - Absolute Capital Defender Fund Class A Shares | 0 | −100,00 | 0 | −100,00 | ||||
| 2025-07-22 | 13F | Coastal Investment Advisors, Inc. | 580 | 0,00 | 56 | 21,74 | ||||
| 2025-07-22 | 13F | Accel Wealth Management | 5 197 | −2,33 | 504 | 16,98 | ||||
| 2025-08-18 | 13F | Tyler-Stone Wealth Management | 6 315 | 0,00 | 612 | 19,57 | ||||
| 2025-08-26 | NP | EQ ADVISORS TRUST - EQ/Large Cap Value Managed Volatility Portfolio Class IB | 10 600 | −86,78 | 1 027 | −84,19 | ||||
| 2025-08-14 | 13F | IHT Wealth Management, LLC | 58 694 | −0,94 | 5 687 | 18,53 | ||||
| 2025-08-04 | 13F | Arkadios Wealth Advisors | 23 948 | −1,76 | 2 321 | 17,53 | ||||
| 2025-07-25 | 13F | Hazlett, Burt & Watson, Inc. | 1 200 | 0,00 | 0 | |||||
| 2025-07-22 | 13F | Cedar Mountain Advisors, LLC | 1 320 | 0,00 | 128 | 19,81 | ||||
| 2025-08-08 | 13F | Tanglewood Legacy Advisors, LLC | 44 | 0,00 | 4 | 33,33 | ||||
| 2025-08-13 | 13F | Lido Advisors, LLC | 10 780 | 0,10 | 1 045 | 19,72 | ||||
| 2025-07-29 | 13F | Goldstein Advisors, LLC | 9 470 | −0,15 | 918 | 19,40 | ||||
| 2025-08-13 | 13F | Capital Analysts, Inc. | 87 | 0,00 | 0 | |||||
| 2025-08-13 | 13F | Jones Financial Companies Lllp | 8 848 | 86,67 | 852 | 121,61 | ||||
| 2025-08-04 | 13F | Flagship Harbor Advisors, Llc | 27 511 | 480,40 | 2 666 | 595,82 | ||||
| 2025-08-19 | 13F | Cape Investment Advisory, Inc. | 22 318 | −0,66 | 2 163 | 18,86 | ||||
| 2025-07-09 | 13F | Brand Asset Management Group, Inc. | 36 164 | −3,68 | 3 504 | 15,26 | ||||
| 2025-08-14 | 13F | Comerica Bank | 12 196 | −2,44 | 1 182 | 16,70 | ||||
| 2025-08-13 | 13F | Brown Advisory Inc | 3 058 | 296 | ||||||
| 2025-07-31 | 13F | Sage Mountain Advisors LLC | 100 | 0,00 | 10 | 12,50 | ||||
| 2025-08-06 | 13F | Savant Capital, LLC | 27 335 | 2,14 | 2 649 | 22,20 | ||||
| 2025-07-22 | 13F | Valpey Financial Services, LLC | 4 583 | 444 | ||||||
| 2025-08-08 | 13F | Creative Planning | 42 664 | −7,48 | 4 134 | 10,71 | ||||
| 2025-08-14 | 13F | Fmr Llc | 29 237 | −16,58 | 2 833 | −0,18 | ||||
| 2025-08-06 | 13F | Adviser Investments LLC | 26 186 | 0,00 | 2 537 | 19,67 | ||||
| 2025-07-10 | 13F | Kozak & Associates, Inc. | 1 | 0,00 | 0 | |||||
| 2025-08-15 | 13F | CI Private Wealth, LLC | 118 936 | −52,48 | 11 525 | −43,15 | ||||
| 2025-07-29 | 13F | Rodgers & Associates, LTD | 17 138 | −4,56 | 1 661 | 14,17 | ||||
| 2025-07-23 | 13F | Armstrong, Fleming & Moore, Inc | 0 | −100,00 | 0 | |||||
| 2025-07-10 | 13F | Atticus Wealth Management, Llc | 442 | 0,00 | 43 | 20,00 | ||||
| 2025-07-31 | 13F | Nilsine Partners, LLC | 2 400 | 233 | ||||||
| 2025-08-15 | 13F | Morgan Stanley | 1 451 313 | −0,02 | 140 632 | 19,62 | ||||
| 2025-08-01 | 13F | Cedar Point Capital Partners, LLC | 8 539 | −3,34 | 827 | 15,66 | ||||
| 2025-07-14 | 13F | Sowell Financial Services LLC | 2 204 | −30,21 | 214 | −16,47 | ||||
| 2025-08-08 | 13F | Bouchey Financial Group Ltd | 5 060 | 0,00 | 490 | 19,80 | ||||
| 2025-08-26 | 13F/A | Thrivent Financial For Lutherans | 0 | −100,00 | 0 | |||||
| 2025-08-14 | 13F | Two Sigma Investments, Lp | 89 600 | 1 078,95 | 8 682 | 1 311,71 | ||||
| 2025-08-18 | 13F | Goodman Advisory Group, LLC | 184 981 | 17 925 | ||||||
| 2025-07-09 | 13F | Gilman Hill Asset Management, LLC | 3 460 | 0,00 | 335 | 19,64 | ||||
| 2025-08-14 | 13F | Mercer Global Advisors Inc /adv | 2 349 | −10,21 | 228 | 7,58 | ||||
| 2025-07-23 | 13F | Nbt Bank N A /ny | 286 | 0,00 | 28 | 17,39 | ||||
| 2025-08-14 | 13F | Fairview Capital Investment Management, Llc | 9 093 | 0,00 | 881 | 19,70 | ||||
| 2025-07-11 | 13F | LongView Wealth Management | 150 177 | 1,97 | 14 552 | 22,00 | ||||
| 2025-07-16 | 13F | Lloyd Advisory Services, LLC. | 19 659 | 1 905 | ||||||
| 2025-07-07 | 13F | Platt Investment Counsel, LLC | 3 000 | −8,42 | 291 | 9,43 | ||||
| 2025-08-07 | 13F | Commerce Bank | 4 116 | 0,00 | 399 | 19,52 | ||||
| 2025-08-12 | 13F | Steward Partners Investment Advisory, Llc | 54 121 | −1,23 | 5 244 | 18,19 | ||||
| 2025-08-11 | 13F | Pineridge Advisors LLC | 59 | 6 | ||||||
| 2025-07-28 | 13F | JGP Wealth Management, LLC | 3 497 | 18,58 | 339 | 42,02 | ||||
| 2025-07-21 | 13F | Ameriflex Group, Inc. | 0 | −100,00 | 0 | |||||
| 2025-07-29 | 13F | Wealthstream Advisors, Inc. | 13 565 | 0,00 | 1 314 | 19,67 | ||||
| 2025-08-06 | 13F | Ethos Financial Group, LLC | 8 203 | 795 | ||||||
| 2025-08-13 | 13F | Proactive Wealth Strategies LLC | 9 660 | −0,41 | 1 | |||||
| 2025-08-14 | 13F | GWM Advisors LLC | 11 537 | 23,46 | 1 118 | 47,75 | ||||
| 2025-08-15 | 13F | Kestra Advisory Services, LLC | 10 414 | 22,79 | 1 009 | 47,08 | ||||
| 2025-08-12 | 13F | Spectrum Wealth Advisory Group, LLC | 2 280 | 221 | ||||||
| 2025-05-13 | 13F | Global View Capital Management LLC | 0 | −100,00 | 0 | |||||
| 2025-07-15 | 13F | Fifth Third Bancorp | 1 850 | 0,00 | 179 | 20,13 | ||||
| 2025-07-16 | 13F | Vision Capital Management, Inc. | 6 740 | 0,00 | 653 | 19,82 | ||||
| 2025-08-12 | 13F | AlphaCore Capital LLC | 2 850 | 0,00 | 276 | 20,00 | ||||
| 2025-07-24 | 13F | Costello Asset Management, INC | 1 364 | 0,29 | 132 | 20,00 | ||||
| 2025-08-11 | 13F | Greykasell Wealth Strategies, Inc. | 29 382 | 0,69 | 2 847 | 20,48 | ||||
| 2025-07-29 | 13F | Kelman-Lazarov, Inc. | 2 963 | 0,00 | 287 | 20,08 | ||||
| 2025-07-16 | 13F | Essex Financial Services, Inc. | 16 694 | 0,01 | 1 618 | 19,69 | ||||
| 2025-08-08 | 13F | Gts Securities Llc | 2 751 | 267 | ||||||
| 2025-08-13 | 13F | Level Four Advisory Services, Llc | 70 796 | −0,29 | 6 860 | 19,30 | ||||
| 2025-08-11 | 13F | One Capital Management, LLC | 15 895 | −71,61 | 1 540 | −66,03 | ||||
| 2025-04-21 | 13F | PSI Advisors, LLC | 0 | −100,00 | 0 | |||||
| 2025-07-21 | 13F | Triad Wealth Partners, LLC | 10 835 | 1 050 | ||||||
| 2025-07-10 | 13F | Shira Ridge Wealth Management | 22 723 | 0,00 | 2 202 | 19,62 | ||||
| 2025-08-07 | 13F | Addison Advisors LLC | 16 | 0,00 | 2 | 0,00 | ||||
| 2025-07-31 | 13F | Cambridge Investment Research Advisors, Inc. | 87 274 | 26,29 | 8 | 60,00 | ||||
| 2025-08-06 | 13F | Paladin Advisory Group, LLC | 4 490 | 0,00 | 435 | 19,83 | ||||
| 2025-07-10 | 13F | SK Wealth Management, LLC | 4 847 | 0,12 | 473 | 30,66 | ||||
| 2025-07-29 | 13F | Salomon & Ludwin, LLC | 557 | −4,95 | 54 | 12,77 | ||||
| 2025-05-16 | 13F | Coppell Advisory Solutions LLC | 0 | −100,00 | 0 | |||||
| 2025-08-04 | 13F | Assetmark, Inc | 9 960 | −38,01 | 965 | −25,83 | ||||
| 2025-08-05 | 13F | Sigma Planning Corp | 14 327 | 2,53 | 1 388 | 22,72 | ||||
| 2025-07-16 | 13F | Signaturefd, Llc | 680 | 66 | ||||||
| 2025-04-17 | 13F | Janney Montgomery Scott LLC | 0 | −100,00 | 0 | |||||
| 2025-08-28 | NP | AAMAX - Absolute Capital Asset Allocator Fund Class A Shares | 35 400 | −22,54 | 3 430 | −7,32 | ||||
| 2025-04-25 | 13F | Hutchens & Kramer Investment Management Group, LLC | 0 | −100,00 | 0 | |||||
| 2025-08-04 | 13F | IFG Advisory, LLC | 4 153 | 0,00 | 402 | 19,64 | ||||
| 2025-08-01 | 13F | American Financial & Tax Strategies Inc | 50 916 | −3,38 | 4 934 | 15,61 | ||||
| 2025-07-28 | 13F | Mutual Advisors, LLC | 4 452 | 0,68 | 445 | 22,59 | ||||
| 2025-08-14 | 13F | Old Mission Capital Llc | 4 428 | 429 | ||||||
| 2025-07-11 | 13F | Kaydan Wealth Management, Inc. | 2 750 | −0,04 | 266 | 19,82 | ||||
| 2025-08-05 | 13F | Bank of New York Mellon Corp | 24 033 | 43,99 | 2 329 | 72,32 | ||||
| 2025-07-16 | 13F | GenWealth Group, Inc. | 32 147 | 0,00 | 3 115 | 19,67 | ||||
| 2025-09-11 | 13F | Milestones Private Investment Advisors LLC | 8 955 | 868 | ||||||
| 2025-07-16 | 13F | New Insight Wealth Advisors | 5 339 | −2,56 | 517 | 16,70 | ||||
| 2025-07-22 | 13F | DAVENPORT & Co LLC | 18 055 | 0,01 | 1 749 | 19,63 | ||||
| 2025-08-05 | 13F | Mathes Company, Inc. | 2 500 | 0,00 | 0 | |||||
| 2025-08-11 | 13F | Pinnacle Financial Group, LLC / IL | 22 827 | 0,01 | 2 212 | 19,64 | ||||
| 2025-08-13 | 13F | Wealthquest Corp | 9 871 | −2,76 | 956 | 16,30 | ||||
| 2025-08-15 | 13F | Cornerstone Financial Group, LLC /NE/ | 5 018 | 0,10 | 486 | 9,21 | ||||
| 2025-07-31 | 13F | Oppenheimer & Co Inc | 2 269 | 220 | ||||||
| 2025-08-13 | 13F | Green Harvest Asset Management LLC | 2 250 | 218 | ||||||
| 2025-04-28 | 13F | Heritage Oak Wealth Advisors Llc | 0 | −100,00 | 0 | |||||
| 2025-07-25 | 13F | LRI Investments, LLC | 7 230 | 0,00 | 701 | 19,66 | ||||
| 2025-04-21 | 13F | Nelson, Van Denburg & Campbell Wealth Management Group, LLC | 0 | −100,00 | 0 | |||||
| 2025-07-30 | 13F | Roman Butler Fullerton & Co | 11 867 | −2,73 | 1 187 | 22,75 | ||||
| 2025-08-05 | 13F | Strategic Financial Concepts, LLC | 11 488 | −78,66 | 1 108 | −74,58 | ||||
| 2025-08-11 | 13F | Private Advisor Group, LLC | 23 893 | −3,56 | 2 315 | 15,40 | ||||
| 2025-07-31 | 13F | LJI Wealth Management, LLC | 4 360 | 0,14 | 422 | 19,89 | ||||
| 2025-05-12 | 13F | Independent Advisor Alliance | 0 | −100,00 | 0 | |||||
| 2025-05-14 | 13F | Jane Street Group, Llc | 0 | −100,00 | 0 | |||||
| 2025-07-24 | 13F | Edge Financial Advisors LLC | 2 968 | 284 | ||||||
| 2025-08-08 | 13F | Larson Financial Group LLC | 500 | 0,00 | 48 | 20,00 | ||||
| 2025-08-15 | 13F | Tower Research Capital LLC (TRC) | 0 | −100,00 | 0 | |||||
| 2025-08-11 | 13F | Synergy Investment Management, LLC | 0 | −100,00 | 0 |