Grundläggande statistik
| Institutionella ägare | 255 total, 238 long only, 1 short only, 16 long/short - change of 11,35% MRQ |
| Genomsnittlig portföljallokering | 0.4042 % - change of −18,91% MRQ |
| Institutionella aktier (lång) | 36 223 402 (ex 13D/G) - change of 0,38MM shares 1,06% MRQ |
| Institutionellt värde (lång) | $ 1 679 259 USD ($1000) |
Institutionellt ägande och aktieägare
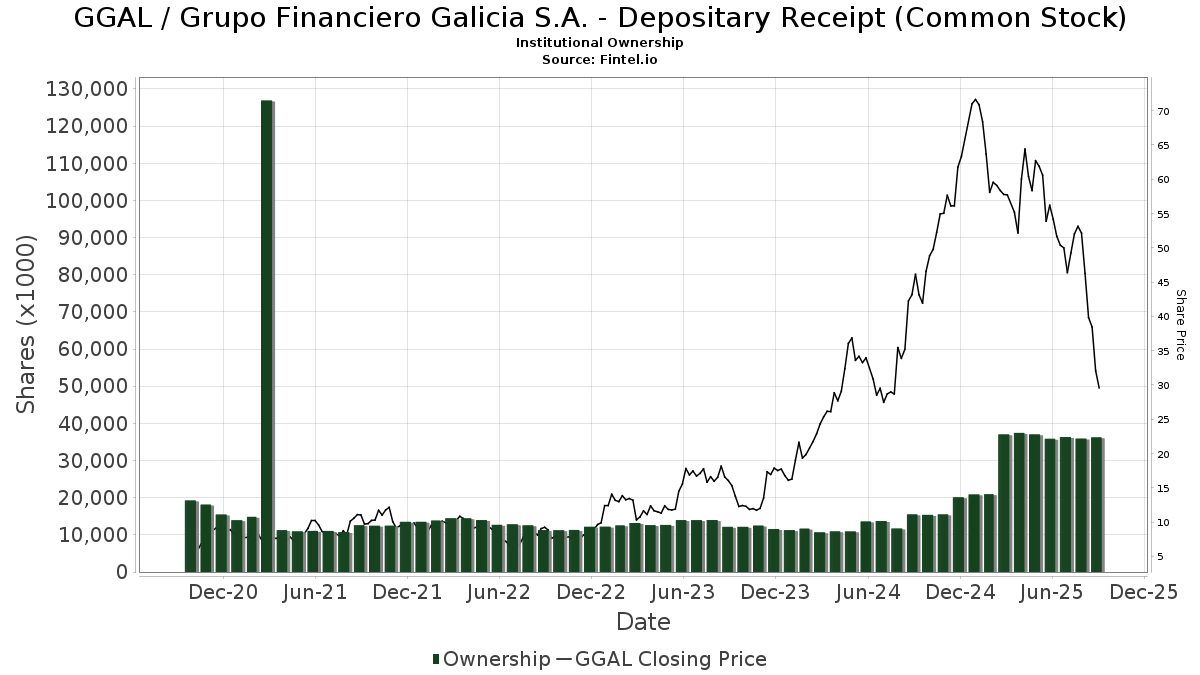
Grupo Financiero Galicia S.A. - Depositary Receipt (Common Stock) (US:GGAL) har 255 Institutionella ägare och aktieägare som har lämnat in 13D/G- eller 13F-formulär till Securities Exchange Commission (SEC). Dessa institut innehar totalt 36,223,402 aktier. Största aktieägare inkluderar GQG Partners LLC, GQGPX - GQG PARTNERS EMERGING MARKETS EQUITY FUND Investor Shares, MIRAE ASSET GLOBAL ETFS HOLDINGS Ltd., Price T Rowe Associates Inc /md/, PointState Capital LP, Axiom International Investors Llc /de, ARGT - Global X MSCI Argentina ETF, Morgan Stanley, Capital World Investors, and Driehaus Capital Management Llc .
Grupo Financiero Galicia S.A. - Depositary Receipt (Common Stock) (NasdaqCM:GGAL) Institutionell ägarstruktur visar institutioners och fonders nuvarande positioner i företaget, samt de senaste förändringarna i positionernas storlek. Större aktieägare kan vara enskilda investerare, fonder, hedgefonder eller institutioner. Bilaga 13D visar att investeraren äger (eller ägde) mer än 5% av företaget och avser (eller avsåg) att aktivt eftersträva en förändring av affärsstrategin. Schedule 13G indikerar en passiv investering på över 5%.
The share price as of September 10, 2025 is 32,07 / share. Previously, on September 11, 2024, the share price was 43,16 / share. This represents a decline of 25,70% over that period.
Fondsentimentets poäng
Fondsentimentet poängen(fka Ägarackumulation-poäng) visar vilka aktier som är mest köpta av fonder. Det är resultatet av en sofistikerad kvantitativ flerfaktormodell som identifierar företag med de högsta nivåerna av institutionell ackumulering. Poängsättningsmodellen använder en kombination av den totala ökningen av redovisade ägare, förändringarna i portföljallokeringarna för dessa ägare och andra mått. Siffran sträcker sig från 0 till 100, där högre siffror indikerar en högre nivå av ackumulering i förhållande till sina konkurrenter, och 50 är genomsnittet.
Uppdateringsfrekvens: Dagligen
Se Ownership Explorer, som innehåller en lista över de högst rankade företagen.
Institutionell sälj/köp-kvot
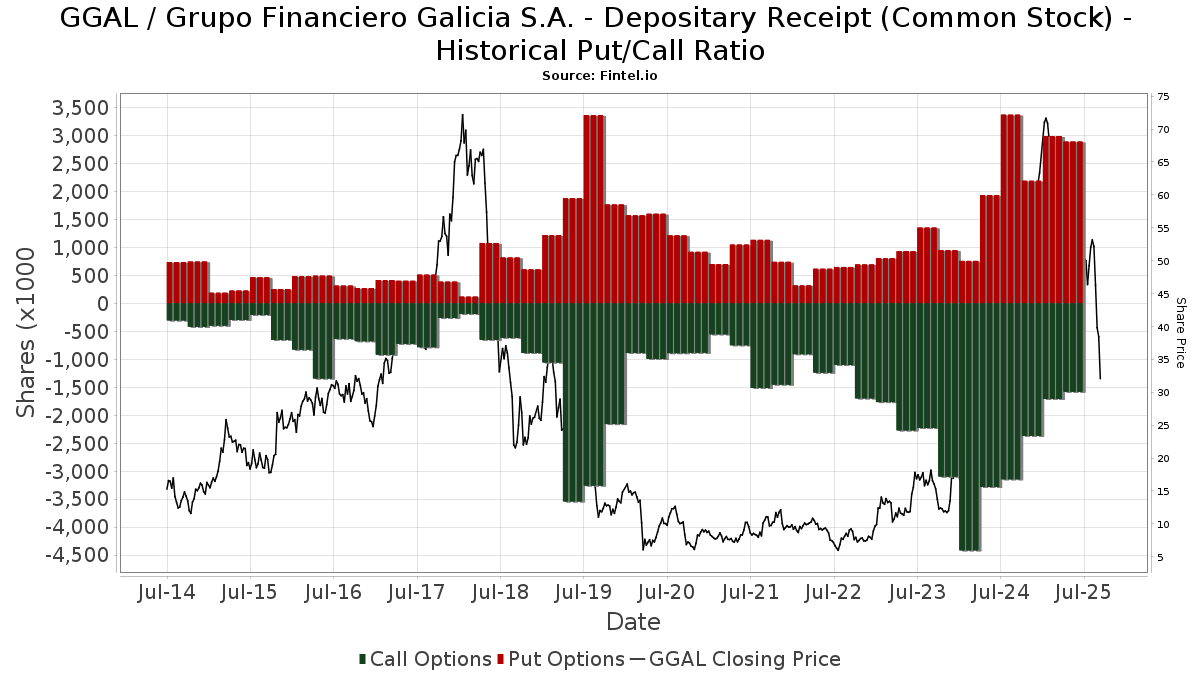
Förutom att rapportera vanliga eget kapital- och skuldemissioner måste institutioner med mer än 100MM tillgångar under förvaltning också avslöja sina innehav av sälj- och köpoptioner. Eftersom säljoptioner i allmänhet indikerar ett negativt sentiment och köpoptioner indikerar ett positivt sentiment, kan vi få en uppfattning om det övergripande institutionella sentimentet genom att plotta förhållandet mellan säljoptioner och köpoptioner. Diagrammet till höger visar det historiska förhållandet mellan sälj- och köpoptioner för detta instrument.
Genom att använda sälj/köp-kvoten som en indikator på aktieägarnas sentiment undviker man en av de största bristerna med att använda det totala institutionella ägandet, nämligen att en betydande del av de förvaltade tillgångarna investeras passivt för att följa index. Passivt förvaltade fonder köper vanligtvis inte optioner, så indikatorn för sälj/köp-kvoten ger en bättre bild av stämningen i aktivt förvaltade fonder.
13D/G-Arkiveringar
Vi presenterar 13D/G-arkiveringar separat från 13F-arkiveringar på grund av att de behandlas olika av SEC. 13D/G-arkiveringar kan lämnas in av grupper av investerare (med en ledare), medan 13F-arkiveringar inte kan det. Detta leder till situationer där en investerare kan lämna in en 13D/G-ansökan med ett värde för de totala aktierna (vilket motsvarar alla aktier som ägs av investerargruppen), men sedan lämna in en 13F-ansökan med ett annat värde för de totala aktierna (vilket motsvarar enbart deras eget ägande). Detta innebär att aktieägandet i 13D/G-arkiveringar och 13F-arkiveringar ofta inte är direkt jämförbara, så vi presenterar dem separat.
Notera: Från och med den 16 maj 2021 visar vi inte längre ägare som inte har lämnat in en 13D/G under det senaste året. Tidigare visade vi hela historiken för 13D/G-arkiveringar. I allmänhet måste enheter som är skyldiga att lämna in 13D/G-arkiveringar lämna in minst en gång per år innan de lämnar in en stängningsarkivering. Fonder avslutar dock ibland positioner utan att lämna in en avslutande arkivering (dvs. de avvecklar), så att visa hela historiken resulterade ibland i förvirring om det nuvarande ägandet. För att förhindra förvirring visar vi nu endast "nuvarande" ägare - det vill säga ägare som har lämnat in en ansökan under det senaste året.
Upgrade to unlock premium data.
| Fil Datum | Formulär | Investerare | Föregående aktier |
Senaste aktier |
Δ Aktier (Procent) |
Ägande (Procent) |
Δ Ägande (Procent) |
|
|---|---|---|---|---|---|---|---|---|
| 2025-06-20 | HSBC HOLDINGS PLC | 115,064,730 | 1,163,480 | -98.99 | 0.10 | -98.86 |
13F- och NPORT-arkiveringar
Detaljer om 13F-arkiveringar är gratis. Detaljer om NP-arkiveringar kräver ett premiummedlemskap. Gröna rader indikerar nya positioner. Röda rader indikerar stängda positioner. Klicka på länk symbolen för att se hela transaktionshistoriken.
Uppgradera
för att låsa upp premiumdata och exportera till Excel ![]() .
.
| Fil Datum | Källa | Investerare | Typ | Genomsnittligt pris (beräknat) |
Aktier | Δ Aktier (%) |
Rapporterat värde (1000 USD) |
Δ Värde (%) |
Portföljallokering (%) |
|
|---|---|---|---|---|---|---|---|---|---|---|
| 2025-08-12 | 13F | LPL Financial LLC | 23 721 | 200,91 | 1 195 | 178,55 | ||||
| 2025-05-29 | NP | GBEMX - Victory Sophus Emerging Markets Fund Class A | 25 410 | 1 384 | ||||||
| 2025-05-29 | NP | SEASONS SERIES TRUST - SA Putnam Asset Allocation Diversified Growth Portfolio Class 1 | 637 | 76,45 | 35 | 54,55 | ||||
| 2025-08-11 | 13F | Dorsey Wright & Associates | 53 980 | −38,70 | 2 720 | −43,29 | ||||
| 2025-06-23 | NP | Global Macro Absolute Return Advantage Portfolio - Global Macro Absolute Return Advantage Portfolio | 68 050 | 19,39 | 4 110 | 6,86 | ||||
| 2025-05-15 | 13F | Parallax Volatility Advisers, L.P. | Call | 0 | −100,00 | 0 | ||||
| 2025-07-14 | 13F | Ridgewood Investments LLC | 100 | 0,00 | 5 | 0,00 | ||||
| 2025-07-15 | 13F | Burns Matteson Capital Management, LLC | 6 340 | 39,56 | 319 | 29,15 | ||||
| 2025-05-15 | 13F | Parallax Volatility Advisers, L.P. | Put | 0 | −100,00 | 0 | ||||
| 2025-08-14 | 13F | Integrated Wealth Concepts LLC | 9 511 | 479 | ||||||
| 2025-07-22 | 13F | Gsa Capital Partners Llp | 4 979 | 0 | ||||||
| 2025-08-14 | 13F | Fmr Llc | 17 | 0,00 | 1 | |||||
| 2025-06-18 | NP | Putnam ETF Trust - Putnam Emerging Markets ex-China ETF - | 1 318 | 15,92 | 80 | 3,95 | ||||
| 2025-06-25 | NP | RPGEX - T. Rowe Price Global Growth Stock Fund This fund is a listed as child fund of Price T Rowe Associates Inc /md/ and if that institution has disclosed ownership in this security, then these positions will not be double counted when calculating total shares and total value | 93 963 | 6,53 | 5 675 | −4,65 | ||||
| 2025-05-15 | 13F | Tower Research Capital LLC (TRC) | 0 | −100,00 | 0 | |||||
| 2025-06-27 | NP | PCEMX - PACE International Emerging Markets Equity Investments Class P | 4 335 | −48,93 | 262 | −54,37 | ||||
| 2025-07-24 | NP | ONEQ - Fidelity Nasdaq Composite Index Tracking Stock This fund is a listed as child fund of Fmr Llc and if that institution has disclosed ownership in this security, then these positions will not be double counted when calculating total shares and total value | 14 826 | 0,47 | 861 | 1,90 | ||||
| 2025-05-29 | NP | PAEAX - Putnam Dynamic Asset Allocation Growth Fund Class A shares | 8 440 | 84,28 | 460 | 61,05 | ||||
| 2025-05-07 | 13F | Nkcfo Llc | 0 | −100,00 | 0 | |||||
| 2025-08-12 | 13F | Stelac Advisory Services LLC | 12 200 | 0,00 | 615 | −7,53 | ||||
| 2025-08-27 | NP | RYKIX - Banking Fund Investor Class | 4 195 | 29,04 | 211 | 19,21 | ||||
| 2025-08-01 | 13F | Jennison Associates Llc | 683 645 | −37,01 | 34 449 | −41,73 | ||||
| 2025-05-09 | 13F | JGP Global Gestao de Recursos Ltda. | 0 | −100,00 | 0 | |||||
| 2025-07-21 | 13F | Ping Capital Management, Inc. | 380 859 | −0,08 | 19 191 | −7,56 | ||||
| 2025-07-25 | 13F | NorthRock Partners, LLC | 6 066 | −0,02 | 306 | −7,58 | ||||
| 2025-05-05 | 13F | Ping Capital Management, Inc. | Call | 0 | −100,00 | 0 | −100,00 | |||
| 2025-08-14 | 13F | FIL Ltd | 0 | −100,00 | 0 | |||||
| 2025-07-18 | 13F | Truist Financial Corp | 7 891 | −3,00 | 398 | −10,38 | ||||
| 2025-08-01 | 13F | Envestnet Asset Management Inc | 45 463 | −3,55 | 2 291 | −10,79 | ||||
| 2025-08-08 | 13F | Wrapmanager Inc | 5 502 | −4,46 | 277 | −11,50 | ||||
| 2025-08-14 | 13F | Jane Street Group, Llc | Put | 75 900 | −55,82 | 3 825 | −59,13 | |||
| 2025-08-29 | NP | XC - WisdomTree Emerging Markets ex-China Fund N/A | 1 537 | 12,44 | 77 | 4,05 | ||||
| 2025-08-14 | 13F | Jane Street Group, Llc | Call | 200 000 | 9,89 | 10 078 | 1,66 | |||
| 2025-08-14 | 13F | Verition Fund Management LLC | 60 154 | 3 031 | ||||||
| 2025-07-29 | 13F | INCA Investments LLC | 1 069 878 | −2,60 | 53 911 | −9,90 | ||||
| 2025-07-29 | NP | RBB FUND, INC. - Aquarius International Fund | 13 272 | 77,96 | 770 | 80,75 | ||||
| 2025-08-14 | 13F | Jane Street Group, Llc | 989 585 | 5 165,15 | 49 865 | 4 774,39 | ||||
| 2025-07-17 | 13F | Park Place Capital Corp | 89 | 4 | ||||||
| 2025-08-08 | 13F | Fiera Capital Corp | 110 236 | 5 555 | ||||||
| 2025-05-15 | 13F | Compass Group Llc | 0 | −100,00 | 0 | |||||
| 2025-08-13 | 13F | Capital Fund Management S.a. | 0 | −100,00 | 0 | −100,00 | ||||
| 2025-08-07 | 13F | Mitsubishi UFJ Kokusai Asset Management Co., Ltd. | 0 | −100,00 | 0 | |||||
| 2025-08-14 | 13F | UBS Group AG | 60 406 | −13,87 | 3 044 | −20,34 | ||||
| 2025-05-15 | 13F | Glenmede Trust Co Na | 6 347 | 1,12 | 346 | −11,76 | ||||
| 2025-06-26 | NP | JIJIX - John Hancock International Dynamic Growth Fund Class NAV | 242 490 | −1,65 | 14 646 | −11,97 | ||||
| 2025-08-28 | NP | IDVO - Amplify International Enhanced Dividend Income ETF | 58 423 | 151,30 | 2 944 | 132,46 | ||||
| 2025-05-15 | 13F | Hood River Capital Management LLC | 0 | −100,00 | 0 | |||||
| 2025-08-14 | 13F | Brevan Howard Capital Management LP | 125 280 | 83,06 | 6 560 | 80,52 | ||||
| 2025-08-14 | 13F | UBS Group AG | Call | 98 000 | −18,33 | 4 938 | −24,45 | |||
| 2025-08-08 | 13F | Geode Capital Management, Llc | 54 525 | 0,67 | 2 748 | −6,88 | ||||
| 2025-08-13 | 13F | Northwestern Mutual Wealth Management Co | 0 | −100,00 | 0 | |||||
| 2025-08-14 | 13F | UBS Group AG | Put | 35 000 | 1 764 | |||||
| 2025-08-12 | 13F | Personal Cfo Solutions, Llc | 7 247 | 0,06 | 365 | −7,36 | ||||
| 2025-08-22 | NP | Columbia Funds Variable Series Trust II - Columbia Variable Portfolio - Emerging Markets Fund Class 3 | 46 824 | 0,00 | 2 359 | −7,49 | ||||
| 2025-08-14 | 13F | Headlands Technologies LLC | 423 | 21 | ||||||
| 2025-05-15 | 13F | Point72 (DIFC) Ltd | 0 | −100,00 | 0 | −100,00 | ||||
| 2025-08-14 | 13F | Van Eck Associates Corp | 104 614 | 5 | ||||||
| 2025-07-18 | 13F | La Banque Postale Asset Management SA | 12 300 | 44,71 | 620 | 33,98 | ||||
| 2025-08-14 | 13F | Seldon Capital Lp | 45 636 | 2 300 | ||||||
| 2025-08-25 | NP | AADR - AdvisorShares Dorsey Wright ADR ETF | 37 253 | 16,65 | 1 877 | 7,94 | ||||
| 2025-08-05 | 13F | Bank of New York Mellon Corp | 31 825 | 3,03 | 1 604 | −4,70 | ||||
| 2025-08-14 | 13F | Peak6 Llc | Call | 93 300 | 48,10 | 4 701 | 37,02 | |||
| 2025-07-09 | 13F | Systrade AG | 15 167 | 49,18 | 764 | 38,16 | ||||
| 2025-06-23 | NP | Global Macro Capital Opportunities Portfolio - Global Macro Capital Opportunities Portfolio | 284 925 | 92,26 | 17 209 | 72,09 | ||||
| 2025-08-14 | 13F | Moneda S.A. Administradora General de Fondos | 66 660 | 3 359 | ||||||
| 2025-08-12 | 13F | Global Retirement Partners, LLC | 199 | 10 | ||||||
| 2025-08-14 | 13F | BTG Pactual Asset Management US LLC | 8 577 | −26,31 | 432 | −31,86 | ||||
| 2025-08-14 | 13F | Peak6 Llc | Put | 38 200 | −57,46 | 1 925 | −60,66 | |||
| 2025-07-24 | 13F | Ramirez Asset Management, Inc. | 48 818 | 98,07 | 2 460 | 83,23 | ||||
| 2025-08-05 | 13F | Claro Advisors LLC | 0 | −100,00 | 0 | |||||
| 2025-08-13 | 13F | Hsbc Holdings Plc | 103 715 | −99,12 | 5 313 | −99,18 | ||||
| 2025-08-27 | NP | RYDEX VARIABLE TRUST - Banking Fund Variable Annuity | 925 | 120,24 | 47 | 109,09 | ||||
| 2025-06-25 | NP | IMRFX - Columbia Global Opportunities Fund Class A | 3 171 | 1,12 | 192 | −9,48 | ||||
| 2025-08-12 | 13F | Virtu Financial LLC | 13 561 | 1 | ||||||
| 2025-08-14 | 13F | Gemsstock Ltd. | 337 302 | 0,96 | 16 997 | −6,60 | ||||
| 2025-08-27 | 13F/A | Brinker Capital Investments, LLC | 7 661 | 386 | ||||||
| 2025-07-31 | 13F | Cambridge Investment Research Advisors, Inc. | 13 105 | 1 | ||||||
| 2025-06-26 | NP | EMQAX - Ashmore Emerging Markets Active Equity Fund CLASS A | 3 466 | 131,38 | 209 | 106,93 | ||||
| 2025-08-14 | 13F | Lazard Asset Management Llc | 65 133 | 3 | ||||||
| 2025-07-29 | 13F | William Blair Investment Management, Llc | 1 028 488 | −4,44 | 51 838 | −11,58 | ||||
| 2025-08-14 | 13F | Diversify Wealth Management, Llc | 42 705 | 14,54 | 2 229 | −2,75 | ||||
| 2025-08-14 | 13F | Graham Capital Management, L.P. | 15 986 | 265,14 | 806 | 238,24 | ||||
| 2025-08-13 | 13F | Jump Financial, LLC | 0 | −100,00 | 0 | |||||
| 2025-05-15 | 13F | Old Mission Capital Llc | 0 | −100,00 | 0 | −100,00 | ||||
| 2025-08-06 | 13F | Fox Run Management, L.l.c. | 0 | −100,00 | 0 | |||||
| 2025-08-13 | 13F | EverSource Wealth Advisors, LLC | 2 419 | 4,00 | 122 | −3,97 | ||||
| 2025-08-08 | 13F | Cetera Investment Advisers | 11 824 | 1,95 | 596 | −5,71 | ||||
| 2025-07-25 | NP | Putnam Funds Trust - Putnam Emerging Markets Equity Fund Class A | 22 345 | −12,48 | 1 297 | −11,16 | ||||
| 2025-08-14 | 13F | Ameriprise Financial Inc | 346 704 | −7,30 | 17 470 | −14,25 | ||||
| 2025-08-25 | NP | AMERICAN FUNDS INSURANCE SERIES - New World Fund Class 1 This fund is a listed as child fund of Capital World Investors and if that institution has disclosed ownership in this security, then these positions will not be double counted when calculating total shares and total value | 55 124 | 57,77 | 2 778 | 45,93 | ||||
| 2025-08-14 | 13F | Soros Fund Management Llc | 228 252 | 11 502 | ||||||
| 2025-08-12 | 13F | Jpmorgan Chase & Co | 75 302 | 93,20 | 3 794 | 78,71 | ||||
| 2025-06-25 | NP | PRIJX - T. Rowe Price Emerging Markets Discovery Stock Fund This fund is a listed as child fund of Price T Rowe Associates Inc /md/ and if that institution has disclosed ownership in this security, then these positions will not be double counted when calculating total shares and total value | 285 211 | −21,67 | 17 227 | −29,89 | ||||
| 2025-08-01 | 13F | Shilanski & Associates, Inc. | 7 983 | 0,08 | 402 | −7,37 | ||||
| 2025-08-14 | 13F | Point72 Asset Management, L.P. | 71 011 | 256,50 | 3 578 | 230,07 | ||||
| 2025-08-14 | 13F | Point72 Asset Management, L.P. | Call | 12 900 | 0,00 | 650 | −7,41 | |||
| 2025-08-14 | 13F | Point72 Asset Management, L.P. | Put | 12 400 | 625 | |||||
| 2025-08-25 | 13F/A | Neuberger Berman Group LLC | 73 896 | 3 731 | ||||||
| 2025-06-23 | NP | Global Macro Portfolio - Global Macro Portfolio | 17 186 | 13,07 | 1 038 | 1,27 | ||||
| 2025-08-13 | 13F | Russell Investments Group, Ltd. | 184 026 | −11,00 | 9 273 | −17,66 | ||||
| 2025-08-14 | 13F | Citadel Advisors Llc | Put | 551 500 | 61,73 | 27 790 | 49,62 | |||
| 2025-08-27 | 13F/A | Squarepoint Ops LLC | Call | 0 | −100,00 | 0 | ||||
| 2025-08-27 | 13F/A | Squarepoint Ops LLC | Put | 0 | −100,00 | 0 | ||||
| 2025-08-12 | 13F | Handelsbanken Fonder AB | 46 479 | 66,12 | 2 | 100,00 | ||||
| 2025-08-14 | 13F | Citadel Advisors Llc | 291 728 | 17,52 | 14 700 | 8,72 | ||||
| 2025-08-14 | 13F | Citadel Advisors Llc | Call | 113 100 | −51,89 | 5 699 | −55,49 | |||
| 2025-05-06 | 13F | Y-Intercept (Hong Kong) Ltd | 0 | −100,00 | 0 | |||||
| 2025-08-12 | 13F | Insigneo Advisory Services, Llc | 40 648 | 112,86 | 2 048 | 96,92 | ||||
| 2025-08-28 | NP | GQGPX - GQG PARTNERS EMERGING MARKETS EQUITY FUND Investor Shares | 2 040 261 | 102 809 | ||||||
| 2025-08-13 | 13F | Polen Capital Management Llc | 39 394 | 1 985 | ||||||
| 2025-08-13 | 13F | Victory Capital Management Inc | 11 877 | −91,03 | 598 | −91,70 | ||||
| 2025-08-13 | 13F | Northern Trust Corp | 12 176 | −86,35 | 614 | −87,38 | ||||
| 2025-08-12 | 13F | Proequities, Inc. | Put | 0 | 0 | |||||
| 2025-08-12 | 13F | Proequities, Inc. | Call | 0 | 0 | |||||
| 2025-08-12 | 13F | Proequities, Inc. | 0 | 0 | ||||||
| 2025-04-22 | 13F | Channing Global Advisors, Llc | 0 | −100,00 | 0 | |||||
| 2025-08-13 | 13F | Townsquare Capital Llc | 0 | −100,00 | 0 | |||||
| 2025-04-28 | 13F | Redmont Wealth Advisors Llc | 180 | 10 | ||||||
| 2025-05-09 | 13F | R Squared Ltd | 0 | −100,00 | 0 | |||||
| 2025-07-11 | 13F | Diversified Trust Co | 8 200 | 413 | ||||||
| 2025-08-13 | 13F | Invesco Ltd. | 40 072 | −0,69 | 2 019 | −8,10 | ||||
| 2025-08-14 | 13F | D. E. Shaw & Co., Inc. | Call | 12 500 | −85,80 | 630 | −86,88 | |||
| 2025-05-13 | 13F | Quadrature Capital Ltd | 0 | −100,00 | 0 | |||||
| 2025-08-13 | 13F | RWC Asset Management LLP | 242 772 | 447,59 | 12 233 | 406,75 | ||||
| 2025-05-16 | 13F | Empowered Funds, LLC | 0 | −100,00 | 0 | |||||
| 2025-06-25 | NP | PRLAX - T. Rowe Price Latin America Fund This fund is a listed as child fund of Price T Rowe Associates Inc /md/ and if that institution has disclosed ownership in this security, then these positions will not be double counted when calculating total shares and total value | 26 998 | 1,12 | 1 631 | −9,49 | ||||
| 2025-08-07 | 13F | NS Partners Ltd | 192 900 | 9 720 | ||||||
| 2025-05-08 | NP | QGBLX - Quantified Global Fund Investor Class | 1 098 | 272,20 | 60 | 227,78 | ||||
| 2025-08-21 | NP | GBFAX - Emerging Markets Fund Class A | 68 957 | 3 475 | ||||||
| 2025-07-30 | 13F | Blume Capital Management, Inc. | 1 004 | 0,00 | 51 | −7,41 | ||||
| 2025-08-13 | 13F | Carmignac Gestion | 77 070 | −44,57 | 3 889 | −48,68 | ||||
| 2025-08-27 | NP | Jnl Series Trust - Jnl/lazard Emerging Markets Fund (a) | 45 723 | 82,74 | 2 304 | 69,09 | ||||
| 2025-05-05 | 13F | Eagle Bay Advisors LLC | 0 | −100,00 | 0 | |||||
| 2025-08-06 | 13F | Agf Management Ltd | 251 275 | 12 662 | ||||||
| 2025-05-13 | 13F | Alliance Wealth Advisors, LLC /UT | 0 | −100,00 | 0 | |||||
| 2025-08-07 | 13F | Fourth Sail Capital LP | 0 | −100,00 | 0 | |||||
| 2025-08-14 | 13F | Two Sigma Investments, Lp | 23 805 | −84,40 | 1 200 | −85,58 | ||||
| 2025-07-11 | 13F | Farther Finance Advisors, LLC | 100 | 66,67 | 5 | 66,67 | ||||
| 2025-08-12 | 13F | Deutsche Bank Ag\ | 22 500 | −18,18 | 1 134 | −24,32 | ||||
| 2025-08-08 | 13F | Financial Gravity Companies, Inc. | 12 | 0,00 | 1 | |||||
| 2025-08-14 | 13F/A | Barclays Plc | 20 730 | 242,08 | 1 | |||||
| 2025-08-12 | 13F | Ci Investments Inc. | 760 319 | 335,89 | 38 | 322,22 | ||||
| 2025-08-04 | 13F | AdvisorShares Investments LLC | 37 253 | 16,65 | 1 877 | 6,47 | ||||
| 2025-08-12 | 13F | MAI Capital Management | 4 | 0 | ||||||
| 2025-08-14 | 13F | Susquehanna International Group, Llp | 134 045 | 187,12 | 6 755 | 165,70 | ||||
| 2025-08-14 | 13F | Susquehanna International Group, Llp | Call | 572 300 | −6,88 | 28 838 | −13,86 | |||
| 2025-08-14 | 13F | Engineers Gate Manager LP | 10 273 | −67,25 | 518 | −69,73 | ||||
| 2025-08-14 | 13F | D. E. Shaw & Co., Inc. | Put | 0 | −100,00 | 0 | −100,00 | |||
| 2025-08-14 | 13F | Discovery Capital Management, Llc / Ct | 500 000 | −50,39 | 25 195 | −54,10 | ||||
| 2025-08-14 | 13F | Susquehanna International Group, Llp | Put | 968 000 | −7,27 | 48 778 | −14,22 | |||
| 2025-08-19 | 13F | National Asset Management, Inc. | 0 | −100,00 | 0 | |||||
| 2025-08-20 | NP | WXCIX - William Blair Emerging Markets ex China Growth Fund Class I | 5 488 | −11,08 | 277 | −17,86 | ||||
| 2025-08-14 | 13F | Burkehill Global Management, LP | 200 000 | 10 078 | ||||||
| 2025-08-11 | 13F | HighTower Advisors, LLC | 11 379 | 573 | ||||||
| 2025-08-14 | 13F | Wellington Management Group Llp | 637 501 | 32 124 | ||||||
| 2025-06-18 | NP | RAZAX - Multi-Asset Growth Strategy Fund Class A | 609 | −75,88 | 37 | −78,82 | ||||
| 2025-08-13 | 13F | Schroder Investment Management Group | 0 | −100,00 | 0 | |||||
| 2025-07-10 | 13F | Baader Bank INC | 5 386 | −13,82 | 264 | −21,96 | ||||
| 2025-08-13 | 13F | Walleye Capital LLC | Call | 11 000 | 1,85 | 554 | −5,78 | |||
| 2025-07-23 | 13F | Vontobel Holding Ltd. | 4 136 | 0,00 | 208 | −7,56 | ||||
| 2025-08-11 | 13F | Citigroup Inc | 20 413 | 34,69 | 1 029 | 24,61 | ||||
| 2025-08-14 | 13F | Glenmede Investment Management, LP | 6 347 | 320 | ||||||
| 2025-08-13 | 13F | Arrowstreet Capital, Limited Partnership | 1 066 605 | −6,16 | 53 746 | −13,19 | ||||
| 2025-05-29 | NP | PUTNAM VARIABLE TRUST - Putnam VT International Growth Fund Class IA Shares | 1 667 | 84,81 | 91 | 60,71 | ||||
| 2025-08-13 | 13F | Walleye Capital LLC | Put | 5 100 | 1 175,00 | 257 | 1 119,05 | |||
| 2025-08-14 | 13F | Wells Fargo & Company/mn | 12 406 | 473,03 | 625 | 434,19 | ||||
| 2025-05-29 | NP | VICTORY VARIABLE INSURANCE FUNDS - Victory Sophus Emerging Markets VIP Series Class I | 1 952 | 106 | ||||||
| 2025-08-08 | 13F | SBI Securities Co., Ltd. | 1 202 | 240,51 | 61 | 215,79 | ||||
| 2025-08-11 | 13F | Absolute Gestao de Investimentos Ltda. | 9 500 | −75,95 | 479 | −77,78 | ||||
| 2025-08-26 | NP | DREGX - DRIEHAUS EMERGING MARKETS GROWTH FUND Investor Share Class | 501 475 | 86,26 | 25 269 | 72,32 | ||||
| 2025-06-27 | NP | EAEMX - Parametric Emerging Markets Fund Investor Class | 2 555 | 1,11 | 154 | −9,41 | ||||
| 2025-04-30 | 13F | Sofos Investments, Inc. | 12 | 1 | ||||||
| 2025-08-12 | 13F | SPX Equities Gestao de Recursos Ltda | 368 261 | 66,10 | 18 557 | 53,66 | ||||
| 2025-08-14 | 13F | Cubist Systematic Strategies, LLC | Call | 3 100 | −87,70 | 156 | −88,63 | |||
| 2025-08-25 | NP | MEMX - Matthews Emerging Markets ex China Active ETF | 5 996 | 302 | ||||||
| 2025-08-14 | 13F | Cubist Systematic Strategies, LLC | 157 089 | −29,52 | 7 916 | −34,80 | ||||
| 2025-08-13 | 13F | Options Solutions, Llc | 25 986 | −7,90 | 1 309 | −14,78 | ||||
| 2025-07-18 | 13F | Deltec Asset Management Llc | 19 300 | 183,41 | 973 | 162,70 | ||||
| 2025-08-14 | 13F | Group One Trading, L.p. | 228 898 | 119,16 | 11 534 | 102,74 | ||||
| 2025-08-27 | 13F/A | Squarepoint Ops LLC | 15 019 | 757 | ||||||
| 2025-07-25 | 13F | Cwm, Llc | 91 | 0,00 | 0 | |||||
| 2025-08-15 | 13F | Duquesne Family Office LLC | 231 481 | −39,32 | 12 | −45,00 | ||||
| 2025-08-14 | 13F | Group One Trading, L.p. | Put | 555 500 | 117,08 | 27 992 | 100,83 | |||
| 2025-08-14 | 13F | Balyasny Asset Management Llc | Put | 7 000 | 353 | |||||
| 2025-08-14 | 13F | Group One Trading, L.p. | Call | 160 000 | 0,44 | 8 062 | −7,09 | |||
| 2025-08-14 | 13F | Millennium Management Llc | 345 014 | −4,29 | 17 385 | −11,46 | ||||
| 2025-08-04 | 13F | Atria Investments Llc | 13 196 | −1,34 | 665 | −8,79 | ||||
| 2025-05-15 | 13F | Ancient Art, L.P. | 0 | −100,00 | 0 | |||||
| 2025-05-15 | 13F | Rokos Capital Management LLP | Put | 0 | −100,00 | 0 | −100,00 | |||
| 2025-08-11 | 13F | Rwc Asset Advisors (us) Llc | 162 452 | −28,58 | 8 186 | −33,94 | ||||
| 2025-08-14 | 13F | Driehaus Capital Management Llc | 1 095 098 | 74,36 | 55 182 | 61,30 | ||||
| 2025-08-12 | 13F | Edmond De Rothschild Holding S.a. | 7 880 | −14,16 | 397 | −20,60 | ||||
| 2025-08-14 | 13F | Stifel Financial Corp | 18 497 | −5,41 | 932 | −12,49 | ||||
| 2025-08-14 | 13F | Millennium Management Llc | Put | 14 100 | −14,55 | 710 | −20,94 | |||
| 2025-05-15 | 13F | Amundi | 0 | −100,00 | 0 | |||||
| 2025-05-07 | 13F | Marvin & Palmer Associates Inc | 0 | −100,00 | 0 | |||||
| 2025-05-13 | 13F | Moerus Capital Management LLC | 0 | −100,00 | 0 | |||||
| 2025-08-14 | 13F | Tudor Investment Corp Et Al | Call | 25 500 | −32,72 | 1 285 | −37,79 | |||
| 2025-08-14 | 13F | Tudor Investment Corp Et Al | Put | 7 200 | −89,80 | 363 | −90,59 | |||
| 2025-04-14 | 13F | IMC-Chicago, LLC | Call | 0 | −100,00 | 0 | −100,00 | |||
| 2025-08-14 | 13F | Balyasny Asset Management Llc | 30 526 | 268,23 | 1 538 | 241,02 | ||||
| 2025-08-14 | 13F | Barometer Capital Management Inc. | 6 884 | −45,73 | 346 | −50,00 | ||||
| 2025-08-14 | 13F | Balyasny Asset Management Llc | Call | 7 300 | 368 | |||||
| 2025-07-25 | NP | USEMX - Emerging Markets Fund Shares | 16 751 | 972 | ||||||
| 2025-04-14 | 13F | IMC-Chicago, LLC | 0 | −100,00 | 0 | −100,00 | ||||
| 2025-05-15 | 13F | Jain Global LLC | 0 | −100,00 | 0 | |||||
| 2025-08-14 | 13F | Voloridge Investment Management, Llc | 298 935 | 15 063 | ||||||
| 2025-08-27 | NP | JNL SERIES TRUST - JNL/GQG Emerging Markets Equity Fund (A) | 76 898 | 3 875 | ||||||
| 2025-06-18 | NP | RTNAX - Tax-Managed International Equity Fund Class A | 30 645 | −33,05 | 1 851 | −40,09 | ||||
| 2025-05-13 | 13F | Stokes Family Office, LLC | 0 | −100,00 | 0 | |||||
| 2025-08-14 | 13F | Benjamin Edwards Inc | 6 054 | 2,18 | 305 | −5,28 | ||||
| 2025-08-14 | 13F | Raymond James Financial Inc | 3 001 | 151 | ||||||
| 2025-07-30 | 13F | Whittier Trust Co Of Nevada Inc | 6 881 | 63,17 | 347 | 51,09 | ||||
| 2025-07-30 | 13F | Whittier Trust Co | 13 842 | 11,63 | 697 | 3,26 | ||||
| 2025-07-09 | 13F | Crocodile Capital Partners GmbH | 10 000 | 0,00 | 504 | −7,54 | ||||
| 2025-08-13 | 13F | Seven Grand Managers, Llc | 200 000 | 10 078 | ||||||
| 2025-08-26 | NP | NMMEX - Active M Emerging Markets Equity Fund | 9 501 | 6,42 | 479 | −1,65 | ||||
| 2025-04-15 | 13F | Assenagon Asset Management S.A. | 0 | −100,00 | 0 | |||||
| 2025-08-27 | NP | Advanced Series Trust - Ast Prudential Growth Allocation Portfolio | 9 741 | −36,54 | 491 | −41,39 | ||||
| 2025-07-30 | 13F | Wallace Advisory Group, LLC | 0 | −100,00 | 0 | |||||
| 2025-08-14 | 13F | Price T Rowe Associates Inc /md/ | 1 920 829 | 27,95 | 97 | 18,52 | ||||
| 2025-08-01 | 13F | Banco Santander, S.A. | 37 844 | 13,11 | 1 907 | 4,61 | ||||
| 2025-07-25 | NP | EEMAX - Columbia Emerging Markets Fund Class A | 77 146 | 0,00 | 4 478 | 1,45 | ||||
| 2025-07-14 | 13F | Painted Porch Advisors LLC | 371 | 0,00 | 19 | −10,00 | ||||
| 2025-08-13 | 13F | Capital World Investors | 1 099 332 | 60,02 | 55 395 | 48,04 | ||||
| 2025-05-05 | 13F | Creekmur Asset Management LLC | 0 | −100,00 | 0 | |||||
| 2025-07-16 | 13F | ABS Direct Equity Fund LLC | 27 648 | 32,98 | 1 393 | 23,06 | ||||
| 2025-08-13 | 13F | Quantbot Technologies LP | 2 129 | −90,06 | 107 | −90,82 | ||||
| 2025-08-14 | 13F | Mariner, LLC | 7 994 | 4,46 | 403 | −3,37 | ||||
| 2025-06-27 | NP | ARGT - Global X MSCI Argentina ETF This fund is a listed as child fund of Mirae Asset Global Investments Co., Ltd. and if that institution has disclosed ownership in this security, then these positions will not be double counted when calculating total shares and total value | 1 260 613 | −11,05 | 76 141 | −20,38 | ||||
| 2025-08-14 | 13F | Cubist Systematic Strategies, LLC | Put | 0 | −100,00 | 0 | ||||
| 2025-08-25 | NP | MMIUX - MassMutual Select T. Rowe Price International Equity Fund Class I | 2 363 | −29,67 | 119 | −34,97 | ||||
| 2025-08-04 | 13F | Spire Wealth Management | 0 | −100,00 | 0 | |||||
| 2025-08-14 | 13F | CoreCap Advisors, LLC | 100 | 0,00 | 5 | 0,00 | ||||
| 2025-08-15 | 13F | Binnacle Investments Inc | 25 | 1 | ||||||
| 2025-08-11 | 13F | TD Waterhouse Canada Inc. | 1 | 0,00 | 0 | |||||
| 2025-07-09 | 13F | Bank of New Hampshire | 4 825 | −75,54 | 243 | −77,37 | ||||
| 2025-08-28 | NP | RWCIX - RWC Global Emerging Equity Fund Class I Shares | 8 389 | −2,24 | 423 | −9,64 | ||||
| 2025-07-30 | 13F | Eqis Capital Management, Inc. | 0 | −100,00 | 0 | |||||
| 2025-06-27 | 13F/A | Goldman Sachs Group Inc | Put | 0 | −100,00 | 0 | −100,00 | |||
| 2025-08-05 | 13F | Simplex Trading, Llc | Put | 49 700 | −49,85 | 3 | −60,00 | |||
| 2025-05-07 | 13F/A | Symmetry Investments LP | Call | 0 | −100,00 | 0 | −100,00 | |||
| 2025-08-05 | 13F | Simplex Trading, Llc | 21 896 | −0,27 | 1 | 0,00 | ||||
| 2025-08-05 | 13F | Simplex Trading, Llc | Call | 40 900 | 85,07 | 2 | 100,00 | |||
| 2025-08-13 | 13F | Guggenheim Capital Llc | 5 120 | 258 | ||||||
| 2025-05-15 | 13F | Canada Pension Plan Investment Board | 0 | −100,00 | 0 | |||||
| 2025-08-14 | 13F | Peak6 Llc | 0 | −100,00 | 0 | −100,00 | ||||
| 2025-07-16 | 13F | ORG Wealth Partners, LLC | 153 | 0,00 | 8 | −12,50 | ||||
| 2025-07-29 | 13F | Activest Wealth Management | 33 728 | 1,75 | 1 700 | −5,87 | ||||
| 2025-08-13 | 13F | Northwest & Ethical Investments L.P. | 10 606 | 0,00 | 534 | −7,45 | ||||
| 2025-08-14 | 13F | CIBC World Markets Inc. | 4 465 | 0,00 | 224 | −7,82 | ||||
| 2025-08-20 | NP | WBENX - William Blair Emerging Markets Growth Fund Class N | 90 482 | −6,35 | 4 559 | −13,38 | ||||
| 2025-07-28 | NP | TEMUX - Emerging Markets Equity Fund | 8 500 | 470,09 | 493 | 4 381,82 | ||||
| 2025-08-14 | 13F/A | Skopos Labs, Inc. | 1 043 | 492,61 | 53 | 477,78 | ||||
| 2025-08-08 | 13F | Itau Unibanco Holding S.A. | 893 965 | 90,50 | 45 047 | 187 591,67 | ||||
| 2025-08-13 | 13F | Shelton Capital Management | 0 | −100,00 | 0 | |||||
| 2025-08-13 | 13F | Mirabella Financial Services Llp | 0 | −100,00 | 0 | |||||
| 2025-08-05 | 13F | Advisors Preferred, LLC | 0 | −100,00 | 0 | |||||
| 2025-08-14 | 13F | PointState Capital LP | 1 598 899 | 6,30 | 80 569 | −1,66 | ||||
| 2025-08-14 | 13F | MIRAE ASSET GLOBAL ETFS HOLDINGS Ltd. | 1 937 465 | 52,20 | 97 629 | 40,80 | ||||
| 2025-08-07 | 13F | Capital Wealth Planning, LLC | 30 745 | 32,25 | 1 549 | 22,35 | ||||
| 2025-08-21 | NP | ECEIX - Lazard Emerging Markets Core Equity Portfolio Institutional Shares | 12 149 | 612 | ||||||
| 2025-04-29 | 13F | SMART Wealth LLC | 0 | −100,00 | 0 | |||||
| 2025-07-29 | 13F | Beverly Hills Private Wealth, LLC | 6 869 | −5,61 | 346 | −12,63 | ||||
| 2025-07-28 | NP | NEMAX - Neuberger Berman Emerging Markets Equity Fund Class A | 15 435 | 896 | ||||||
| 2025-08-14 | 13F | Schonfeld Strategic Advisors LLC | 0 | −100,00 | 0 | |||||
| 2025-08-11 | 13F | Principal Securities, Inc. | 0 | −100,00 | 0 | |||||
| 2025-08-12 | 13F | Aigen Investment Management, Lp | 0 | −100,00 | 0 | |||||
| 2025-07-23 | 13F | Ameliora Wealth Management Ltd. | 0 | −100,00 | 0 | |||||
| 2025-07-14 | 13F | GAMMA Investing LLC | 2 532 | −5,94 | 128 | −13,01 | ||||
| 2025-08-19 | 13F | Marex Group plc | 12 451 | 627 | ||||||
| 2025-08-14 | 13F | Goldman Sachs Group Inc | Call | 9 700 | 0,00 | 489 | −7,58 | |||
| 2025-06-18 | NP | REMSX - Emerging Markets Fund Class S | 13 022 | −35,31 | 787 | −42,12 | ||||
| 2025-05-09 | 13F | GeoWealth Management, LLC | 0 | −100,00 | 0 | |||||
| 2025-05-15 | 13F | Scientech Research LLC | 0 | −100,00 | 0 | |||||
| 2025-08-14 | 13F | Goldman Sachs Group Inc | 200 240 | 41,10 | 10 090 | 30,53 | ||||
| 2025-08-15 | 13F | Great West Life Assurance Co /can/ | 217 | −10,33 | 0 | |||||
| 2025-08-26 | NP | MCTOX - Modern Capital Tactical Opportunities Fund Class A Shares | 46 000 | 109,09 | 2 318 | 93,41 | ||||
| 2025-05-14 | 13F | Credit Agricole S A | 1 750 | 0,00 | 95 | −12,84 | ||||
| 2025-08-13 | 13F | Walleye Trading LLC | Call | 108 600 | 334,40 | 5 472 | 302,06 | |||
| 2025-08-14 | 13F | Diversify Advisory Services, LLC | 13 486 | 26,01 | 704 | 7,00 | ||||
| 2025-06-17 | NP | GSEQX - Goldman Sachs Multi-Manager Global Equity Fund Class R6 Shares | 6 356 | −37,44 | 384 | −44,09 | ||||
| 2025-07-11 | 13F | Seacrest Wealth Management, Llc | 9 445 | −1,36 | 476 | −8,83 | ||||
| 2025-07-24 | 13F | Ronald Blue Trust, Inc. | 3 528 | 184,75 | 178 | 164,18 | ||||
| 2025-08-13 | 13F | Walleye Trading LLC | Put | 188 500 | 89,45 | 9 499 | 75,27 | |||
| 2025-08-14 | 13F | Aquatic Capital Management LLC | 0 | −100,00 | 0 | |||||
| 2025-08-13 | 13F | Walleye Trading LLC | 28 547 | 457,45 | 1 438 | 417,27 | ||||
| 2025-08-14 | 13F | Bank Of America Corp /de/ | 125 279 | 117,08 | 6 313 | 100,83 | ||||
| 2025-08-14 | 13F | Nwi Management Lp | 99 312 | 0,00 | 5 | 0,00 | ||||
| 2025-08-14 | 13F | Longaeva Partners L.P. | 12 277 | 619 | ||||||
| 2025-08-13 | 13F | Jones Financial Companies Lllp | 1 562 | 81 | ||||||
| 2025-07-30 | NP | APIE - ActivePassive International Equity ETF | 11 822 | 62,57 | 686 | 64,90 | ||||
| 2025-07-23 | 13F | Triasima Portfolio Management inc. | 6 873 | −6,11 | 346 | −13,07 | ||||
| 2025-07-31 | 13F | Caitong International Asset Management Co., Ltd | 42 | 223,08 | 2 | |||||
| 2025-08-14 | 13F | Bnp Paribas Arbitrage, Sa | 177 635 | −21,72 | 8 951 | −27,58 | ||||
| 2025-08-14 | 13F | State Street Corp | 0 | −100,00 | 0 | |||||
| 2025-06-11 | NP | SEKAX - DWS Emerging Markets Equity Fund Class A | 20 000 | −20,00 | 1 208 | −28,39 | ||||
| 2025-05-15 | 13F | Ewing Morris & Co. Investment Partners Ltd. | 0 | −100,00 | 0 | |||||
| 2025-07-28 | 13F | Bayforest Capital Ltd | 5 332 | 269 | ||||||
| 2025-08-08 | 13F | Pnc Financial Services Group, Inc. | 160 | 0,00 | 8 | 0,00 | ||||
| 2025-08-13 | 13F | Pictet Asset Management Holding SA | 6 306 | −83,24 | 318 | −84,53 | ||||
| 2025-08-14 | 13F | Deprince Race & Zollo Inc | 204 907 | 55,38 | 10 325 | 43,74 | ||||
| 2025-08-14 | 13F | GWM Advisors LLC | 9 003 | 0,00 | 454 | −7,55 | ||||
| 2025-08-14 | 13F | Samlyn Capital, Llc | 437 515 | 22 046 | ||||||
| 2025-07-11 | 13F | Harbour Capital Advisors, LLC | 18 375 | −0,81 | 926 | −6,85 | ||||
| 2025-08-13 | 13F | Marshall Wace, Llp | 105 165 | 5 299 | ||||||
| 2025-08-14 | 13F | Ratan Capital Management LP | 55 000 | −71,79 | 2 771 | −73,91 | ||||
| 2025-08-12 | 13F | Franklin Resources Inc | 0 | −100,00 | 0 | |||||
| 2025-08-15 | 13F | Morgan Stanley | 1 251 697 | 78,29 | 63 073 | 64,94 | ||||
| 2025-08-14 | 13F | Turim 21 Investimentos Ltda. | 17 700 | 0,00 | 892 | −7,57 | ||||
| 2025-08-14 | 13F | Caption Management, LLC | Put | 305 700 | −21,49 | 15 404 | −27,37 | |||
| 2025-08-04 | 13F | Hantz Financial Services, Inc. | 405 | 5 685,71 | 0 | |||||
| 2025-08-18 | 13F | Wolverine Trading, Llc | 0 | −100,00 | 0 | −100,00 | ||||
| 2025-06-24 | NP | Innovator ETFs Trust - Innovator IBD Breakout Opportunities ETF | 903 | 55 | ||||||
| 2025-08-14 | 13F | Caption Management, LLC | 275 708 | 11,40 | 13 893 | 3,05 | ||||
| 2025-08-13 | 13F | Capital Fund Management S.a. | Call | 84 200 | −6,96 | 4 243 | −13,94 | |||
| 2025-08-14 | 13F | Qube Research & Technologies Ltd | 0 | −100,00 | 0 | |||||
| 2025-08-21 | NP | VanEck VIP Trust - VanEck VIP Emerging Markets Fund Initial Class | 15 299 | 771 | ||||||
| 2025-08-29 | NP | XSOE - WisdomTree Emerging Markets ex-State-Owned Enterprises Fund N/A | 29 675 | 1,51 | 1 495 | −6,09 | ||||
| 2025-08-13 | 13F | Capital Fund Management S.a. | Put | 27 700 | −52,32 | 1 396 | −55,91 | |||
| 2025-08-14 | 13F/A | Barclays Plc | Put | 0 | −100,00 | 0 | −100,00 | |||
| 2025-08-14 | 13F | Rokos Capital Management LLP | 110 167 | 0,37 | 5 549 | −7,19 | ||||
| 2025-08-14 | 13F | Royal Bank Of Canada | 1 675 | −11,05 | 85 | −17,48 | ||||
| 2025-07-25 | NP | USAWX - World Growth Fund Shares | 7 856 | 456 | ||||||
| 2025-06-11 | NP | SLANX - DWS Latin America Equity Fund Class A | 48 280 | −51,72 | 2 916 | 143,00 | ||||
| 2025-05-28 | NP | KOMP - SPDR S&P Kensho New Economies Composite ETF This fund is a listed as child fund of State Street Corp and if that institution has disclosed ownership in this security, then these positions will not be double counted when calculating total shares and total value | 66 562 | 2,76 | 3 626 | −10,18 | ||||
| 2025-08-04 | 13F | Yorktown Management & Research Co Inc | 7 450 | 0,00 | 375 | −7,41 | ||||
| 2025-08-07 | 13F | Axiom International Investors Llc /de | 1 442 719 | −1,58 | 72 699 | −8,96 | ||||
| 2025-07-25 | NP | PUTNAM FUNDS TRUST - Putnam Dynamic Asset Allocation Equity Fund Class A | 180 | −11,76 | 10 | −9,09 | ||||
| 2025-08-14 | 13F | Sei Investments Co | 201 141 | −12,86 | 10 135 | −19,39 | ||||
| 2025-08-14 | 13F | Riggs Asset Managment Co. Inc. | 16 | 1 | ||||||
| 2025-06-30 | NP | APITX - Yorktown Growth Fund Class L Shares | 7 450 | 0,00 | 450 | −10,56 | ||||
| 2025-09-04 | 13F/A | Advisor Group Holdings, Inc. | 8 711 | 439 | ||||||
| 2025-07-21 | 13F | Mirae Asset Global Investments Co., Ltd. | 2 369 | 9,73 | 119 | 0,00 | ||||
| 2025-08-07 | NP | OTGAX - OTG Latin America Fund Class A Shares | 4 540 | 229 | ||||||
| 2025-08-12 | 13F | CIBC Private Wealth Group, LLC | 557 | 3,15 | 28 | 16,67 | ||||
| 2025-07-24 | 13F | Verde Servicos Internacionais S.A. | 500 | 0 | ||||||
| 2025-08-14 | 13F | Banco BTG Pactual S.A. | 487 916 | 198,31 | 24 586 | 175,97 | ||||
| 2025-08-13 | 13F | GQG Partners LLC | 3 127 768 | 157 608 | ||||||
| 2025-06-18 | NP | RMYAX - Multi-Strategy Income Fund Class A | 530 | 0,00 | 32 | −8,57 | ||||
| 2025-08-14 | 13F | Tudor Investment Corp Et Al | 0 | −100,00 | 0 | −100,00 | ||||
| 2025-08-12 | 13F | Sagil Capital Llp | 195 000 | 9 826 | ||||||
| 2025-06-26 | NP | NEWFX - NEW WORLD FUND INC Class A | 635 876 | 131,00 | 38 407 | 106,76 | ||||
| 2025-06-26 | NP | PDEAX - PGIM JENNISON EMERGING MARKETS EQUITY OPPORTUNITIES FUND Class A | 477 551 | −10,22 | 28 844 | −19,64 | ||||
| 2025-07-22 | 13F | IMC-Chicago, LLC | Put | 28 000 | 13,82 | 1 411 | 5,30 | |||
| 2025-08-19 | 13F | Anchor Investment Management, LLC | 303 | 0,00 | 15 | −6,25 | ||||
| 2025-07-24 | NP | FNCMX - Fidelity Nasdaq Composite Index Fund This fund is a listed as child fund of Fmr Llc and if that institution has disclosed ownership in this security, then these positions will not be double counted when calculating total shares and total value | 39 505 | 22,52 | 2 293 | 24,28 | ||||
| 2025-06-23 | NP | UBPIX - Ultralatin America Profund Investor Class | 2 387 | 5,02 | 144 | −5,88 | ||||
| 2025-05-09 | 13F | DJE Kapital AG | 0 | −100,00 | 0 | |||||
| 2025-05-15 | 13F | D. E. Shaw & Co., Inc. | 0 | −100,00 | 0 | −100,00 | ||||
| 2025-08-18 | 13F | Wolverine Trading, Llc | Call | 24 300 | 140,59 | 1 256 | 122,91 | |||
| 2025-08-18 | 13F | Wolverine Trading, Llc | Put | 22 800 | −31,33 | 1 178 | −36,36 | |||
| 2025-08-06 | 13F | Commonwealth Equity Services, Llc | 6 467 | 0,09 | 0 | |||||
| 2025-08-14 | 13F | Vident Advisory, LLC | 5 031 | −7,31 | 254 | −14,24 |