Grundläggande statistik
| Institutionella ägare | 235 total, 231 long only, 0 short only, 4 long/short - change of 5,38% MRQ |
| Genomsnittlig portföljallokering | 0.1604 % - change of 14,63% MRQ |
| Institutionella aktier (lång) | 56 008 368 (ex 13D/G) - change of 1,02MM shares 1,86% MRQ |
| Institutionellt värde (lång) | $ 1 534 222 USD ($1000) |
Institutionellt ägande och aktieägare
Fresenius Medical Care AG - Depositary Receipt (Common Stock) (US:FMS) har 235 Institutionella ägare och aktieägare som har lämnat in 13D/G- eller 13F-formulär till Securities Exchange Commission (SEC). Dessa institut innehar totalt 56,008,368 aktier. Största aktieägare inkluderar Pzena Investment Management Llc, VWNDX - Vanguard Windsor Fund Investor Shares, Fiduciary Management Inc /wi/, Dodge & Cox, DODBX - Dodge & Cox Balanced Fund, VASVX - Vanguard Selected Value Fund Investor Shares, Morgan Stanley, FMIHX - Large Cap Fund Investor Class, Todd Asset Management Llc, and Liberty All Star Equity Fund .
Fresenius Medical Care AG - Depositary Receipt (Common Stock) (NYSE:FMS) Institutionell ägarstruktur visar institutioners och fonders nuvarande positioner i företaget, samt de senaste förändringarna i positionernas storlek. Större aktieägare kan vara enskilda investerare, fonder, hedgefonder eller institutioner. Bilaga 13D visar att investeraren äger (eller ägde) mer än 5% av företaget och avser (eller avsåg) att aktivt eftersträva en förändring av affärsstrategin. Schedule 13G indikerar en passiv investering på över 5%.
The share price as of September 9, 2025 is 25,30 / share. Previously, on September 10, 2024, the share price was 20,80 / share. This represents an increase of 21,63% over that period.

Fondsentimentets poäng
Fondsentimentet poängen(fka Ägarackumulation-poäng) visar vilka aktier som är mest köpta av fonder. Det är resultatet av en sofistikerad kvantitativ flerfaktormodell som identifierar företag med de högsta nivåerna av institutionell ackumulering. Poängsättningsmodellen använder en kombination av den totala ökningen av redovisade ägare, förändringarna i portföljallokeringarna för dessa ägare och andra mått. Siffran sträcker sig från 0 till 100, där högre siffror indikerar en högre nivå av ackumulering i förhållande till sina konkurrenter, och 50 är genomsnittet.
Uppdateringsfrekvens: Dagligen
Se Ownership Explorer, som innehåller en lista över de högst rankade företagen.
Institutionell sälj/köp-kvot
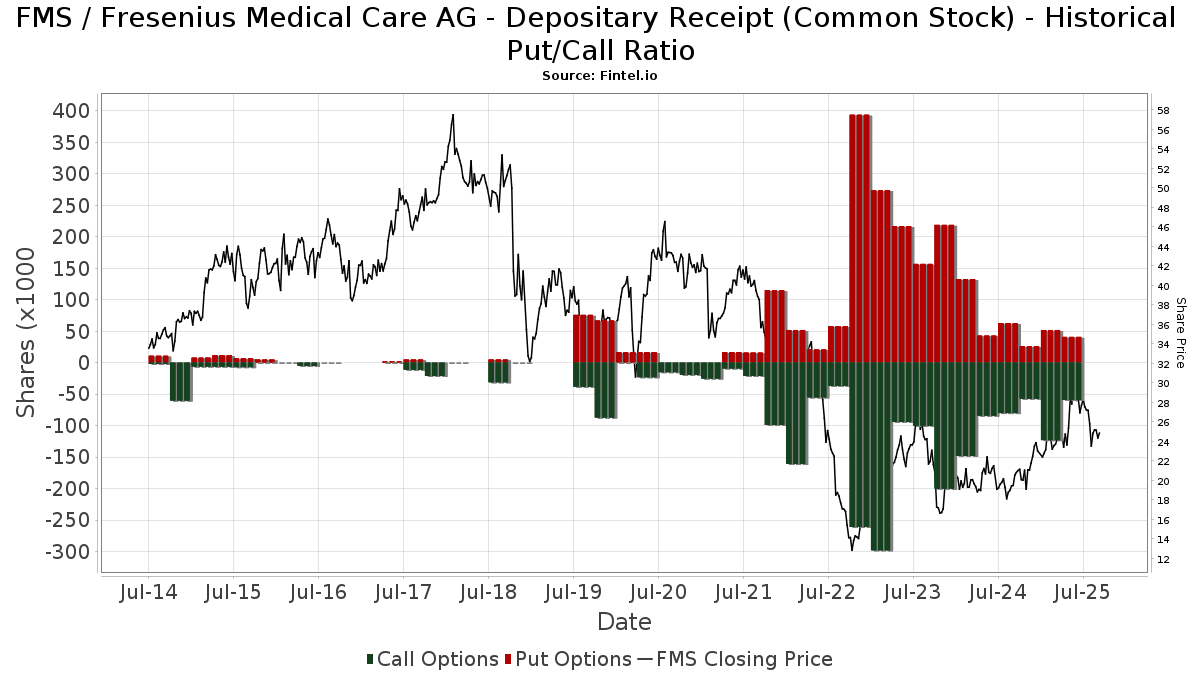
Förutom att rapportera vanliga eget kapital- och skuldemissioner måste institutioner med mer än 100MM tillgångar under förvaltning också avslöja sina innehav av sälj- och köpoptioner. Eftersom säljoptioner i allmänhet indikerar ett negativt sentiment och köpoptioner indikerar ett positivt sentiment, kan vi få en uppfattning om det övergripande institutionella sentimentet genom att plotta förhållandet mellan säljoptioner och köpoptioner. Diagrammet till höger visar det historiska förhållandet mellan sälj- och köpoptioner för detta instrument.
Genom att använda sälj/köp-kvoten som en indikator på aktieägarnas sentiment undviker man en av de största bristerna med att använda det totala institutionella ägandet, nämligen att en betydande del av de förvaltade tillgångarna investeras passivt för att följa index. Passivt förvaltade fonder köper vanligtvis inte optioner, så indikatorn för sälj/köp-kvoten ger en bättre bild av stämningen i aktivt förvaltade fonder.
13D/G-Arkiveringar
Vi presenterar 13D/G-arkiveringar separat från 13F-arkiveringar på grund av att de behandlas olika av SEC. 13D/G-arkiveringar kan lämnas in av grupper av investerare (med en ledare), medan 13F-arkiveringar inte kan det. Detta leder till situationer där en investerare kan lämna in en 13D/G-ansökan med ett värde för de totala aktierna (vilket motsvarar alla aktier som ägs av investerargruppen), men sedan lämna in en 13F-ansökan med ett annat värde för de totala aktierna (vilket motsvarar enbart deras eget ägande). Detta innebär att aktieägandet i 13D/G-arkiveringar och 13F-arkiveringar ofta inte är direkt jämförbara, så vi presenterar dem separat.
Notera: Från och med den 16 maj 2021 visar vi inte längre ägare som inte har lämnat in en 13D/G under det senaste året. Tidigare visade vi hela historiken för 13D/G-arkiveringar. I allmänhet måste enheter som är skyldiga att lämna in 13D/G-arkiveringar lämna in minst en gång per år innan de lämnar in en stängningsarkivering. Fonder avslutar dock ibland positioner utan att lämna in en avslutande arkivering (dvs. de avvecklar), så att visa hela historiken resulterade ibland i förvirring om det nuvarande ägandet. För att förhindra förvirring visar vi nu endast "nuvarande" ägare - det vill säga ägare som har lämnat in en ansökan under det senaste året.
Upgrade to unlock premium data.
| Fil Datum | Formulär | Investerare | Föregående aktier |
Senaste aktier |
Δ Aktier (Procent) |
Ägande (Procent) |
Δ Ägande (Procent) |
|
|---|---|---|---|---|---|---|---|---|
| 2025-03-10 | Fresenius SE & Co. KGaA | 94,380,382 | 83,780,382 | -11.23 | 28.60 | -11.18 | ||
| 2025-02-14 | HARRIS ASSOCIATES L P | 15,173,585 | 11,717,575 | -22.78 | 3.90 | -24.56 |
13F- och NPORT-arkiveringar
Detaljer om 13F-arkiveringar är gratis. Detaljer om NP-arkiveringar kräver ett premiummedlemskap. Gröna rader indikerar nya positioner. Röda rader indikerar stängda positioner. Klicka på länk symbolen för att se hela transaktionshistoriken.
Uppgradera
för att låsa upp premiumdata och exportera till Excel ![]() .
.
| Fil Datum | Källa | Investerare | Typ | Genomsnittligt pris (beräknat) |
Aktier | Δ Aktier (%) |
Rapporterat värde (1000 USD) |
Δ Värde (%) |
Portföljallokering (%) |
|
|---|---|---|---|---|---|---|---|---|---|---|
| 2025-07-24 | 13F | Us Bancorp \de\ | 75 660 | 225,53 | 2 162 | 273,88 | ||||
| 2025-06-26 | NP | Elevation Series Trust - The Opal International Dividend Income ETF | 0 | −100,00 | 0 | −100,00 | ||||
| 2025-08-11 | 13F | Hexagon Capital Partners LLC | 0 | −100,00 | 0 | |||||
| 2025-07-24 | 13F | IFP Advisors, Inc | 464 | 0,00 | 13 | 18,18 | ||||
| 2025-07-30 | 13F | Loring Wolcott & Coolidge Fiduciary Advisors Llp/ma | 926 | 0,00 | 26 | 23,81 | ||||
| 2025-08-11 | 13F | HighTower Advisors, LLC | 16 640 | −4,14 | 475 | 9,95 | ||||
| 2025-08-05 | 13F | NewSquare Capital LLC | 151 | 788,24 | 4 | |||||
| 2025-08-14 | 13F | Mml Investors Services, Llc | 22 911 | 26,92 | 1 | |||||
| 2025-05-15 | 13F | Virtus Investment Advisers, Inc. | 0 | −100,00 | 0 | |||||
| 2025-07-16 | 13F | Signaturefd, Llc | 7 423 | 3,25 | 212 | 18,44 | ||||
| 2025-08-05 | 13F | Huntington National Bank | 2 355 | 219,54 | 67 | 272,22 | ||||
| 2025-08-14 | 13F | Engineers Gate Manager LP | 25 874 | 739 | ||||||
| 2025-08-07 | 13F | Zions Bancorporation, National Association /ut/ | 17 | 0,00 | 0 | |||||
| 2025-08-13 | 13F | Northern Trust Corp | 422 727 | 11,17 | 12 077 | 27,56 | ||||
| 2025-04-28 | 13F | DAVENPORT & Co LLC | 0 | −100,00 | 0 | |||||
| 2025-07-09 | 13F | Veracity Capital LLC | 14 684 | −59,31 | 420 | −53,34 | ||||
| 2025-08-12 | 13F | Clearbridge Investments, LLC | 9 624 | −1,06 | 275 | 13,22 | ||||
| 2025-07-15 | 13F | Signet Financial Management, Llc | 30 261 | 3,39 | 865 | 18,68 | ||||
| 2025-08-08 | 13F | SG Americas Securities, LLC | 10 150 | −0,02 | 0 | |||||
| 2025-08-12 | 13F | MAI Capital Management | 152 | 4 | ||||||
| 2025-07-11 | 13F | Farther Finance Advisors, LLC | 768 | 0,39 | 22 | 16,67 | ||||
| 2025-08-13 | 13F | New York State Common Retirement Fund | 6 573 | 0,00 | 0 | |||||
| 2025-08-14 | 13F | UBS Group AG | 79 151 | 13,73 | 2 261 | 30,54 | ||||
| 2025-08-14 | 13F | Raymond James Financial Inc | 277 995 | −3,39 | 7 942 | 10,86 | ||||
| 2025-07-08 | 13F | Parallel Advisors, LLC | 3 838 | 2,13 | 110 | 17,20 | ||||
| 2025-04-22 | 13F | Mendota Financial Group, LLC | 0 | −100,00 | 0 | |||||
| 2025-08-13 | 13F | Todd Asset Management Llc | 1 239 113 | 156,92 | 35 402 | 194,79 | ||||
| 2025-08-14 | 13F | Bank Of America Corp /de/ | 337 316 | 279,69 | 9 637 | 335,67 | ||||
| 2025-05-14 | 13F | Colonial Trust Advisors | 0 | −100,00 | 0 | −100,00 | ||||
| 2025-08-12 | 13F | Atlas Capital Advisors Llc | 22 604 | 1,60 | 646 | 16,43 | ||||
| 2025-07-30 | 13F | Forum Financial Management, LP | 8 946 | −17,86 | 256 | −5,90 | ||||
| 2025-07-30 | 13F | Arbor Investment Advisors, LLC | 8 850 | 0,00 | 253 | 14,55 | ||||
| 2025-08-14 | 13F | Susquehanna International Group, Llp | Put | 22 700 | 47,40 | 649 | 69,19 | |||
| 2025-08-04 | 13F | Assetmark, Inc | 31 148 | 248,65 | 890 | 300,45 | ||||
| 2025-08-14 | 13F | Susquehanna International Group, Llp | Call | 56 000 | 400,00 | 1 600 | 475,18 | |||
| 2025-07-29 | NP | NIAGX - Nia Impact Solutions Fund | 44 380 | 1 260 | ||||||
| 2025-07-22 | 13F | Valley National Advisers Inc | 3 066 | −6,38 | 0 | |||||
| 2025-08-14 | 13F | Wetherby Asset Management Inc | 9 134 | −8,03 | 261 | 16,07 | ||||
| 2025-07-14 | 13F | UMA Financial Services, Inc. | 194 | −16,38 | 6 | 0,00 | ||||
| 2025-08-12 | 13F | American Century Companies Inc | 29 173 | 21,32 | 833 | 39,30 | ||||
| 2025-08-14 | 13F | Two Sigma Investments, Lp | 20 642 | −16,81 | 590 | −4,54 | ||||
| 2025-07-16 | 13F | Arlington Capital Management, Inc. | 89 930 | 2 569 | ||||||
| 2025-07-28 | NP | AVSD - Avantis Responsible International Equity ETF | 2 751 | 0,00 | 78 | 18,18 | ||||
| 2025-04-29 | 13F | Callan Capital, LLC | 13 974 | 6,64 | 348 | 17,23 | ||||
| 2025-07-17 | 13F | Uncommon Cents Investing LLC | 40 065 | −1,46 | 1 145 | 13,04 | ||||
| 2025-06-30 | NP | VASVX - Vanguard Selected Value Fund Investor Shares | 2 975 541 | −9,44 | 75 519 | −7,59 | ||||
| 2025-08-11 | 13F | GW&K Investment Management, LLC | 70 | 0,00 | 0 | |||||
| 2025-05-06 | 13F | Venturi Wealth Management, LLC | 0 | −100,00 | 0 | |||||
| 2025-07-29 | NP | SGLIX - SGI Global Equity Fund Class I Shares | 29 748 | 845 | ||||||
| 2025-08-12 | 13F | Charles Schwab Investment Management Inc | 41 618 | 16,59 | 1 189 | 33,90 | ||||
| 2025-06-26 | NP | DFIEX - International Core Equity Portfolio - Institutional Class This fund is a listed as child fund of Dimensional Fund Advisors Lp and if that institution has disclosed ownership in this security, then these positions will not be double counted when calculating total shares and total value | 1 074 | 0,00 | 27 | 3,85 | ||||
| 2025-08-11 | 13F | Cornerstone Planning Group LLC | 82 | 17,14 | 2 | 100,00 | ||||
| 2025-08-12 | 13F | Summit Global Investments | 7 675 | −86,76 | 0 | −100,00 | ||||
| 2025-08-11 | 13F | TD Waterhouse Canada Inc. | 1 256 | 36 | ||||||
| 2025-07-29 | NP | GINX - SGI Enhanced Global Income ETF | 17 644 | 501 | ||||||
| 2025-08-14 | 13F | Wells Fargo & Company/mn | 54 555 | −16,93 | 1 559 | −4,71 | ||||
| 2025-08-13 | 13F/A | StoneX Group Inc. | 0 | −100,00 | 0 | −100,00 | ||||
| 2025-08-13 | 13F | Russell Investments Group, Ltd. | 5 096 | 21,33 | 146 | 39,42 | ||||
| 2025-07-31 | 13F | Hartford Financial Management Inc. | 1 837 | −10,83 | 52 | 1,96 | ||||
| 2025-08-06 | 13F | First Horizon Advisors, Inc. | 176 | 417,65 | 5 | |||||
| 2025-08-13 | 13F | First Trust Advisors Lp | 18 873 | 0,40 | 539 | 15,17 | ||||
| 2025-08-13 | 13F | Quadrant Capital Group Llc | 17 952 | −0,99 | 513 | 13,53 | ||||
| 2025-07-25 | 13F | Yousif Capital Management, Llc | 9 804 | 6,81 | 280 | 22,81 | ||||
| 2025-05-14 | 13F/A | Group One Trading, L.p. | Call | 0 | −100,00 | 0 | ||||
| 2025-07-25 | 13F | Lodestar Private Asset Management Llc | 13 932 | 0,00 | 398 | 15,03 | ||||
| 2025-07-16 | 13F | Brown, Lisle/cummings, Inc. | 419 | 0,00 | 12 | 10,00 | ||||
| 2025-07-23 | 13F | BankPlus Trust Department | 154 | 0,00 | 4 | 33,33 | ||||
| 2025-08-12 | 13F | Kimelman & Baird, LLC | 9 734 | 0,00 | 278 | 14,88 | ||||
| 2025-08-14 | 13F | Ameriprise Financial Inc | 67 703 | 10,54 | 1 934 | 27,24 | ||||
| 2025-08-05 | 13F | Simplex Trading, Llc | Put | 3 900 | 50,00 | 0 | ||||
| 2025-08-05 | 13F | Simplex Trading, Llc | Call | 3 400 | −88,36 | 0 | ||||
| 2025-07-21 | 13F | Credential Qtrade Securities Inc. | 0 | −100,00 | 0 | −100,00 | ||||
| 2025-08-12 | 13F | Wayfinding Financial, LLC | 0 | −100,00 | 0 | |||||
| 2025-04-22 | 13F | Castleview Partners, Llc | 0 | −100,00 | 0 | |||||
| 2025-08-26 | NP | AZBAX - AllianzGI Small-Cap Fund Class A | 11 033 | 0,00 | 315 | 14,96 | ||||
| 2025-08-13 | 13F | Cresset Asset Management, LLC | 11 706 | −24,15 | 334 | −13,02 | ||||
| 2025-08-14 | 13F | Harris Associates L P | 9 750 | −8,84 | 279 | 4,51 | ||||
| 2025-08-14 | 13F | Quantinno Capital Management LP | 182 222 | 2,87 | 5 206 | 18,05 | ||||
| 2025-08-14 | 13F | Fiduciary Management Inc /wi/ | 5 656 372 | −4,94 | 161 603 | 9,08 | ||||
| 2025-07-08 | 13F | Atwood & Palmer Inc | 100 | 0,00 | 3 | 0,00 | ||||
| 2025-08-08 | 13F | Crossmark Global Holdings, Inc. | 64 829 | −0,06 | 1 852 | 14,67 | ||||
| 2025-05-15 | 13F | Glenmede Trust Co Na | 20 864 | 5,30 | 520 | 15,85 | ||||
| 2025-07-11 | 13F | Pinnacle Bancorp, Inc. | 418 | 12 | ||||||
| 2025-07-16 | 13F | Meyer Handelman Co | 16 000 | 0,00 | 457 | 14,82 | ||||
| 2025-08-14 | 13F | Goldman Sachs Group Inc | 796 804 | 9,29 | 22 765 | 25,39 | ||||
| 2025-07-25 | 13F | Pzena Investment Management Llc | 14 662 982 | −4,64 | 418 921 | 9,41 | ||||
| 2025-07-07 | 13F | Northwest & Ethical Investments L.P. | 0 | −100,00 | 0 | −100,00 | ||||
| 2025-07-15 | 13F | Fifth Third Bancorp | 19 654 | 156,58 | 562 | 195,26 | ||||
| 2025-08-12 | 13F | Advisors Asset Management, Inc. | 18 528 | 137,02 | 529 | 172,68 | ||||
| 2025-08-13 | 13F | Natixis Advisors, L.p. | 72 124 | 462,33 | 2 | |||||
| 2025-08-14 | 13F | Syon Capital Llc | 12 360 | −9,44 | 353 | 4,13 | ||||
| 2025-07-24 | 13F | JNBA Financial Advisors | 301 | 0,00 | 9 | 14,29 | ||||
| 2025-08-08 | 13F | Creative Planning | 53 073 | 6,08 | 1 516 | 21,77 | ||||
| 2025-07-01 | 13F | Cacti Asset Management Llc | 6 000 | 0,00 | 169 | 14,19 | ||||
| 2025-07-29 | 13F | Mb, Levis & Associates, Llc | 478 | 0,00 | 14 | 18,18 | ||||
| 2025-07-17 | 13F | Halbert Hargrove Global Advisors, Llc | 0 | −100,00 | 0 | |||||
| 2025-08-12 | 13F | Proequities, Inc. | Put | 0 | 0 | |||||
| 2025-08-12 | 13F | Proequities, Inc. | Call | 0 | 0 | |||||
| 2025-08-12 | 13F | Proequities, Inc. | 0 | 0 | ||||||
| 2025-08-12 | 13F | Global Retirement Partners, LLC | 3 293 | 94 | ||||||
| 2025-08-01 | 13F | Koss-Olinger Consulting, LLC | 14 509 | −3,27 | 415 | 10,70 | ||||
| 2025-08-04 | 13F | Spire Wealth Management | 0 | −100,00 | 0 | |||||
| 2025-08-13 | 13F | Townsquare Capital Llc | 0 | −100,00 | 0 | |||||
| 2025-06-09 | NP | Bmc Fund Inc | 8 420 | −49,88 | 214 | −48,92 | ||||
| 2025-08-12 | 13F | Clear Street Markets Llc | 0 | −100,00 | 0 | |||||
| 2025-08-11 | 13F | Citigroup Inc | 93 747 | 7 824,51 | 2 678 | 9 134,48 | ||||
| 2025-08-12 | 13F | Dimensional Fund Advisors Lp | 23 861 | 1,18 | 682 | 16,01 | ||||
| 2025-08-13 | 13F | Twin Peaks Wealth Advisors, LLC | 148 | 4 | ||||||
| 2025-06-30 | NP | VWNDX - Vanguard Windsor Fund Investor Shares | 8 204 589 | 0,00 | 208 232 | 2,05 | ||||
| 2025-08-14 | 13F | Two Sigma Advisers, Lp | 20 600 | −49,01 | 589 | −41,49 | ||||
| 2025-08-06 | 13F | True Wealth Design, LLC | 35 | 0,00 | 1 | |||||
| 2025-08-13 | 13F | Northwestern Mutual Wealth Management Co | 1 661 | −21,61 | 47 | −9,62 | ||||
| 2025-07-07 | 13F | Investors Research Corp | 21 | 0,00 | 1 | |||||
| 2025-08-12 | 13F | O'shaughnessy Asset Management, Llc | 35 524 | 10,12 | 1 015 | 26,28 | ||||
| 2025-06-26 | NP | PZFVX - Classic Value Fund Class A | 1 016 962 | −12,57 | 25 810 | −10,78 | ||||
| 2025-08-13 | 13F | Bare Financial Services, Inc | 34 | 0,00 | 1 | |||||
| 2025-08-12 | 13F | BlackRock, Inc. | 445 366 | 6,39 | 12 724 | 22,08 | ||||
| 2025-08-14 | 13F | CoreCap Advisors, LLC | 0 | −100,00 | 0 | |||||
| 2025-08-19 | 13F | Cape Investment Advisory, Inc. | 328 | 37,82 | 9 | 80,00 | ||||
| 2025-08-14 | 13F | Millennium Management Llc | 308 390 | −71,54 | 8 811 | −67,35 | ||||
| 2025-08-12 | 13F | Franklin Resources Inc | 75 034 | 3,82 | 2 144 | 19,12 | ||||
| 2025-08-14 | 13F | Mariner, LLC | 48 010 | 2,27 | 1 372 | 17,38 | ||||
| 2025-07-09 | 13F | Bruce G. Allen Investments, LLC | 1 583 | 2,06 | 45 | 18,42 | ||||
| 2025-08-14 | 13F | Old Mission Capital Llc | 0 | −100,00 | 0 | |||||
| 2025-08-11 | 13F | One Capital Management, LLC | 10 482 | 0,00 | 299 | 14,56 | ||||
| 2025-08-25 | 13F/A | Neuberger Berman Group LLC | 9 809 | 2,76 | 280 | 18,14 | ||||
| 2025-04-09 | 13F | Legacy Wealth Asset Management, LLC | 0 | −100,00 | 0 | |||||
| 2025-07-16 | 13F | ORG Wealth Partners, LLC | 1 676 | −56,02 | 48 | −48,94 | ||||
| 2025-07-24 | 13F | Callan Family Office, LLC | 29 877 | 50,15 | 854 | 72,32 | ||||
| 2025-08-07 | 13F | Kestra Private Wealth Services, Llc | 11 685 | 1,74 | 334 | 16,84 | ||||
| 2025-08-08 | 13F | Pnc Financial Services Group, Inc. | 10 161 | 11,75 | 290 | 28,32 | ||||
| 2025-06-26 | NP | CVAR - Cultivar ETF | 16 505 | 0,73 | 419 | 2,70 | ||||
| 2025-08-14 | 13F | Nia Impact Advisors, Llc | 122 198 | −0,10 | 3 491 | 14,65 | ||||
| 2025-07-29 | 13F | Salomon & Ludwin, LLC | 5 | 0 | ||||||
| 2025-08-12 | 13F | Rhumbline Advisers | 16 233 | −0,73 | 464 | 13,76 | ||||
| 2025-08-08 | 13F | SBI Securities Co., Ltd. | 317 | 4 428,57 | 9 | |||||
| 2025-08-13 | 13F | Trustmark National Bank Trust Department | 35 963 | 1 027 | ||||||
| 2025-08-06 | 13F | Paradigm Asset Management Co Llc | 1 800 | 0,00 | 51 | 15,91 | ||||
| 2025-08-11 | 13F | Principal Securities, Inc. | 2 267 | 105,34 | 65 | 166,67 | ||||
| 2025-07-25 | 13F | PrairieView Partners, LLC | 418 | 0,00 | 0 | |||||
| 2025-08-12 | 13F | Manchester Capital Management LLC | 18 | 1 | ||||||
| 2025-08-06 | 13F | SOUTH STATE Corp | 31 | 1 | ||||||
| 2025-08-14 | 13F | GWM Advisors LLC | 206 | 1,98 | 6 | 0,00 | ||||
| 2025-07-28 | 13F | Moran Wealth Management, LLC | 149 551 | 1,38 | 4 273 | 16,31 | ||||
| 2025-08-14 | 13F | Citadel Advisors Llc | Call | 0 | −100,00 | 0 | ||||
| 2025-07-11 | 13F/A | Umb Bank N A/mo | 150 | 0,00 | 4 | 33,33 | ||||
| 2025-06-26 | NP | HFCGX - Hennessy Cornerstone Growth Fund Investor Class | 300 400 | 7 624 | ||||||
| 2025-08-04 | 13F | Hantz Financial Services, Inc. | 2 079 | 568,49 | 0 | |||||
| 2025-08-15 | 13F | Tower Research Capital LLC (TRC) | 62 815 | 616,49 | 1 795 | 722,94 | ||||
| 2025-08-07 | 13F | Sierra Ocean, Llc | 312 | 2,30 | 9 | 14,29 | ||||
| 2025-08-14 | 13F | Lazard Asset Management Llc | 0 | −100,00 | 0 | |||||
| 2025-08-14 | 13F | Glen Eagle Advisors, LLC | 109 | 1,87 | 3 | 50,00 | ||||
| 2025-08-06 | 13F | Commonwealth Equity Services, Llc | 12 364 | −7,46 | 0 | |||||
| 2025-08-27 | NP | Liberty All Star Equity Fund | 1 139 792 | −0,74 | 32 564 | 13,89 | ||||
| 2025-08-08 | 13F | Everett Harris & Co /ca/ | 13 259 | 0,00 | 379 | 14,55 | ||||
| 2025-07-25 | 13F | Stephens Consulting, LLC | 31 | 1 | ||||||
| 2025-07-30 | 13F | Bogart Wealth, LLC | 1 | 0,00 | 0 | |||||
| 2025-08-14 | 13F | Barometer Capital Management Inc. | 18 300 | 523 | ||||||
| 2025-08-12 | 13F | Nuveen, LLC | 38 564 | −31,12 | 1 102 | −21,02 | ||||
| 2025-08-14 | 13F | Toroso Investments, LLC | 11 078 | −32,94 | 316 | −23,11 | ||||
| 2025-08-14 | 13F | Evergreen Capital Management Llc | 8 151 | −4,73 | 233 | 8,92 | ||||
| 2025-09-04 | 13F/A | Advisor Group Holdings, Inc. | 14 351 | 635,95 | 410 | 752,08 | ||||
| 2025-08-14 | 13F | Fmr Llc | 143 412 | 1,94 | 4 097 | 16,96 | ||||
| 2025-07-28 | NP | AVDEX - Avantis International Equity Fund Institutional Class This fund is a listed as child fund of American Century Companies Inc and if that institution has disclosed ownership in this security, then these positions will not be double counted when calculating total shares and total value | 1 743 | 0,00 | 50 | 16,67 | ||||
| 2025-08-11 | 13F | Dorsey & Whitney Trust CO LLC | 7 789 | 223 | ||||||
| 2025-08-14 | 13F | Broyhill Asset Management | 60 952 | −58,69 | 1 741 | −52,60 | ||||
| 2025-08-14 | 13F | Jane Street Group, Llc | 18 362 | 525 | ||||||
| 2025-08-14 | 13F | Point72 Asset Management, L.P. | 0 | −100,00 | 0 | |||||
| 2025-07-21 | 13F | Franklin Street Advisors Inc /nc | 8 896 | 0,00 | 0 | |||||
| 2025-08-12 | 13F | Wulff, Hansen & Co. | 0 | −100,00 | 0 | |||||
| 2025-08-13 | 13F | Jones Financial Companies Lllp | 9 958 | 3,00 | 281 | 17,15 | ||||
| 2025-08-14 | 13F | Summit Trail Advisors, Llc | 12 468 | 356 | ||||||
| 2025-08-14 | 13F | Sei Investments Co | 12 592 | 26,91 | 360 | 45,34 | ||||
| 2025-08-14 | 13F | Mercer Global Advisors Inc /adv | 21 156 | 47,93 | 604 | 69,66 | ||||
| 2025-08-06 | 13F | Fox Run Management, L.l.c. | 0 | −100,00 | 0 | |||||
| 2025-08-08 | 13F | Larson Financial Group LLC | 31 | 0,00 | 1 | |||||
| 2025-08-13 | 13F | Marshall Wace, Llp | 10 074 | −50,57 | 288 | −43,39 | ||||
| 2025-08-12 | 13F | AlphaCore Capital LLC | 2 544 | 73 | ||||||
| 2025-08-13 | 13F | Cerity Partners LLC | 41 126 | 3,06 | 1 175 | 18,23 | ||||
| 2025-08-07 | 13F | Midwest Trust Co | 9 861 | 282 | ||||||
| 2025-04-28 | 13F | Fedenia Advisers LLC | 0 | −100,00 | 0 | |||||
| 2025-08-12 | 13F | Coldstream Capital Management Inc | 0 | −100,00 | 0 | |||||
| 2025-07-31 | 13F | Glass Jacobson Investment Advisors llc | 0 | −100,00 | 0 | |||||
| 2025-07-21 | 13F | Hennessy Advisors Inc | 401 800 | 11 479 | ||||||
| 2025-08-14 | 13F | Glenmede Investment Management, LP | 20 811 | 595 | ||||||
| 2025-07-29 | 13F | Commons Capital, Llc | 8 895 | 0,00 | 254 | 14,93 | ||||
| 2025-08-14 | 13F | Vident Advisory, LLC | 34 355 | −36,70 | 982 | −27,39 | ||||
| 2025-07-28 | NP | AVDE - Avantis International Equity ETF This fund is a listed as child fund of American Century Companies Inc and if that institution has disclosed ownership in this security, then these positions will not be double counted when calculating total shares and total value | 24 285 | 26,76 | 690 | 48,81 | ||||
| 2025-07-15 | 13F | Td Private Client Wealth Llc | 4 925 | 6 380,26 | 141 | 13 900,00 | ||||
| 2025-08-11 | 13F | Rothschild Investment Llc | 640 | 4,75 | 18 | 20,00 | ||||
| 2025-08-01 | 13F | Envestnet Asset Management Inc | 373 961 | 26,76 | 10 684 | 45,46 | ||||
| 2025-08-14 | 13F | Bnp Paribas Arbitrage, Sa | 32 117 | 133 720,83 | 918 | |||||
| 2025-08-07 | 13F | Teachers Retirement System Of The State Of Kentucky | 753 500 | 152,85 | 22 | 200,00 | ||||
| 2025-06-26 | NP | FSGEX - Fidelity Series Global ex U.S. Index Fund This fund is a listed as child fund of Fmr Llc and if that institution has disclosed ownership in this security, then these positions will not be double counted when calculating total shares and total value | 73 378 | −19,14 | 1 862 | −17,46 | ||||
| 2025-07-15 | 13F | Mather Group, Llc. | 0 | −100,00 | 0 | |||||
| 2025-08-13 | 13F | Guggenheim Capital Llc | 22 651 | 30,44 | 647 | 49,77 | ||||
| 2025-07-30 | NP | APIE - ActivePassive International Equity ETF | 58 899 | 4,89 | 1 673 | 23,03 | ||||
| 2025-07-21 | 13F | Credential Securities Inc. | 10 456 | −6,94 | 526 | −8,20 | ||||
| 2025-08-14 | 13F | RBF Capital, LLC | 8 100 | 0,00 | 231 | 14,93 | ||||
| 2025-08-14 | 13F | Integral Health Asset Management, LLC | 750 000 | 10,29 | 21 428 | 26,55 | ||||
| 2025-08-07 | 13F | Parkside Financial Bank & Trust | 81 | 22,73 | 2 | 100,00 | ||||
| 2025-07-21 | 13F | Qrg Capital Management, Inc. | 81 574 | 14,42 | 2 331 | 31,27 | ||||
| 2025-07-30 | NP | ENDW - Cambria Endowment Style ETF | 8 | 0 | ||||||
| 2025-08-07 | 13F | Acadian Asset Management Llc | 1 746 | 0 | ||||||
| 2025-08-11 | 13F | Traub Capital Management LLC | 22 | 1 | ||||||
| 2025-07-31 | 13F | CVA Family Office, LLC | 67 | −34,95 | 2 | −50,00 | ||||
| 2025-07-29 | 13F | TrueMark Investments, LLC | 0 | −100,00 | 0 | |||||
| 2025-08-12 | 13F | Steward Partners Investment Advisory, Llc | 222 | −41,27 | 6 | −33,33 | ||||
| 2025-08-12 | 13F | CIBC Private Wealth Group, LLC | 277 | −76,41 | 8 | −73,08 | ||||
| 2025-07-14 | 13F | Park Avenue Securities Llc | 8 976 | 0 | ||||||
| 2025-07-30 | NP | PZVMX - Pzena Mid Cap Value Fund Investor Class | 147 696 | −14,65 | 4 195 | 0,12 | ||||
| 2025-08-11 | 13F | United Capital Financial Advisers, Llc | 8 308 | 237 | ||||||
| 2025-08-04 | 13F | Creative Financial Designs Inc /adv | 28 | −56,25 | 1 | −100,00 | ||||
| 2025-08-14 | 13F/A | Skopos Labs, Inc. | 4 072 | 216,89 | 116 | 274,19 | ||||
| 2025-08-07 | 13F | Searle & Co. | 23 288 | 0,00 | 665 | 14,85 | ||||
| 2025-08-12 | 13F | LPL Financial LLC | 33 780 | 965 | ||||||
| 2025-08-07 | 13F | Allworth Financial LP | 1 498 | 4,61 | 43 | 23,53 | ||||
| 2025-05-14 | 13F | CI Private Wealth, LLC | 0 | −100,00 | 0 | −100,00 | ||||
| 2025-07-22 | 13F | Highland Capital Management, Llc | 39 100 | −2,62 | 1 117 | 11,81 | ||||
| 2025-07-24 | 13F | Eastern Bank | 209 | 0,00 | 6 | 0,00 | ||||
| 2025-08-14 | 13F | Verition Fund Management LLC | 11 927 | 341 | ||||||
| 2025-08-15 | 13F | WealthCollab, LLC | 219 | 0,00 | 6 | 20,00 | ||||
| 2025-08-13 | 13F | Dodge & Cox | 3 826 910 | −8,30 | 109 335 | 5,21 | ||||
| 2025-08-14 | 13F | Citadel Advisors Llc | 62 533 | 1 042 116,67 | 1 787 | |||||
| 2025-08-14 | 13F | Citadel Advisors Llc | Put | 15 000 | −55,88 | 429 | −49,41 | |||
| 2025-05-12 | 13F | Sandy Spring Bank | 1 500 | 0,00 | 37 | 12,12 | ||||
| 2025-08-13 | 13F | Centiva Capital, LP | 0 | −100,00 | 0 | |||||
| 2025-08-13 | 13F | Arrowstreet Capital, Limited Partnership | 0 | −100,00 | 0 | |||||
| 2025-08-01 | 13F | Bessemer Group Inc | 18 | 0,00 | 0 | |||||
| 2025-08-11 | 13F | CBIZ Investment Advisory Services, LLC | 556 | 0,00 | 16 | 15,38 | ||||
| 2025-08-01 | 13F | Centerpoint Advisors, LLC | 944 | 0,00 | 0 | |||||
| 2025-07-16 | 13F | Highline Wealth Partners Llc | 85 | 0,00 | 2 | 0,00 | ||||
| 2025-08-14 | 13F | Principia Wealth Advisory, LLC | 6 | 0 | ||||||
| 2025-08-14 | 13F | Optiver Holding B.V. | 50 045 | −22,61 | 1 430 | −11,24 | ||||
| 2025-08-14 | 13F | Optiver Holding B.V. | Call | 100 | −99,12 | 3 | −99,29 | |||
| 2025-08-14 | 13F | Optiver Holding B.V. | Put | 100 | 3 | |||||
| 2025-07-24 | 13F | Jfs Wealth Advisors, Llc | 188 | 0,00 | 5 | 25,00 | ||||
| 2025-08-14 | 13F | Corient IA LLC | 25 000 | 0,00 | 714 | 14,79 | ||||
| 2025-05-12 | 13F | Simplex Trading, Llc | 0 | −100,00 | 0 | |||||
| 2025-07-29 | 13F | Private Trust Co Na | 328 | 290,48 | 9 | 350,00 | ||||
| 2025-08-01 | 13F | Riverwater Partners LLC | 15 306 | 0,00 | 437 | 14,70 | ||||
| 2025-08-15 | NP | FMIHX - Large Cap Fund Investor Class | 1 475 000 | −3,28 | 42 141 | 10,98 | ||||
| 2025-08-05 | 13F | Bank of New York Mellon Corp | 21 567 | −2,28 | 616 | 12,20 | ||||
| 2025-07-28 | 13F | Ritholtz Wealth Management | 18 941 | 1,27 | 541 | 16,34 | ||||
| 2025-08-13 | 13F | Barclays Plc | 0 | −100,00 | 0 | |||||
| 2025-08-14 | 13F | Aqr Capital Management Llc | 27 024 | 89,02 | 772 | 116,85 | ||||
| 2025-05-05 | 13F | Lindbrook Capital, Llc | 1 114 | −2,45 | 28 | 8,00 | ||||
| 2025-08-12 | 13F | Jpmorgan Chase & Co | 37 610 | 160,33 | 1 075 | 199,16 | ||||
| 2025-05-15 | 13F | Mork Capital Management, LLC | 0 | −100,00 | 0 | |||||
| 2025-07-28 | 13F | BRYN MAWR TRUST Co | 2 097 | 0,00 | 60 | 13,46 | ||||
| 2025-08-11 | 13F | Bell Investment Advisors, Inc | 30 | 0,00 | 1 | |||||
| 2025-08-05 | 13F | GHP Investment Advisors, Inc. | 2 140 | 0,00 | 61 | 15,09 | ||||
| 2025-08-14 | 13F | Qube Research & Technologies Ltd | 199 563 | 175,30 | 5 702 | 215,84 | ||||
| 2025-07-14 | 13F | GAMMA Investing LLC | 9 852 | 2,59 | 281 | 17,57 | ||||
| 2025-07-22 | 13F | Autumn Glory Partners, LLC | 11 198 | 21,74 | 591 | 157,64 | ||||
| 2025-08-11 | 13F | Annis Gardner Whiting Capital Advisors, LLC | 64 | 2 | ||||||
| 2025-08-14 | 13F | Susquehanna International Group, Llp | 0 | −100,00 | 0 | |||||
| 2025-07-30 | 13F | Ethic Inc. | 52 497 | 2,77 | 1 481 | 17,18 | ||||
| 2025-06-26 | NP | SNTKX - Steward International Enhanced Index Fund Class A | 36 535 | 0,00 | 927 | 2,09 | ||||
| 2025-08-06 | 13F | Atlantic Union Bankshares Corp | 1 500 | 43 | ||||||
| 2025-07-14 | 13F | Abound Wealth Management | 6 | −14,29 | 0 | |||||
| 2025-05-15 | 13F | Squarepoint Ops LLC | 0 | −100,00 | 0 | |||||
| 2025-07-25 | 13F | Cwm, Llc | 1 184 | −9,96 | 0 | |||||
| 2025-08-15 | 13F | Morgan Stanley | 2 369 089 | 125,48 | 67 685 | 158,71 | ||||
| 2025-08-28 | NP | DODBX - Dodge & Cox Balanced Fund | 3 826 910 | −8,30 | 109 335 | 5,21 | ||||
| 2025-07-24 | 13F | Ronald Blue Trust, Inc. | 6 185 | 55,83 | 177 | 79,59 | ||||
| 2025-08-07 | 13F | Campbell & CO Investment Adviser LLC | 0 | −100,00 | 0 | |||||
| 2025-08-12 | 13F | Pathstone Holdings, LLC | 66 204 | −0,61 | 1 891 | 14,05 | ||||
| 2025-08-08 | 13F | Abc Arbitrage Sa | 229 375 | 18,20 | 6 553 | 35,62 | ||||
| 2025-08-18 | 13F/A | National Bank Of Canada /fi/ | 34 954 | 12,29 | 999 | 28,94 | ||||
| 2025-08-13 | 13F | EverSource Wealth Advisors, LLC | 2 906 | 141,76 | 83 | 186,21 | ||||
| 2025-07-18 | 13F | Truist Financial Corp | 7 501 | 214 | ||||||
| 2025-08-08 | 13F | Geode Capital Management, Llc | 57 905 | −21,09 | 1 654 | −9,47 | ||||
| 2025-07-21 | 13F | Cromwell Holdings LLC | 2 275 | 0,00 | 65 | 14,29 | ||||
| 2025-07-09 | 13F | VisionPoint Advisory Group, LLC | 52 578 | −54,72 | 1 502 | −48,05 | ||||
| 2025-08-12 | 13F | XTX Topco Ltd | 20 563 | 587 | ||||||
| 2025-07-07 | 13F | Versant Capital Management, Inc | 8 951 | 34,64 | 256 | 54,55 | ||||
| 2025-07-25 | 13F | JustInvest LLC | 38 942 | 14,07 | 1 113 | 30,82 | ||||
| 2025-08-14 | 13F | Smartleaf Asset Management LLC | 1 074 | −9,67 | 30 | 3,45 | ||||
| 2025-08-18 | 13F | Geneos Wealth Management Inc. | 345 | −7,01 | 10 | 0,00 | ||||
| 2025-08-14 | 13F | Royal Bank Of Canada | 55 671 | 94,25 | 1 590 | 122,69 |
Other Listings
| DE:FMEA | 21,00 € |