Grundläggande statistik
| Institutionella ägare | 230 total, 230 long only, 0 short only, 0 long/short - change of −0,43% MRQ |
| Genomsnittlig portföljallokering | 0.2293 % - change of 20,55% MRQ |
| Institutionella aktier (lång) | 9 724 619 (ex 13D/G) - change of −0,33MM shares −3,25% MRQ |
| Institutionellt värde (lång) | $ 864 708 USD ($1000) |
Institutionellt ägande och aktieägare
Fidelity Covington Trust - Fidelity MSCI Consumer Discretionary Index ETF (US:FDIS) har 230 Institutionella ägare och aktieägare som har lämnat in 13D/G- eller 13F-formulär till Securities Exchange Commission (SEC). Dessa institut innehar totalt 9,724,619 aktier. Största aktieägare inkluderar Lido Advisors, LLC, Charles Schwab Investment Management Inc, Northern Lights Fund Trust - PFG Fidelity Institutional AM® Equity Sector Strategy Fund Class R Shares, Bank Of America Corp /de/, AE Wealth Management LLC, PFG Advisors, Richard Bernstein Advisors LLC, Agf Management Ltd, Morgan Stanley, and Envestnet Asset Management Inc .
Fidelity Covington Trust - Fidelity MSCI Consumer Discretionary Index ETF (ARCA:FDIS) Institutionell ägarstruktur visar institutioners och fonders nuvarande positioner i företaget, samt de senaste förändringarna i positionernas storlek. Större aktieägare kan vara enskilda investerare, fonder, hedgefonder eller institutioner. Bilaga 13D visar att investeraren äger (eller ägde) mer än 5% av företaget och avser (eller avsåg) att aktivt eftersträva en förändring av affärsstrategin. Schedule 13G indikerar en passiv investering på över 5%.
The share price as of September 12, 2025 is 102,66 / share. Previously, on September 16, 2024, the share price was 85,15 / share. This represents an increase of 20,56% over that period.

Fondsentimentets poäng
Fondsentimentet poängen(fka Ägarackumulation-poäng) visar vilka aktier som är mest köpta av fonder. Det är resultatet av en sofistikerad kvantitativ flerfaktormodell som identifierar företag med de högsta nivåerna av institutionell ackumulering. Poängsättningsmodellen använder en kombination av den totala ökningen av redovisade ägare, förändringarna i portföljallokeringarna för dessa ägare och andra mått. Siffran sträcker sig från 0 till 100, där högre siffror indikerar en högre nivå av ackumulering i förhållande till sina konkurrenter, och 50 är genomsnittet.
Uppdateringsfrekvens: Dagligen
Se Ownership Explorer, som innehåller en lista över de högst rankade företagen.
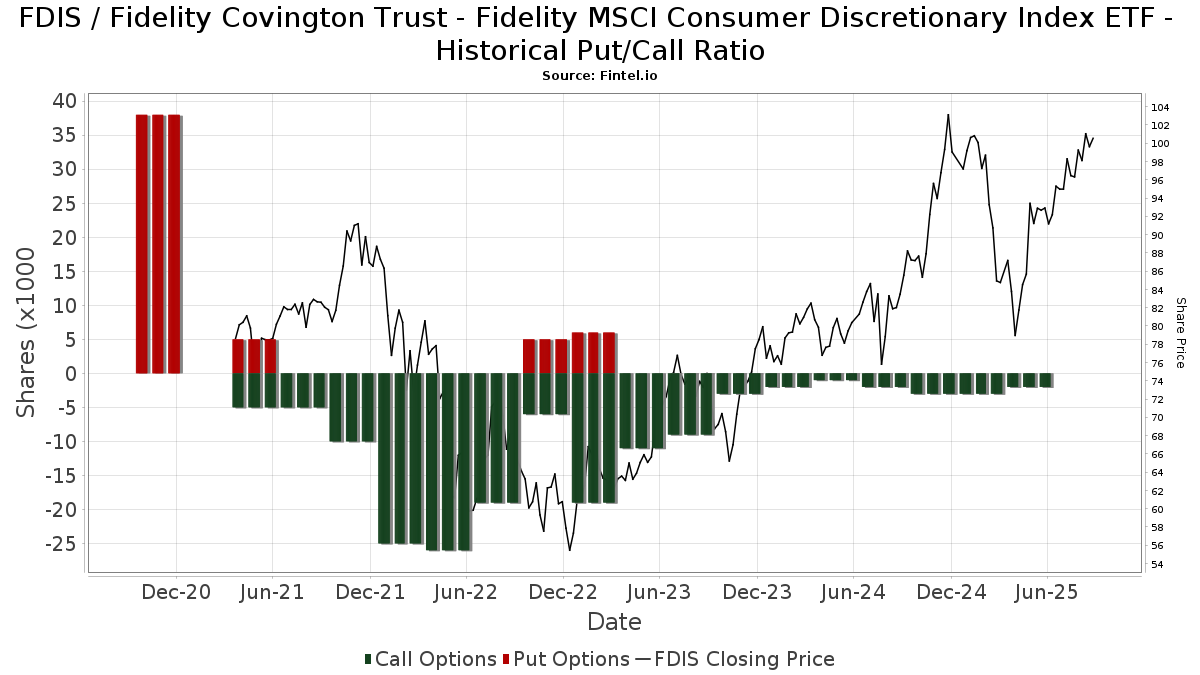
Institutionell sälj/köp-kvot
Förutom att rapportera vanliga eget kapital- och skuldemissioner måste institutioner med mer än 100MM tillgångar under förvaltning också avslöja sina innehav av sälj- och köpoptioner. Eftersom säljoptioner i allmänhet indikerar ett negativt sentiment och köpoptioner indikerar ett positivt sentiment, kan vi få en uppfattning om det övergripande institutionella sentimentet genom att plotta förhållandet mellan säljoptioner och köpoptioner. Diagrammet till höger visar det historiska förhållandet mellan sälj- och köpoptioner för detta instrument.
Genom att använda sälj/köp-kvoten som en indikator på aktieägarnas sentiment undviker man en av de största bristerna med att använda det totala institutionella ägandet, nämligen att en betydande del av de förvaltade tillgångarna investeras passivt för att följa index. Passivt förvaltade fonder köper vanligtvis inte optioner, så indikatorn för sälj/köp-kvoten ger en bättre bild av stämningen i aktivt förvaltade fonder.
13F- och NPORT-arkiveringar
Detaljer om 13F-arkiveringar är gratis. Detaljer om NP-arkiveringar kräver ett premiummedlemskap. Gröna rader indikerar nya positioner. Röda rader indikerar stängda positioner. Klicka på länk symbolen för att se hela transaktionshistoriken.
Uppgradera
för att låsa upp premiumdata och exportera till Excel ![]() .
.
| Fil Datum | Källa | Investerare | Typ | Genomsnittligt pris (beräknat) |
Aktier | Δ Aktier (%) |
Rapporterat värde (1000 USD) |
Δ Värde (%) |
Portföljallokering (%) |
|
|---|---|---|---|---|---|---|---|---|---|---|
| 2025-08-12 | 13F | Steward Partners Investment Advisory, Llc | 38 176 | 2 104,16 | 3 591 | 2 359,59 | ||||
| 2025-05-05 | 13F | Eagle Bay Advisors LLC | 0 | −100,00 | 0 | |||||
| 2025-08-12 | 13F | Jpmorgan Chase & Co | 1 072 | 136,12 | 101 | 163,16 | ||||
| 2025-08-29 | 13F | Centaurus Financial, Inc. | 5 249 | 1,04 | 0 | |||||
| 2025-07-15 | 13F | Financial Partners Group, Inc | 0 | −100,00 | 0 | |||||
| 2025-07-21 | 13F | Ameritas Advisory Services, LLC | 11 194 | −25,72 | 1 053 | −27,63 | ||||
| 2025-08-11 | 13F | Brass Tax Wealth Management, Inc | 0 | −100,00 | 0 | |||||
| 2025-08-14 | 13F | Snowden Capital Advisors LLC | 9 972 | −0,75 | 938 | 10,48 | ||||
| 2025-08-08 | 13F | Capital Investment Advisory Services, LLC | 1 625 | 0,00 | 153 | 10,95 | ||||
| 2025-05-14 | 13F | Boston Private Wealth Llc | 0 | −100,00 | 0 | |||||
| 2025-07-17 | 13F | Janney Montgomery Scott LLC | 28 042 | −3,52 | 3 | 0,00 | ||||
| 2025-07-07 | 13F | Investors Research Corp | 11 902 | 12,61 | 1 120 | 25,31 | ||||
| 2025-08-04 | 13F | Creative Financial Designs Inc /adv | 6 836 | −10,89 | 643 | −0,77 | ||||
| 2025-08-04 | 13F | Spire Wealth Management | 8 391 | −3,73 | 789 | 7,20 | ||||
| 2025-08-08 | 13F | Trustco Bank Corp N Y | 2 800 | 0,00 | 263 | 11,44 | ||||
| 2025-08-12 | 13F | Integrated Advisors Network LLC | 3 551 | −40,11 | 334 | −33,33 | ||||
| 2025-08-14 | 13F | Hilton Capital Management, LLC | 6 300 | −19,34 | 593 | −10,30 | ||||
| 2025-07-17 | 13F | Keystone Global Partners, LLC | 52 522 | −2,38 | 4 941 | 8,67 | ||||
| 2025-08-01 | 13F | Advisory Alpha, LLC | 2 684 | 2,48 | 252 | 14,03 | ||||
| 2025-07-17 | 13F | Beacon Capital Management, LLC | 63 | 0,00 | 6 | 0,00 | ||||
| 2025-08-08 | 13F | IMA Wealth, Inc. | 261 | 0,00 | 25 | 9,09 | ||||
| 2025-07-15 | 13F | Fifth Third Bancorp | 257 | 0,00 | 24 | 14,29 | ||||
| 2025-08-14 | 13F | Stifel Financial Corp | 60 545 | −4,22 | 5 695 | 6,61 | ||||
| 2025-08-18 | 13F/A | National Bank Of Canada /fi/ | 284 | 294,44 | 27 | 333,33 | ||||
| 2025-05-16 | 13F | Signature Estate & Investment Advisors Llc | 0 | −100,00 | 0 | |||||
| 2025-07-01 | 13F | Harbor Investment Advisory, Llc | 3 530 | −2,75 | 332 | 8,50 | ||||
| 2025-08-12 | 13F | Charles Schwab Investment Management Inc | 1 211 514 | −2,77 | 113 967 | 8,23 | ||||
| 2025-08-01 | 13F | Envestnet Asset Management Inc | 149 777 | −34,20 | 14 090 | −26,75 | ||||
| 2025-07-02 | 13F | Crumly & Associates Inc. | 4 216 | 0,00 | 397 | 11,24 | ||||
| 2025-08-13 | 13F | Advocacy Wealth Management Services, LLC | 27 955 | −18,17 | 2 630 | −8,94 | ||||
| 2025-08-14 | 13F | Dagco, Inc. | 350 | 0,00 | 33 | 10,34 | ||||
| 2025-08-18 | 13F | Geneos Wealth Management Inc. | 0 | −100,00 | 0 | |||||
| 2025-08-07 | 13F | Kestra Private Wealth Services, Llc | 23 118 | 11,40 | 2 175 | 24,02 | ||||
| 2025-04-23 | 13F | Mascagni Wealth Management, Inc. | 0 | −100,00 | 0 | |||||
| 2025-08-12 | 13F | Atlas Capital Advisors Llc | 55 346 | −12,20 | 5 206 | −2,27 | ||||
| 2025-08-14 | 13F | Quantinno Capital Management LP | 2 240 | 211 | ||||||
| 2025-08-14 | 13F | Susquehanna International Group, Llp | 25 900 | −16,49 | 2 436 | −7,02 | ||||
| 2025-08-11 | 13F | Regal Investment Advisors LLC | 18 372 | 6,57 | 1 728 | 18,68 | ||||
| 2025-08-12 | 13F | Franklin Resources Inc | 3 000 | −34,54 | 282 | −27,13 | ||||
| 2025-08-13 | 13F | Cary Street Partners Financial Llc | 0 | −100,00 | 0 | |||||
| 2025-07-17 | 13F | Wolff Wiese Magana Llc | 15 | 0,00 | 1 | 0,00 | ||||
| 2025-08-05 | 13F | Sigma Planning Corp | 24 022 | 2,47 | 2 260 | 14,03 | ||||
| 2025-08-14 | 13F | Bnp Paribas Arbitrage, Sa | 0 | −100,00 | 0 | |||||
| 2025-05-01 | 13F | Quest 10 Wealth Builders, Inc. | 0 | −100,00 | 0 | |||||
| 2025-07-16 | 13F | Fischer Financial Services, Inc. | 141 243 | 0,51 | 13 285 | 11,86 | ||||
| 2025-08-07 | 13F | Allworth Financial LP | 245 | 8,41 | 23 | 27,78 | ||||
| 2025-07-23 | 13F | Pillar Financial Advisors, LLC | 34 | 0,00 | 3 | 50,00 | ||||
| 2025-08-12 | 13F | Proequities, Inc. | 0 | 0 | ||||||
| 2025-07-14 | 13F | Ridgewood Investments LLC | 116 | 0,00 | 11 | 11,11 | ||||
| 2025-07-29 | 13F | Stratos Wealth Advisors, LLC | 7 038 | 8,73 | 662 | 21,02 | ||||
| 2025-08-04 | 13F | AlphaStar Capital Management, LLC | 10 790 | 1 015 | ||||||
| 2025-07-16 | 13F | Brown, Lisle/cummings, Inc. | 12 | 0,00 | 1 | 0,00 | ||||
| 2025-08-14 | 13F | Sunbelt Securities, Inc. | 8 323 | −3,99 | 811 | 10,79 | ||||
| 2025-05-15 | 13F/A | Orion Portfolio Solutions, LLC | 16 140 | −1,33 | 1 364 | −14,49 | ||||
| 2025-05-01 | 13F | Grant/GrossMendelsohn, LLC | 0 | −100,00 | 0 | −100,00 | ||||
| 2025-08-07 | 13F | Evoke Wealth, Llc | 2 377 | 224 | ||||||
| 2025-08-12 | 13F | Howe & Rusling Inc | 397 | 37 | ||||||
| 2025-08-06 | 13F | Aspetuck Financial Management LLC | 7 108 | 5,51 | 669 | 17,40 | ||||
| 2025-08-12 | 13F | SRS Capital Advisors, Inc. | 406 | 38 | ||||||
| 2025-08-15 | 13F | Kestra Advisory Services, LLC | 80 617 | 9,19 | 7 584 | 21,54 | ||||
| 2025-05-05 | 13F | Lindbrook Capital, Llc | 209 | 0,00 | 18 | −15,00 | ||||
| 2025-07-16 | 13F | Southern Capital Advisors, Llc | 17 237 | 9,79 | 1 622 | 22,25 | ||||
| 2025-07-24 | 13F | Robertson Stephens Wealth Management, LLC | 4 113 | −3,72 | 387 | 6,93 | ||||
| 2025-08-14 | 13F | GWM Advisors LLC | 15 200 | −9,38 | 1 430 | 0,85 | ||||
| 2025-08-12 | 13F | BlackRock, Inc. | 1 | −99,94 | 0 | −100,00 | ||||
| 2025-08-06 | 13F | Soltis Investment Advisors LLC | 6 701 | −3,94 | 630 | 6,96 | ||||
| 2025-07-22 | 13F | Yoder Wealth Management, Inc. | 42 187 | 2,00 | 3 969 | 13,53 | ||||
| 2025-08-08 | 13F | Pnc Financial Services Group, Inc. | 1 456 | −10,01 | 137 | 0,00 | ||||
| 2025-08-04 | 13F | Pensionmark Financial Group, Llc | 6 267 | −5,19 | 590 | 5,56 | ||||
| 2025-08-04 | 13F | Atria Investments Llc | 4 658 | −45,41 | 438 | −39,25 | ||||
| 2025-08-13 | 13F | KDK Private Wealth Management, LLC | 16 333 | −1,03 | 1 536 | 10,27 | ||||
| 2025-07-16 | 13F/A | CX Institutional | 34 586 | 25,53 | 3 | 50,00 | ||||
| 2025-08-13 | 13F | Fisher Asset Management, LLC | 70 644 | 0,19 | 6 646 | 11,53 | ||||
| 2025-07-31 | 13F | Moser Wealth Advisors, LLC | 48 | 5 | ||||||
| 2025-05-02 | 13F | Dakota Wealth Management | 0 | −100,00 | 0 | |||||
| 2025-08-01 | 13F | Penobscot Wealth Management | 32 417 | 9,20 | 3 049 | 21,57 | ||||
| 2025-07-30 | 13F | Gables Capital Management Inc. | 192 | 0,00 | 18 | 12,50 | ||||
| 2025-08-06 | 13F | Agf Management Ltd | 274 125 | 1,50 | 25 787 | 12,98 | ||||
| 2025-07-16 | 13F | Signature Resources Capital Management, LLC | 512 | 48 | ||||||
| 2025-08-15 | 13F | Morgan Stanley | 182 082 | 14,74 | 17 129 | 27,73 | ||||
| 2025-08-08 | 13F | Cetera Investment Advisers | 52 344 | −10,05 | 4 924 | 0,14 | ||||
| 2025-08-11 | 13F | Brown Brothers Harriman & Co | 1 839 | 173 | ||||||
| 2025-08-11 | 13F | SFI Advisors, LLC | 50 029 | −4,88 | 4 706 | 5,90 | ||||
| 2025-08-14 | 13F | Benjamin Edwards Inc | 4 033 | −18,01 | 379 | −8,67 | ||||
| 2025-07-14 | 13F | Hoey Investments, Inc | 83 | 0,00 | 8 | 0,00 | ||||
| 2025-08-08 | 13F | Meridian Wealth Management, LLC | 8 999 | −3,86 | 847 | 6,95 | ||||
| 2025-04-23 | 13F | Chevy Chase Trust Holdings, Inc. | 0 | −100,00 | 0 | |||||
| 2025-08-13 | 13F | Jones Financial Companies Lllp | 10 192 | 3,65 | 964 | 15,88 | ||||
| 2025-08-14 | 13F | Glenmede Investment Management, LP | 442 | 42 | ||||||
| 2025-04-24 | 13F | Wingate Wealth Advisors, Inc. | 0 | −100,00 | 0 | |||||
| 2025-08-12 | 13F | O'shaughnessy Asset Management, Llc | 20 170 | 14,30 | 1 897 | 27,23 | ||||
| 2025-08-13 | 13F | Colonial Trust Advisors | 831 | 0,00 | 78 | 11,43 | ||||
| 2025-05-15 | 13F | Minot DeBlois Advisors LLC | 0 | −100,00 | 0 | |||||
| 2025-08-14 | 13F | Bank Of America Corp /de/ | 923 778 | −41,65 | 86 900 | −35,05 | ||||
| 2025-07-25 | 13F | Apollon Wealth Management, LLC | 106 915 | 2,17 | 10 058 | 13,73 | ||||
| 2025-08-14 | 13F | EP Wealth Advisors, Inc. | 20 229 | −5,24 | 1 903 | 5,43 | ||||
| 2025-08-12 | 13F | Coldstream Capital Management Inc | 0 | −100,00 | 0 | |||||
| 2025-03-21 | 13F | Prostatis Group LLC | 0 | −100,00 | 0 | |||||
| 2025-07-31 | 13F | Cambridge Investment Research Advisors, Inc. | 32 439 | −8,62 | 3 | 0,00 | ||||
| 2025-08-08 | 13F | Crossmark Global Holdings, Inc. | 8 730 | 0,00 | 822 | 11,38 | ||||
| 2025-08-14 | 13F | UBS Group AG | 21 249 | −17,57 | 1 999 | −8,26 | ||||
| 2025-08-06 | 13F | Richard Bernstein Advisors LLC | 506 198 | −45,95 | 47 621 | −39,84 | ||||
| 2025-08-13 | 13F | Renaissance Technologies Llc | 0 | −100,00 | 0 | |||||
| 2025-08-06 | 13F | Csenge Advisory Group | 2 711 | −7,76 | 250 | 7,30 | ||||
| 2025-04-29 | 13F | Element Wealth, LLC | 0 | −100,00 | 0 | |||||
| 2025-07-08 | 13F | Nbc Securities, Inc. | 5 725 | 0,56 | 1 | |||||
| 2025-08-14 | 13F | Fmr Llc | 44 542 | 16,11 | 4 190 | 29,28 | ||||
| 2025-07-24 | 13F | IFP Advisors, Inc | 1 347 | 0,00 | 127 | 11,50 | ||||
| 2025-05-14 | 13F | Oarsman Capital, Inc. | 0 | −100,00 | 0 | −100,00 | ||||
| 2025-08-05 | 13F | Dunhill Financial, LLC | 123 | 0,00 | 12 | 10,00 | ||||
| 2025-05-12 | 13F | Founders Financial Securities Llc | 0 | −100,00 | 0 | |||||
| 2025-07-28 | 13F | Harbour Investments, Inc. | 67 | 63,41 | 6 | 100,00 | ||||
| 2025-08-12 | 13F | AlphaCore Capital LLC | 185 | 17 | ||||||
| 2025-08-14 | 13F | Citadel Advisors Llc | Call | 2 400 | −20,00 | 226 | −11,07 | |||
| 2025-07-10 | 13F | Charter Oak Capital Management, LLC | 6 891 | −9,33 | 648 | 0,93 | ||||
| 2025-08-14 | 13F | CoreCap Advisors, LLC | 1 434 | 52,39 | 135 | 69,62 | ||||
| 2025-08-14 | 13F | Mercer Global Advisors Inc /adv | 4 694 | 7,86 | 442 | 20,16 | ||||
| 2025-08-08 | 13F | Capital Investment Counsel, Inc | 0 | −100,00 | 0 | |||||
| 2025-08-14 | 13F | Kovitz Investment Group Partners, LLC | 14 148 | −54,64 | 1 331 | −49,53 | ||||
| 2025-08-19 | 13F | Advisory Services Network, LLC | 7 269 | −84,71 | 697 | −82,65 | ||||
| 2025-08-12 | 13F | CIBC Private Wealth Group, LLC | 123 | −38,19 | 12 | −21,43 | ||||
| 2025-07-23 | 13F | Monte Financial Group, LLC | 2 518 | 237 | ||||||
| 2025-07-24 | 13F | Blair William & Co/il | 646 | −11,14 | 61 | −1,64 | ||||
| 2025-08-19 | 13F | Newbridge Financial Services Group, Inc. | 42 | 0,00 | 4 | 0,00 | ||||
| 2025-08-01 | 13F | Chilton Capital Management Llc | 527 | −2,23 | 50 | 8,89 | ||||
| 2025-07-09 | 13F | Tounjian Advisory Partners, Llc | 7 778 | −3,21 | 657 | −3,24 | ||||
| 2025-07-15 | 13F | MCF Advisors LLC | 46 | 0,00 | 4 | 33,33 | ||||
| 2025-08-14 | 13F | Jane Street Group, Llc | 29 207 | 5,00 | 2 748 | 16,89 | ||||
| 2025-08-14 | 13F | Raymond James Financial Inc | 12 375 | 8,97 | 1 164 | 21,38 | ||||
| 2025-04-18 | 13F | Global Trust Asset Management, LLC | 0 | −100,00 | 0 | |||||
| 2025-08-12 | 13F | Guerra Advisors Inc | 40 462 | 32,67 | 3 806 | 47,69 | ||||
| 2025-08-14 | 13F | Wells Fargo & Company/mn | 24 309 | −11,66 | 2 287 | −1,68 | ||||
| 2025-07-25 | 13F | Ellis Investment Partners, LLC | 13 541 | −1,63 | 1 274 | 9,46 | ||||
| 2025-08-04 | 13F | Amplius Wealth Advisors, LLC | 2 391 | 0,93 | 225 | 12,00 | ||||
| 2025-07-28 | 13F | Rosenberg Matthew Hamilton | 2 434 | 0,00 | 229 | 11,22 | ||||
| 2025-08-01 | 13F | Transcend Wealth Collective, Llc | 0 | −100,00 | 0 | |||||
| 2025-06-30 | NP | Northern Lights Fund Trust - PFG Fidelity Institutional AM® Equity Sector Strategy Fund Class R Shares | 932 856 | 157,89 | 78 845 | 115,21 | ||||
| 2025-08-01 | 13F | Bessemer Group Inc | 0 | −100,00 | 0 | |||||
| 2025-07-17 | 13F | Fifth Third Securities, Inc. | 4 003 | 0,00 | 377 | 11,24 | ||||
| 2025-08-05 | 13F | Lifeworks Advisors, LLC | 24 831 | −4,32 | 2 336 | 6,48 | ||||
| 2025-07-25 | 13F | Atria Wealth Solutions, Inc. | 12 651 | −49,56 | 1 213 | −42,76 | ||||
| 2025-05-01 | 13F | Q3 Asset Management | 0 | −100,00 | 0 | |||||
| 2025-09-04 | 13F/A | Advisor Group Holdings, Inc. | 101 608 | 48,17 | 9 504 | 63,61 | ||||
| 2025-07-29 | 13F | Private Trust Co Na | 47 | 38,24 | 4 | 100,00 | ||||
| 2025-07-28 | 13F | BRYN MAWR TRUST Co | 200 | 0,00 | 19 | 12,50 | ||||
| 2025-08-26 | 13F/A | Thrivent Financial For Lutherans | 23 026 | −19,43 | 2 | 0,00 | ||||
| 2025-08-11 | 13F | TD Waterhouse Canada Inc. | 250 | 0,00 | 24 | 9,52 | ||||
| 2025-07-17 | 13F | Avondale Wealth Management | 1 248 | 0,00 | 117 | 11,43 | ||||
| 2025-07-22 | 13F | Grimes & Company, Inc. | 2 959 | 278 | ||||||
| 2025-08-14 | 13F | Citadel Advisors Llc | 0 | −100,00 | 0 | |||||
| 2025-05-02 | 13F | Cullen/frost Bankers, Inc. | 0 | −100,00 | 0 | |||||
| 2025-08-21 | 13F | Pathway Financial Advisers, LLC | 16 339 | 1,26 | 1 537 | 12,77 | ||||
| 2025-08-13 | 13F | Level Four Advisory Services, Llc | 7 927 | 0,37 | 746 | 11,69 | ||||
| 2025-08-14 | 13F | Old Mission Capital Llc | 4 705 | 443 | ||||||
| 2025-08-11 | 13F | Aptus Capital Advisors, LLC | 35 | 0,00 | 3 | 50,00 | ||||
| 2025-07-11 | 13F | Farther Finance Advisors, LLC | 8 349 | −25,80 | 785 | −18,31 | ||||
| 2025-08-14 | 13F | Mml Investors Services, Llc | 5 259 | −74,78 | 0 | −100,00 | ||||
| 2025-07-15 | 13F | Lynch & Associates/in | 18 262 | 0,45 | 1 718 | 11,78 | ||||
| 2025-08-27 | 13F/A | Brinker Capital Investments, LLC | 16 987 | 5,25 | 1 598 | 17,24 | ||||
| 2025-07-23 | 13F | Heck Capital Advisors, LLC | 8 516 | −55,24 | 801 | −50,19 | ||||
| 2025-08-14 | 13F | Redwood Financial Network Corp | 2 614 | 246 | ||||||
| 2025-08-13 | 13F | Green Harvest Asset Management LLC | 6 440 | −4,39 | 606 | 6,33 | ||||
| 2025-04-23 | 13F | PMV Capital Advisers, LLC | 0 | −100,00 | 0 | |||||
| 2025-08-08 | 13F | Hartland & Co., LLC | 618 | 0,00 | 58 | 11,54 | ||||
| 2025-05-01 | 13F | High Note Wealth, LLC | 0 | −100,00 | 0 | |||||
| 2025-07-09 | 13F | Bank of New Hampshire | 84 | 0,00 | 8 | 0,00 | ||||
| 2025-07-31 | 13F | Sage Mountain Advisors LLC | 1 011 | 0,00 | 95 | 11,76 | ||||
| 2025-08-05 | 13F | Bank of New York Mellon Corp | 5 040 | −49,07 | 474 | −43,30 | ||||
| 2025-08-14 | 13F | Qube Research & Technologies Ltd | 1 954 | −12,10 | 184 | −2,14 | ||||
| 2025-07-24 | 13F | Ronald Blue Trust, Inc. | 1 377 | −42,12 | 130 | −35,82 | ||||
| 2025-07-25 | 13F | Envestnet Portfolio Solutions, Inc. | 0 | −100,00 | 0 | |||||
| 2025-07-30 | 13F | Princeton Global Asset Management LLC | 549 | 0,00 | 52 | 10,87 | ||||
| 2025-08-19 | 13F | National Asset Management, Inc. | 5 536 | −6,58 | 521 | −9,88 | ||||
| 2025-08-05 | 13F | EPG Wealth Management LLC | 44 | 0,00 | 4 | 33,33 | ||||
| 2025-08-08 | 13F | Glassman Wealth Services | 0 | −100,00 | 0 | |||||
| 2025-05-08 | NP | QALTX - Quantified Alternative Investment Fund Investor Class Shares | 0 | −100,00 | 0 | −100,00 | ||||
| 2025-07-28 | 13F | J.Safra Asset Management Corp | 6 869 | −28,22 | 650 | −19,68 | ||||
| 2025-08-14 | 13F | Hrt Financial Lp | 0 | −100,00 | 0 | |||||
| 2025-08-11 | 13F | Mach-1 Financial Group, Inc. | 0 | −100,00 | 0 | |||||
| 2025-07-10 | 13F | Wealth Enhancement Advisory Services, Llc | 6 827 | −3,36 | 655 | 9,55 | ||||
| 2025-08-01 | 13F | SYM FINANCIAL Corp | 524 | 49 | ||||||
| 2025-08-11 | 13F | Pineridge Advisors LLC | 91 | 0,00 | 9 | 14,29 | ||||
| 2025-04-30 | 13F | Round Rock Advisors, LLC | 0 | −100,00 | 0 | |||||
| 2025-07-24 | 13F | Us Bancorp \de\ | 63 | 0,00 | 6 | 0,00 | ||||
| 2025-08-11 | 13F | HighTower Advisors, LLC | 83 953 | 108,96 | 7 897 | 132,61 | ||||
| 2025-08-12 | 13F | MAI Capital Management | 808 | −8,29 | 76 | 2,70 | ||||
| 2025-08-12 | 13F | J.w. Cole Advisors, Inc. | 19 225 | 143,35 | 1 809 | 171,06 | ||||
| 2025-05-02 | 13F | Capital A Wealth Management, LLC | 63 | 425,00 | 5 | 400,00 | ||||
| 2025-08-14 | 13F | Glen Eagle Advisors, LLC | 1 404 | 0,00 | 132 | 11,86 | ||||
| 2025-08-13 | 13F | Whalerock Point Partners, Llc | 3 678 | 0,03 | 346 | 11,29 | ||||
| 2025-04-29 | 13F | Hm Payson & Co | 172 | 0,00 | 15 | −12,50 | ||||
| 2025-08-25 | 13F/A | Promus Capital, LLC | 210 | 0,00 | 20 | 11,76 | ||||
| 2025-07-08 | 13F | Ehrlich Financial Group | 2 199 | −45,11 | 207 | −39,05 | ||||
| 2025-07-10 | 13F | Fulton Bank, N.a. | 2 310 | −34,69 | 217 | −27,18 | ||||
| 2025-08-05 | 13F | GHP Investment Advisors, Inc. | 36 | 0,00 | 3 | 0,00 | ||||
| 2025-08-04 | 13F | Linscomb & Williams, Inc. | 3 455 | 0,00 | 325 | 11,68 | ||||
| 2025-08-14 | 13F | IHT Wealth Management, LLC | 4 564 | 429 | ||||||
| 2025-08-06 | 13F | Decker Retirement Planning Inc. | 364 | 0,00 | 34 | 13,33 | ||||
| 2025-08-08 | 13F | Independence Financial Advisors, LLC | 58 594 | 5 512 | ||||||
| 2025-08-08 | 13F | Creative Planning | 5 361 | 2,56 | 504 | 14,29 | ||||
| 2025-07-28 | 13F | Axxcess Wealth Management, Llc | 0 | −100,00 | 0 | |||||
| 2025-08-14 | 13F | D. E. Shaw & Co., Inc. | 2 148 | 202 | ||||||
| 2025-08-04 | 13F | Arkadios Wealth Advisors | 2 706 | 4,52 | 255 | 16,51 | ||||
| 2025-08-12 | 13F | PKS Advisory Services, LLC | 3 251 | 0,03 | 306 | 11,31 | ||||
| 2025-07-23 | 13F | Proffitt & Goodson Inc | 695 | 0,00 | 65 | 12,07 | ||||
| 2025-08-15 | 13F | CI Private Wealth, LLC | 2 410 | −41,16 | 227 | −34,68 | ||||
| 2025-08-04 | 13F | Assetmark, Inc | 65 079 | 16,65 | 6 122 | 29,85 | ||||
| 2025-08-13 | 13F | Colonial Trust Co / SC | 605 | −40,34 | 57 | −34,12 | ||||
| 2025-07-30 | 13F | Brookstone Capital Management | 0 | −100,00 | 0 | |||||
| 2025-08-11 | 13F | Beaumont Capital Management, LLC | 0 | −100,00 | 0 | |||||
| 2025-08-13 | 13F | Summit Financial, LLC | 8 277 | 6,88 | 779 | 18,96 | ||||
| 2025-07-16 | 13F | American National Bank | 7 054 | 1,38 | 664 | 12,76 | ||||
| 2025-08-11 | 13F | Principal Securities, Inc. | 11 | −90,68 | 1 | −90,91 | ||||
| 2025-07-07 | 13F | Roxbury Financial LLC | 133 | 3,10 | 13 | 9,09 | ||||
| 2025-08-14 | 13F | Goldman Sachs Group Inc | 0 | −100,00 | 0 | |||||
| 2025-04-30 | 13F | Personal Cfo Solutions, Llc | 0 | −100,00 | 0 | |||||
| 2025-07-08 | 13F | Parallel Advisors, LLC | 35 | 0,00 | 3 | 50,00 | ||||
| 2025-08-14 | 13F | Integrated Wealth Concepts LLC | 2 405 | 226 | ||||||
| 2025-08-05 | 13F | Simplex Trading, Llc | 102 | 131,82 | 0 | |||||
| 2025-08-13 | 13F | Northwestern Mutual Wealth Management Co | 41 619 | −35,95 | 3 915 | −28,70 | ||||
| 2025-08-05 | 13F | Bank Of Montreal /can/ | 112 | −6,67 | 11 | 0,00 | ||||
| 2025-08-06 | 13F | Stonebridge Financial Planning Group, LLC | 8 710 | 3,54 | 819 | 15,35 | ||||
| 2025-07-22 | 13F | DAVENPORT & Co LLC | 0 | −100,00 | 0 | |||||
| 2025-08-14 | 13F | Comerica Bank | 1 779 | −22,45 | 167 | −13,47 | ||||
| 2025-08-04 | 13F | Barnes Dennig Private Wealth Management LLC | 253 | 0,00 | 24 | 9,52 | ||||
| 2025-08-07 | 13F | Addison Advisors LLC | 522 | 0,00 | 49 | 11,36 | ||||
| 2025-07-21 | 13F | HighMark Wealth Management LLC | 190 | 0,00 | 18 | 6,25 | ||||
| 2025-07-22 | 13F | Gsa Capital Partners Llp | 5 157 | 0 | ||||||
| 2025-08-06 | 13F | AE Wealth Management LLC | 679 914 | 4,51 | 63 959 | 16,33 | ||||
| 2025-08-01 | 13F | Schmidt P J Investment Management Inc | 14 208 | 34,05 | 1 337 | 49,27 | ||||
| 2025-07-23 | 13F | Magnolia Capital Management Ltd | 7 685 | 0,00 | 1 | |||||
| 2025-07-23 | 13F | Hall Capital Management Co Inc | 5 407 | −7,68 | 509 | 2,83 | ||||
| 2025-08-12 | 13F | Pathstone Holdings, LLC | 2 812 | −66,91 | 265 | −64,71 | ||||
| 2025-07-17 | 13F | Smith, Salley & Associates | 24 274 | 0,43 | 2 283 | 11,80 | ||||
| 2025-08-06 | 13F | Kcm Investment Advisors Llc | 50 632 | −0,09 | 4 763 | 11,21 | ||||
| 2025-08-08 | 13F | Gts Securities Llc | 0 | −100,00 | 0 | |||||
| 2025-08-14 | 13F | Mariner, LLC | 53 836 | 5,28 | 5 064 | 17,20 | ||||
| 2025-07-16 | 13F | Signaturefd, Llc | 618 | −1,59 | 58 | 9,43 | ||||
| 2025-08-13 | 13F | Lido Advisors, LLC | 1 359 670 | −8,97 | 127 904 | 1,33 | ||||
| 2025-08-14 | 13F | Van Eck Associates Corp | 111 | 0,00 | 0 | |||||
| 2025-05-13 | 13F | ASB Consultores, LLC | 0 | −100,00 | 0 | |||||
| 2025-08-05 | 13F | Huntington National Bank | 0 | |||||||
| 2025-08-14 | 13F/A | Rockefeller Capital Management L.P. | 13 950 | 2,78 | 1 312 | 14,39 | ||||
| 2025-07-16 | 13F | Patron Partners Advisors, Llc | 0 | −100,00 | 0 | |||||
| 2025-08-06 | 13F | Mcrae Capital Management Inc | 3 239 | 305 | ||||||
| 2025-07-15 | 13F | Elevated Capital Advisors, LLC | 12 080 | 0,00 | 1 021 | 0,00 | ||||
| 2025-07-24 | 13F | Morton Brown Family Wealth, LLC | 106 | 0,00 | 10 | 12,50 | ||||
| 2025-08-13 | 13F | Congress Wealth Management LLC / DE / | 3 310 | −73,41 | 312 | −70,44 | ||||
| 2025-08-06 | 13F | Valued Wealth Advisors LLC | 50 | 0,00 | 5 | 0,00 | ||||
| 2025-08-13 | 13F | Russell Investments Group, Ltd. | 129 | −43,67 | 12 | −36,84 | ||||
| 2025-07-14 | 13F | GAMMA Investing LLC | 128 | 0,00 | 12 | 20,00 | ||||
| 2025-05-06 | 13F | Advisors Preferred, LLC | 0 | −100,00 | 0 | |||||
| 2025-07-30 | 13F | VCI Wealth Management LLC | 7 876 | 6,69 | 741 | 18,78 | ||||
| 2025-08-01 | 13F | Purkiss Capital Advisors LLC | 6 377 | −9,19 | 600 | 1,01 | ||||
| 2025-08-12 | 13F | Global Retirement Partners, LLC | 1 582 | −7,00 | 149 | −10,30 | ||||
| 2025-07-07 | 13F | Versant Capital Management, Inc | 352 | 0,00 | 33 | 13,79 | ||||
| 2025-08-12 | 13F | Eley Financial Management, Inc | 4 503 | −5,06 | 424 | 4,44 | ||||
| 2025-07-21 | 13F | Exchange Capital Management, Inc. | 28 357 | −2,48 | 2 668 | 8,55 | ||||
| 2025-07-17 | 13F | Sound Income Strategies, LLC | 153 | 0,00 | 14 | 16,67 | ||||
| 2025-07-22 | 13F | Valley National Advisers Inc | 20 | 0,00 | 0 | |||||
| 2025-08-07 | 13F | PFG Advisors | 665 707 | 22 112,45 | 47 085 | 18 510,67 | ||||
| 2025-08-14 | 13F | Cubist Systematic Strategies, LLC | 0 | −100,00 | 0 | |||||
| 2025-08-14 | 13F | Royal Bank Of Canada | 24 237 | −80,76 | 2 280 | −78,59 | ||||
| 2025-08-12 | 13F | Coston, McIsaac & Partners | 229 | 0,44 | 0 | |||||
| 2025-07-21 | 13F | Barrett & Company, Inc. | 211 | 0,00 | 20 | 11,76 | ||||
| 2025-08-14 | 13F | Ameriprise Financial Inc | 71 296 | 69,68 | 6 707 | 88,85 | ||||
| 2025-05-16 | 13F/A | Kestra Investment Management, LLC | 0 | −100,00 | 0 | |||||
| 2025-07-16 | 13F | Beaumont Financial Advisors, LLC | 18 996 | 1 787 | ||||||
| 2025-08-11 | 13F | Tidemark, LLC | 168 | 0,00 | 16 | 7,14 | ||||
| 2025-05-06 | 13F | Venturi Wealth Management, LLC | 0 | −100,00 | 0 | |||||
| 2025-05-09 | 13F | Belvedere Trading LLC | Call | 0 | −100,00 | 0 | ||||
| 2025-08-08 | 13F | Smithfield Trust Co | 3 931 | 9,62 | 0 | |||||
| 2025-07-25 | 13F | Cwm, Llc | 30 | −97,82 | 0 | |||||
| 2025-07-28 | 13F | Interchange Capital Partners, LLC | 160 | −94,88 | 287 | 8,71 | ||||
| 2025-08-06 | 13F | Maltin Wealth Management, Inc. | 34 141 | 2,89 | 3 212 | 14,51 | ||||
| 2025-04-28 | 13F | UMA Financial Services, Inc. | 0 | −100,00 | 0 | |||||
| 2025-04-30 | 13F | Stratos Wealth Partners, LTD. | 0 | −100,00 | 0 | |||||
| 2025-07-17 | 13F | Centennial Wealth Advisory LLC | 4 664 | −1,62 | 440 | 10,00 | ||||
| 2025-08-12 | 13F | LPL Financial LLC | 113 979 | 0,04 | 10 722 | 11,36 | ||||
| 2025-08-14 | 13F | Syon Capital Llc | 5 975 | 562 | ||||||
| 2025-08-06 | 13F | Commonwealth Equity Services, Llc | 119 589 | 3,30 | 11 | 22,22 | ||||
| 2025-08-13 | 13F | Northern Trust Corp | 2 709 | 0,00 | 255 | 11,40 | ||||
| 2025-08-15 | 13F | Tower Research Capital LLC (TRC) | 0 | −100,00 | 0 | |||||
| 2025-08-01 | 13F | Rossby Financial, LCC | 93 | 0,00 | 9 | 14,29 | ||||
| 2025-08-11 | 13F | Citigroup Inc | 28 847 | 61,45 | 2 714 | 79,79 | ||||
| 2025-08-13 | 13F | Flow Traders U.s. Llc | 0 | −100,00 | 0 |