Grundläggande statistik
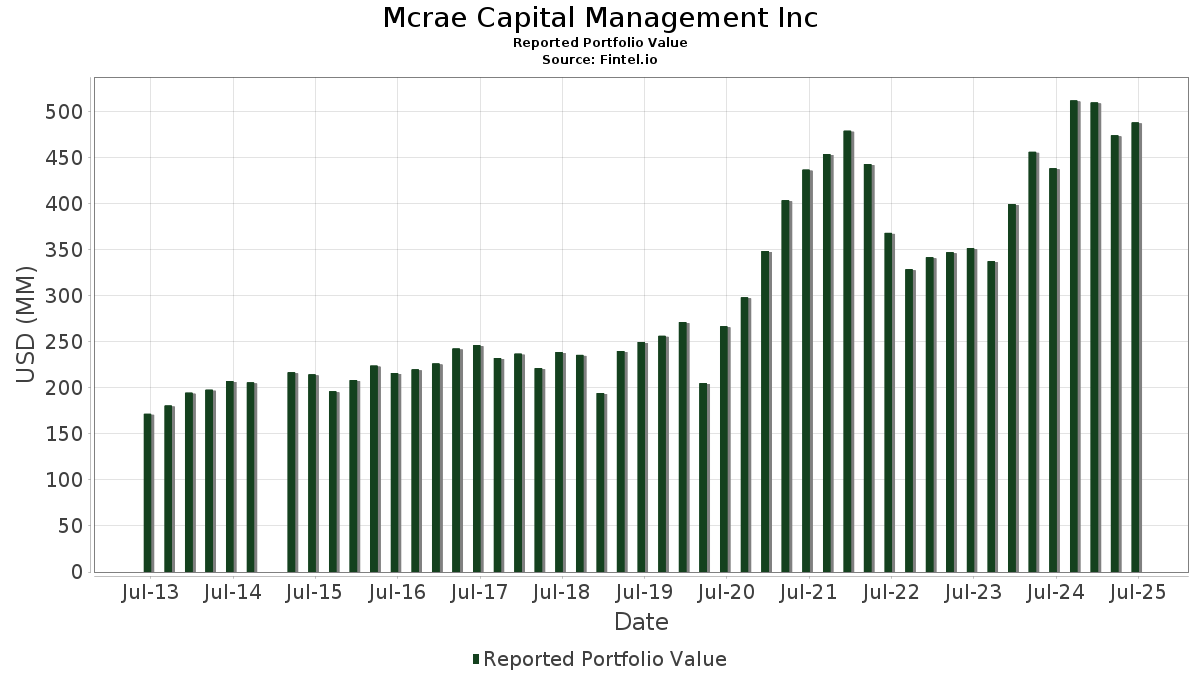
| Portföljvärde | $ 503 796 828 |
| Aktuella positioner | 103 |
Senaste innehav, resultat, förvaltat kapital (från 13F, 13D)
Mcrae Capital Management Inc har redovisat 103 totala innehav i sina senaste SEC-arkiveringar. Det senaste portföljvärdet beräknas vara $ 503 796 828 USD. Faktiskt förvaltade tillgångar (AUM) är detta värde plus likvida medel (som inte redovisas). Mcrae Capital Management Incs största innehav är Microsoft Corporation (US:MSFT) , Williams-Sonoma, Inc. (US:WSM) , Nasdaq, Inc. (US:NDAQ) , Labcorp Holdings Inc. (US:LH) , and Check Point Software Technologies Ltd. (US:CHKP) . Mcrae Capital Management Incs nya positioner inkluderar Insmed Incorporated (US:INSM) , TowneBank (US:TOWN) , Provident Financial Services, Inc. (US:PFS) , .
Största ökningarna detta kvartal
Vi använder förändringen i portföljallokeringen eftersom det är det mest meningsfulla måttet. Förändringar kan bero på transaktioner eller förändringar i aktiekurser.
| Värdepapper | Aktier (MM) |
Värde (MM$) |
Portfölj % av | ΔPortfölj % av |
|---|---|---|---|---|
| GOOGL / Alphabet Inc. | 0,05 | 12,83 | 2,5468 | 0,9014 |
| INSM / Insmed Incorporated | 0,03 | 3,92 | 0,7774 | 0,7774 |
| URI / United Rentals, Inc. | 0,02 | 15,88 | 3,1517 | 0,4858 |
| WSM / Williams-Sonoma, Inc. | 0,13 | 26,26 | 5,2120 | 0,4840 |
| ACN / Accenture plc | 0,04 | 10,98 | 2,1804 | 0,4678 |
| TMO / Thermo Fisher Scientific Inc. | 0,03 | 14,92 | 2,9622 | 0,4058 |
| LOW / Lowe's Companies, Inc. | 0,09 | 22,26 | 4,4183 | 0,3663 |
| OMC / Omnicom Group Inc. | 0,22 | 17,58 | 3,4896 | 0,3125 |
| UNH / UnitedHealth Group Incorporated | 0,03 | 9,11 | 1,8077 | 0,3115 |
| SNA / Snap-on Incorporated | 0,05 | 17,76 | 3,5261 | 0,2271 |
Största minskningarna detta kvartal
Vi använder förändringen i portföljallokeringen eftersom det är det mest meningsfulla måttet. Förändringar kan bero på transaktioner eller förändringar i aktiepriser.
| Värdepapper | Aktier (MM) |
Värde (MM$) |
Portfölj % av | ΔPortfölj % av |
|---|---|---|---|---|
| FI / Fiserv, Inc. | 0,13 | 17,10 | 3,3948 | −1,0895 |
| CHKP / Check Point Software Technologies Ltd. | 0,11 | 23,75 | 4,7134 | −0,6012 |
| CRM / Salesforce, Inc. | 0,05 | 12,70 | 2,5202 | −0,4413 |
| NDAQ / Nasdaq, Inc. | 0,28 | 24,70 | 4,9028 | −0,3730 |
| PYPL / PayPal Holdings, Inc. | 0,19 | 12,57 | 2,4944 | −0,3708 |
| PWR / Quanta Services, Inc. | 0,04 | 18,36 | 3,6445 | −0,2450 |
| MSFT / Microsoft Corporation | 0,07 | 34,11 | 6,7714 | −0,2398 |
| VRTX / Vertex Pharmaceuticals Incorporated | 0,03 | 12,99 | 2,5777 | −0,1982 |
| BR / Broadridge Financial Solutions, Inc. | 0,06 | 13,76 | 2,7315 | −0,1859 |
| CB / Chubb Limited | 0,04 | 12,49 | 2,4783 | −0,1226 |
13F- och fond arkiveringar
Denna blankett lämnades in den 2025-11-07 för rapporteringsperioden 2025-09-30. Klicka på länksymbolen för att se hela transaktionshistoriken.
Uppgradera för att låsa upp premiumdata och exportera till Excel![]() .
.
| Värdepapper | Typ | Genomsnittligt aktiepris | Aktier (MM) |
ΔAktier (%) |
Värde ($MM) |
ΔAktier (%) |
Portfölj (%) |
ΔPortfölj (%) |
|
|---|---|---|---|---|---|---|---|---|---|
| MSFT / Microsoft Corporation | 0,07 | −4,33 | 34,11 | −0,38 | 6,7714 | −0,2398 | |||
| WSM / Williams-Sonoma, Inc. | 0,13 | −4,95 | 26,26 | 13,72 | 5,2120 | 0,4840 | |||
| NDAQ / Nasdaq, Inc. | 0,28 | −3,09 | 24,70 | −4,14 | 4,9028 | −0,3730 | |||
| LH / Labcorp Holdings Inc. | 0,08 | −1,08 | 24,25 | 8,17 | 4,8131 | 0,2235 | |||
| CHKP / Check Point Software Technologies Ltd. | 0,11 | −2,18 | 23,75 | −8,52 | 4,7134 | −0,6012 | |||
| LOW / Lowe's Companies, Inc. | 0,09 | −0,70 | 22,26 | 12,48 | 4,4183 | 0,3663 | |||
| KEYS / Keysight Technologies, Inc. | 0,11 | −1,91 | 19,75 | 4,71 | 3,9208 | 0,0584 | |||
| PWR / Quanta Services, Inc. | 0,04 | −11,82 | 18,36 | −3,35 | 3,6445 | −0,2450 | |||
| SNA / Snap-on Incorporated | 0,05 | −0,99 | 17,76 | 10,25 | 3,5261 | 0,2271 | |||
| OMC / Omnicom Group Inc. | 0,22 | −0,03 | 17,58 | 13,30 | 3,4896 | 0,3125 | |||
| FI / Fiserv, Inc. | 0,13 | 4,42 | 17,10 | −21,91 | 3,3948 | −1,0895 | |||
| URI / United Rentals, Inc. | 0,02 | −3,76 | 15,88 | 21,95 | 3,1517 | 0,4858 | |||
| WDAY / Workday, Inc. | 0,06 | 3,15 | 15,35 | 3,46 | 3,0468 | 0,0091 | |||
| TMO / Thermo Fisher Scientific Inc. | 0,03 | −0,08 | 14,92 | 19,53 | 2,9622 | 0,4058 | |||
| TFC / Truist Financial Corporation | 0,30 | 0,26 | 13,85 | 6,62 | 2,7485 | 0,0895 | |||
| BR / Broadridge Financial Solutions, Inc. | 0,06 | −1,45 | 13,76 | −3,42 | 2,7315 | −0,1859 | |||
| VRTX / Vertex Pharmaceuticals Incorporated | 0,03 | 8,89 | 12,99 | −4,21 | 2,5777 | −0,1982 | |||
| GOOGL / Alphabet Inc. | 0,05 | 15,75 | 12,83 | 59,68 | 2,5468 | 0,9014 | |||
| CRM / Salesforce, Inc. | 0,05 | 1,00 | 12,70 | −12,22 | 2,5202 | −0,4413 | |||
| PYPL / PayPal Holdings, Inc. | 0,19 | −0,48 | 12,57 | −10,20 | 2,4944 | −0,3708 | |||
| CB / Chubb Limited | 0,04 | 0,89 | 12,49 | −1,72 | 2,4783 | −0,1226 | |||
| ACN / Accenture plc | 0,04 | 59,17 | 10,98 | 31,32 | 2,1804 | 0,4678 | |||
| BDX / Becton, Dickinson and Company | 0,05 | 2,60 | 9,35 | 11,49 | 1,8552 | 0,1387 | |||
| UNH / UnitedHealth Group Incorporated | 0,03 | 12,59 | 9,11 | 24,63 | 1,8077 | 0,3115 | |||
| JPM / JPMorgan Chase & Co. | 0,03 | −1,15 | 8,25 | 7,55 | 1,6371 | 0,0669 | |||
| AMZN / Amazon.com, Inc. | 0,03 | −0,45 | 6,97 | −0,37 | 1,3836 | −0,0489 | |||
| AAPL / Apple Inc. | 0,02 | −1,80 | 6,25 | 21,86 | 1,2405 | 0,1906 | |||
| GS / The Goldman Sachs Group, Inc. | 0,01 | −2,85 | 5,84 | 9,32 | 1,1599 | 0,0654 | |||
| INSM / Insmed Incorporated | 0,03 | 3,92 | 0,7774 | 0,7774 | |||||
| GLD / SPDR Gold Shares | 0,01 | 0,00 | 3,01 | 16,64 | 0,5969 | 0,0689 | |||
| SO / The Southern Company | 0,03 | 0,01 | 2,90 | 3,21 | 0,5748 | 0,0004 | |||
| GBTC / Grayscale Bitcoin Trust (BTC) | 0,03 | 0,00 | 2,78 | 5,83 | 0,5513 | 0,0139 | |||
| JNJ / Johnson & Johnson | 0,01 | 0,32 | 2,33 | 21,82 | 0,4633 | 0,0709 | |||
| TT / Trane Technologies plc | 0,01 | −3,53 | 2,31 | −6,94 | 0,4583 | −0,0497 | |||
| HON / Honeywell International Inc. | 0,01 | 0,29 | 2,20 | −9,33 | 0,4357 | −0,0601 | |||
| IVV / iShares Trust - iShares Core S&P 500 ETF | 0,00 | 3,41 | 1,93 | 11,52 | 0,3825 | 0,0286 | |||
| PFF / iShares Trust - iShares Preferred and Income Securities ETF | 0,06 | −0,16 | 1,86 | 2,87 | 0,3700 | −0,0009 | |||
| BK / The Bank of New York Mellon Corporation | 0,02 | 0,22 | 1,71 | 19,89 | 0,3388 | 0,0472 | |||
| WM / Waste Management, Inc. | 0,01 | 0,24 | 1,68 | −3,22 | 0,3337 | −0,0221 | |||
| META / Meta Platforms, Inc. | 0,00 | 4,76 | 1,62 | 4,19 | 0,3209 | 0,0033 | |||
| INTU / Intuit Inc. | 0,00 | −0,46 | 1,49 | −13,65 | 0,2952 | −0,0576 | |||
| ISRG / Intuitive Surgical, Inc. | 0,00 | 0,00 | 1,31 | −17,72 | 0,2610 | −0,0661 | |||
| ZBRA / Zebra Technologies Corporation | 0,00 | −0,69 | 1,29 | −4,25 | 0,2551 | −0,0199 | |||
| FMDE / Fidelity Covington Trust - Fidelity Enhanced Mid Cap ETF | 0,03 | 4,02 | 1,19 | 9,25 | 0,2369 | 0,0133 | |||
| AEM / Agnico Eagle Mines Limited | 0,01 | 0,00 | 1,18 | 41,71 | 0,2342 | 0,0638 | |||
| PLTR / Palantir Technologies Inc. | 0,01 | 0,00 | 1,18 | 33,79 | 0,2335 | 0,0535 | |||
| FTEC / Fidelity Covington Trust - Fidelity MSCI Information Technology Index ETF | 0,00 | 2,36 | 1,02 | 15,27 | 0,2024 | 0,0213 | |||
| VOO / Vanguard Index Funds - Vanguard S&P 500 ETF | 0,00 | −9,76 | 0,95 | −2,66 | 0,1888 | −0,0114 | |||
| COST / Costco Wholesale Corporation | 0,00 | 0,00 | 0,86 | −6,54 | 0,1705 | −0,0176 | |||
| FDX / FedEx Corporation | 0,00 | 0,00 | 0,83 | 3,62 | 0,1649 | 0,0009 | |||
| AGI / Alamos Gold Inc. | 0,02 | 0,00 | 0,80 | 31,25 | 0,1585 | 0,0339 | |||
| HD / The Home Depot, Inc. | 0,00 | 8,64 | 0,76 | 20,13 | 0,1517 | 0,0214 | |||
| NEM / Newmont Corporation | 0,01 | 0,00 | 0,76 | 44,66 | 0,1506 | 0,0433 | |||
| PFE / Pfizer Inc. | 0,03 | −10,66 | 0,75 | −6,04 | 0,1483 | −0,0146 | |||
| PEP / PepsiCo, Inc. | 0,01 | −7,03 | 0,74 | −1,07 | 0,1474 | −0,0064 | |||
| MRK / Merck & Co., Inc. | 0,01 | 0,00 | 0,72 | 6,06 | 0,1426 | 0,0039 | |||
| UNP / Union Pacific Corporation | 0,00 | 0,00 | 0,72 | 2,88 | 0,1419 | −0,0006 | |||
| NVDA / NVIDIA Corporation | 0,00 | 2,22 | 0,69 | 20,77 | 0,1363 | 0,0198 | |||
| XOM / Exxon Mobil Corporation | 0,01 | 0,00 | 0,64 | 4,56 | 0,1276 | 0,0018 | |||
| LLY / Eli Lilly and Company | 0,00 | −10,68 | 0,64 | −12,62 | 0,1266 | −0,0228 | |||
| FESM / Fidelity Covington Trust - Fidelity Enhanced Small Cap ETF | 0,02 | 4,98 | 0,62 | 20,04 | 0,1226 | 0,0172 | |||
| NVT / nVent Electric plc | 0,01 | 0,00 | 0,61 | 34,51 | 0,1216 | 0,0285 | |||
| CVX / Chevron Corporation | 0,00 | −3,68 | 0,61 | 4,47 | 0,1209 | 0,0015 | |||
| IJH / iShares Trust - iShares Core S&P Mid-Cap ETF | 0,01 | −2,28 | 0,60 | 2,74 | 0,1193 | −0,0004 | |||
| WMT / Walmart Inc. | 0,01 | 0,00 | 0,60 | 5,30 | 0,1185 | 0,0025 | |||
| DHR / Danaher Corporation | 0,00 | −23,44 | 0,58 | −23,22 | 0,1157 | −0,0396 | |||
| AMP / Ameriprise Financial, Inc. | 0,00 | 0,00 | 0,56 | −7,93 | 0,1107 | −0,0134 | |||
| MMC / Marsh & McLennan Companies, Inc. | 0,00 | −2,98 | 0,56 | −10,59 | 0,1106 | −0,0170 | |||
| ABT / Abbott Laboratories | 0,00 | 0,00 | 0,54 | −1,65 | 0,1063 | −0,0050 | |||
| XYL / Xylem Inc. | 0,00 | 0,00 | 0,53 | 14,07 | 0,1047 | 0,0100 | |||
| IJR / iShares Trust - iShares Core S&P Small-Cap ETF | 0,00 | 0,30 | 0,52 | 9,11 | 0,1024 | 0,0056 | |||
| ADP / Automatic Data Processing, Inc. | 0,00 | −9,61 | 0,50 | −14,01 | 0,0987 | −0,0197 | |||
| ETN / Eaton Corporation plc | 0,00 | −1,07 | 0,49 | 3,62 | 0,0966 | 0,0005 | |||
| FHLC / Fidelity Covington Trust - Fidelity MSCI Health Care Index ETF | 0,01 | 4,17 | 0,48 | 9,01 | 0,0962 | 0,0051 | |||
| FNCL / Fidelity Covington Trust - Fidelity MSCI Financials Index ETF | 0,01 | 3,31 | 0,48 | 6,42 | 0,0956 | 0,0030 | |||
| PG / The Procter & Gamble Company | 0,00 | 0,00 | 0,46 | −3,38 | 0,0909 | −0,0063 | |||
| BTC / Grayscale Bitcoin Mini Trust | 0,01 | 0,00 | 0,45 | 6,12 | 0,0896 | 0,0024 | |||
| CSCO / Cisco Systems, Inc. | 0,01 | 0,00 | 0,45 | −1,32 | 0,0894 | −0,0041 | |||
| FIDU / Fidelity Covington Trust - Fidelity MSCI Industrials Index ETF | 0,01 | 2,91 | 0,43 | 8,56 | 0,0857 | 0,0044 | |||
| PEG / Public Service Enterprise Group Incorporated | 0,01 | 0,00 | 0,43 | −0,93 | 0,0845 | −0,0034 | |||
| GOOG / Alphabet Inc. | 0,00 | 0,00 | 0,42 | 37,29 | 0,0828 | 0,0206 | |||
| MET / MetLife, Inc. | 0,01 | 0,00 | 0,41 | 2,48 | 0,0823 | −0,0006 | |||
| RTX / RTX Corporation | 0,00 | 0,00 | 0,40 | 14,45 | 0,0804 | 0,0080 | |||
| AVGO / Broadcom Inc. | 0,00 | 20,00 | 0,40 | 43,64 | 0,0786 | 0,0221 | |||
| NFLX / Netflix, Inc. | 0,00 | 0,00 | 0,36 | −10,47 | 0,0714 | −0,0109 | |||
| FDIS / Fidelity Covington Trust - Fidelity MSCI Consumer Discretionary Index ETF | 0,00 | 3,03 | 0,34 | 12,83 | 0,0681 | 0,0058 | |||
| BGH / Barings Global Short Duration High Yield Fund | 0,02 | 1,97 | 0,34 | 2,41 | 0,0675 | −0,0005 | |||
| AMGN / Amgen Inc. | 0,00 | 0,00 | 0,33 | 0,91 | 0,0664 | −0,0014 | |||
| PNC / The PNC Financial Services Group, Inc. | 0,00 | 0,00 | 0,30 | 7,83 | 0,0602 | 0,0026 | |||
| ABBV / AbbVie Inc. | 0,00 | 0,00 | 0,30 | 24,48 | 0,0597 | 0,0103 | |||
| TOWN / TowneBank | 0,01 | 0,30 | 0,0588 | 0,0588 | |||||
| SPY / SPDR S&P 500 ETF | 0,00 | 1,67 | 0,28 | 9,65 | 0,0565 | 0,0033 | |||
| COP / ConocoPhillips | 0,00 | −22,42 | 0,26 | −18,44 | 0,0520 | −0,0136 | |||
| DIS / The Walt Disney Company | 0,00 | −21,09 | 0,26 | −26,99 | 0,0510 | −0,0212 | |||
| ORCL / Oracle Corporation | 0,00 | −11,88 | 0,25 | 13,36 | 0,0488 | 0,0044 | |||
| USB / U.S. Bancorp | 0,01 | 0,00 | 0,24 | 6,64 | 0,0480 | 0,0016 | |||
| PGF / Invesco Exchange-Traded Fund Trust - Invesco Financial Preferred ETF | 0,02 | 0,00 | 0,24 | 3,51 | 0,0470 | 0,0002 | |||
| IBM / International Business Machines Corporation | 0,00 | 0,00 | 0,23 | −4,53 | 0,0462 | −0,0036 | |||
| FCOM / Fidelity Covington Trust - Fidelity MSCI Communication Services Index ETF | 0,00 | 2,37 | 0,23 | 12,44 | 0,0449 | 0,0036 | |||
| PFS / Provident Financial Services, Inc. | 0,01 | 0,23 | 0,0449 | 0,0449 | |||||
| BAC / Bank of America Corporation | 0,00 | 0,21 | 0,0417 | 0,0417 | |||||
| XLK / The Select Sector SPDR Trust - State Street Technology Select Sector SPDR ETF | 0,00 | −12,06 | 0,21 | −2,38 | 0,0408 | −0,0022 | |||
| VUZI / Vuzix Corporation | 0,02 | 0,00 | 0,07 | 5,97 | 0,0143 | 0,0005 | |||
| KO / The Coca-Cola Company | 0,00 | −100,00 | 0,00 | −100,00 | −0,0414 | ||||
| OPOF / Old Point Financial Corporation | 0,00 | −100,00 | 0,00 | 0,0000 | |||||
| LULU / lululemon athletica inc. | 0,00 | −100,00 | 0,00 | 0,0000 |