Grundläggande statistik
| Institutionella ägare | 183 total, 178 long only, 0 short only, 5 long/short - change of −7,96% MRQ |
| Genomsnittlig portföljallokering | 0.5301 % - change of −17,49% MRQ |
| Institutionella aktier (lång) | 14 967 454 (ex 13D/G) - change of −3,77MM shares −20,10% MRQ |
| Institutionellt värde (lång) | $ 921 713 USD ($1000) |
Institutionellt ägande och aktieägare
Vanguard World Fund - Vanguard Extended Duration Treasury ETF (US:EDV) har 183 Institutionella ägare och aktieägare som har lämnat in 13D/G- eller 13F-formulär till Securities Exchange Commission (SEC). Dessa institut innehar totalt 14,967,454 aktier. Största aktieägare inkluderar Mirae Asset Global Investments Co., Ltd., Bank Of America Corp /de/, Midland Wealth Advisors Llc, Morgan Stanley, LPL Financial LLC, Adviser Investments LLC, Hantz Financial Services, Inc., SBI Securities Co., Ltd., Harvest Portfolios Group Inc., and Income Research & Management .
Vanguard World Fund - Vanguard Extended Duration Treasury ETF (ARCA:EDV) Institutionell ägarstruktur visar institutioners och fonders nuvarande positioner i företaget, samt de senaste förändringarna i positionernas storlek. Större aktieägare kan vara enskilda investerare, fonder, hedgefonder eller institutioner. Bilaga 13D visar att investeraren äger (eller ägde) mer än 5% av företaget och avser (eller avsåg) att aktivt eftersträva en förändring av affärsstrategin. Schedule 13G indikerar en passiv investering på över 5%.
The share price as of September 8, 2025 is 68,71 / share. Previously, on September 9, 2024, the share price was 81,99 / share. This represents a decline of 16,20% over that period.

Fondsentimentets poäng
Fondsentimentet poängen(fka Ägarackumulation-poäng) visar vilka aktier som är mest köpta av fonder. Det är resultatet av en sofistikerad kvantitativ flerfaktormodell som identifierar företag med de högsta nivåerna av institutionell ackumulering. Poängsättningsmodellen använder en kombination av den totala ökningen av redovisade ägare, förändringarna i portföljallokeringarna för dessa ägare och andra mått. Siffran sträcker sig från 0 till 100, där högre siffror indikerar en högre nivå av ackumulering i förhållande till sina konkurrenter, och 50 är genomsnittet.
Uppdateringsfrekvens: Dagligen
Se Ownership Explorer, som innehåller en lista över de högst rankade företagen.
Institutionell sälj/köp-kvot
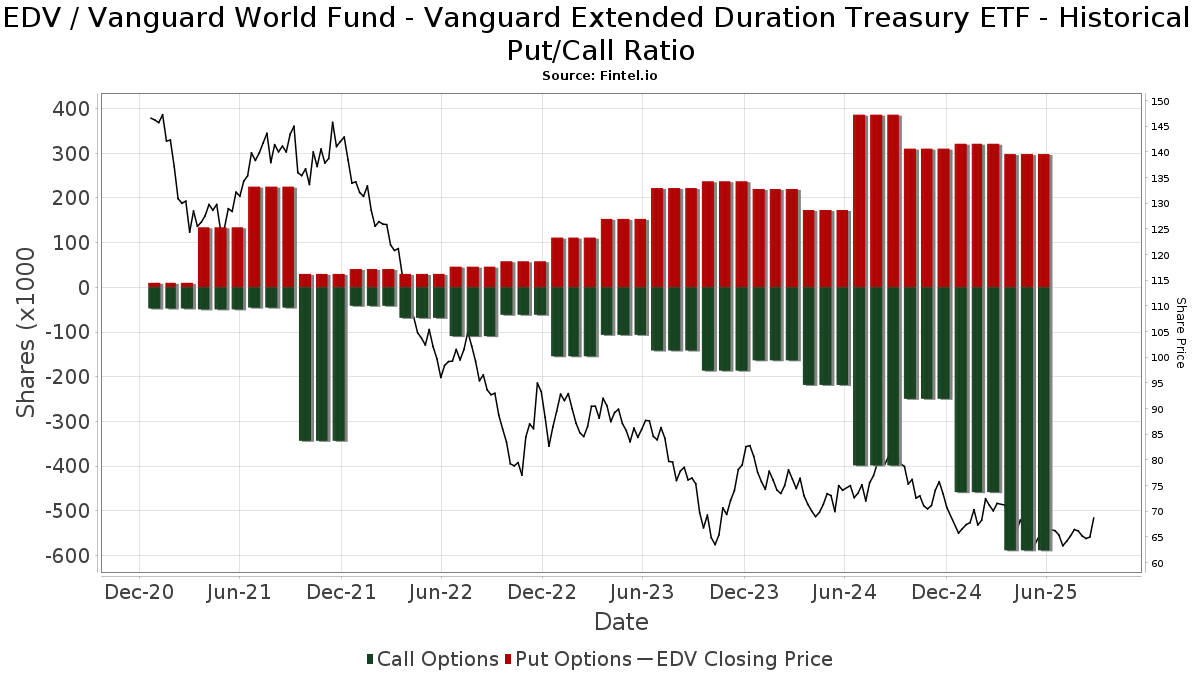
Förutom att rapportera vanliga eget kapital- och skuldemissioner måste institutioner med mer än 100MM tillgångar under förvaltning också avslöja sina innehav av sälj- och köpoptioner. Eftersom säljoptioner i allmänhet indikerar ett negativt sentiment och köpoptioner indikerar ett positivt sentiment, kan vi få en uppfattning om det övergripande institutionella sentimentet genom att plotta förhållandet mellan säljoptioner och köpoptioner. Diagrammet till höger visar det historiska förhållandet mellan sälj- och köpoptioner för detta instrument.
Genom att använda sälj/köp-kvoten som en indikator på aktieägarnas sentiment undviker man en av de största bristerna med att använda det totala institutionella ägandet, nämligen att en betydande del av de förvaltade tillgångarna investeras passivt för att följa index. Passivt förvaltade fonder köper vanligtvis inte optioner, så indikatorn för sälj/köp-kvoten ger en bättre bild av stämningen i aktivt förvaltade fonder.
13F- och NPORT-arkiveringar
Detaljer om 13F-arkiveringar är gratis. Detaljer om NP-arkiveringar kräver ett premiummedlemskap. Gröna rader indikerar nya positioner. Röda rader indikerar stängda positioner. Klicka på länk symbolen för att se hela transaktionshistoriken.
Uppgradera
för att låsa upp premiumdata och exportera till Excel ![]() .
.
| Fil Datum | Källa | Investerare | Typ | Genomsnittligt pris (beräknat) |
Aktier | Δ Aktier (%) |
Rapporterat värde (1000 USD) |
Δ Värde (%) |
Portföljallokering (%) |
|
|---|---|---|---|---|---|---|---|---|---|---|
| 2025-08-14 | 13F | CoreCap Advisors, LLC | 60 | 0,00 | 4 | 0,00 | ||||
| 2025-07-23 | 13F | H&H Retirement Design & Management INC | 182 739 | 12,54 | 11 719 | 11,93 | ||||
| 2025-08-07 | 13F | Flagship Wealth Advisors, Llc | 414 | 0,00 | 28 | −6,90 | ||||
| 2025-08-14 | 13F | Wiley Bros.-aintree Capital, Llc | 58 504 | 3,47 | 3 937 | −0,61 | ||||
| 2025-07-30 | 13F | Mid-American Wealth Advisory Group, Inc. | 8 | 1 | ||||||
| 2025-08-08 | 13F | Capital Investment Counsel, Inc | 3 500 | 236 | ||||||
| 2025-07-29 | 13F | Koshinski Asset Management, Inc. | 5 778 | 0,00 | 389 | −5,37 | ||||
| 2025-08-05 | 13F | Simplex Trading, Llc | 1 082 | −79,95 | 0 | |||||
| 2025-07-09 | 13F | Gilman Hill Asset Management, LLC | 3 600 | 2,42 | 242 | −2,81 | ||||
| 2025-08-12 | 13F | Laurel Wealth Advisors LLC | 539 | 6 637,50 | 0 | |||||
| 2025-08-12 | 13F | Change Path, LLC | 0 | −100,00 | 0 | |||||
| 2025-08-12 | 13F | Marshall & Sterling Wealth Advisors Inc. | 486 | 0,21 | 33 | −5,88 | ||||
| 2025-07-24 | 13F | Jfs Wealth Advisors, Llc | 385 | 26 | ||||||
| 2025-08-08 | 13F | Cedar Wealth Management, LLC | 132 | 9 | ||||||
| 2025-08-14 | 13F | Napa Wealth Management | 0 | −100,00 | 0 | |||||
| 2025-08-14 | 13F | Mariner, LLC | 97 506 | 74,83 | 6 562 | 65,50 | ||||
| 2025-08-13 | 13F | Jones Financial Companies Lllp | 19 431 | −2,77 | 1 287 | −8,14 | ||||
| 2025-05-05 | 13F | Lowery Thomas, Llc | 0 | −100,00 | 0 | |||||
| 2025-07-11 | 13F | Afg Fiduciary Services Limited Partnership | 4 800 | 320 | ||||||
| 2025-05-05 | 13F | Transce3nd, LLC | 0 | −100,00 | 0 | |||||
| 2025-08-15 | 13F | Kestra Advisory Services, LLC | 0 | −100,00 | 0 | |||||
| 2025-08-04 | 13F | Clear Investment Research, Llc | 85 798 | −11,89 | 5 774 | −16,61 | ||||
| 2025-08-08 | 13F | Atlanta Consulting Group Advisors, LLC | 4 981 | 335 | ||||||
| 2025-08-04 | 13F | Bristlecone Advisors, LLC | 0 | −100,00 | 0 | |||||
| 2025-08-13 | 13F | Kayne Anderson Rudnick Investment Management Llc | 0 | −100,00 | 0 | |||||
| 2025-07-11 | 13F | Seacrest Wealth Management, Llc | 0 | −100,00 | 0 | |||||
| 2025-08-07 | 13F | Evoke Wealth, Llc | 19 891 | −58,14 | 1 339 | −60,40 | ||||
| 2025-07-08 | 13F | Parallel Advisors, LLC | 31 | 2 | ||||||
| 2025-08-14 | 13F | Citadel Advisors Llc | Call | 3 900 | −30,36 | 262 | −34,17 | |||
| 2025-08-14 | 13F | Citadel Advisors Llc | Put | 10 100 | −83,55 | 680 | −84,45 | |||
| 2025-05-14 | 13F | Metropolitan Life Insurance Co/ny | 0 | −100,00 | 0 | |||||
| 2025-08-12 | 13F | LPL Financial LLC | 859 094 | 2,51 | 57 817 | −2,98 | ||||
| 2025-08-12 | 13F | Virtu Financial LLC | 0 | −100,00 | 0 | |||||
| 2025-08-14 | 13F | IHT Wealth Management, LLC | 34 096 | −31,44 | 2 295 | −35,12 | ||||
| 2025-09-04 | 13F/A | Advisor Group Holdings, Inc. | 80 411 | 45,75 | 5 412 | 37,93 | ||||
| 2025-07-23 | 13F | Clear Creek Financial Management, LLC | 52 274 | −0,54 | 3 518 | −5,86 | ||||
| 2025-08-06 | 13F | AE Wealth Management LLC | 17 315 | −3,75 | 1 165 | −8,91 | ||||
| 2025-07-09 | 13F | Dynamic Advisor Solutions LLC | 9 831 | −19,78 | 662 | −24,11 | ||||
| 2025-08-15 | 13F | North Ridge Wealth Advisors, Inc. | 141 363 | 5,77 | 9 514 | 0,11 | ||||
| 2025-07-28 | 13F | Harbour Investments, Inc. | 297 297 | 30,99 | 20 008 | 23,98 | ||||
| 2025-08-11 | 13F | Sykon Capital Llc | 0 | −100,00 | 0 | |||||
| 2025-08-14 | 13F | Raymond James Financial Inc | 230 071 | −2,06 | 15 484 | −7,32 | ||||
| 2025-08-01 | 13F | Belvedere Trading LLC | Put | 9 400 | 633 | |||||
| 2025-09-04 | 13F | Beacon Capital Management, Inc. | 358 | 24 | ||||||
| 2025-08-05 | 13F | Bank Of Montreal /can/ | 2 948 | 0,00 | 198 | −5,26 | ||||
| 2025-08-11 | 13F | Rothschild Investment Llc | 2 275 | 0,00 | 153 | −4,97 | ||||
| 2025-08-13 | 13F | Continuum Advisory, LLC | 0 | −100,00 | 0 | |||||
| 2025-07-10 | 13F | CWC Advisors, LLC. | 82 346 | 2,31 | 5 542 | −3,18 | ||||
| 2025-07-10 | 13F | Oliver Lagore Vanvalin Investment Group | 646 | −99,41 | 46 | −99,39 | ||||
| 2025-05-30 | NP | ERNZ - TrueShares Active Yield ETF | 77 457 | 3 753,58 | 5 508 | 3 949,26 | ||||
| 2025-07-11 | 13F | Bouvel Investment Partners, LLC | 0 | −100,00 | 0 | |||||
| 2025-05-08 | 13F | Savant Capital, LLC | 0 | −100,00 | 0 | |||||
| 2025-04-28 | 13F | Principal Financial Group Inc | 0 | −100,00 | 0 | |||||
| 2025-07-24 | 13F | Financial Connections Group, Inc. | 77 | 0,00 | 0 | |||||
| 2025-08-01 | 13F | Belvedere Trading LLC | 6 400 | 431 | ||||||
| 2025-08-07 | 13F | Fund Evaluation Group, LLC | 17 065 | 1 148 | ||||||
| 2025-05-16 | 13F | Coppell Advisory Solutions LLC | 0 | −100,00 | 0 | |||||
| 2025-07-11 | 13F | Farther Finance Advisors, LLC | 5 366 | −41,57 | 361 | −44,80 | ||||
| 2025-07-25 | 13F | NorthRock Partners, LLC | 188 | −18,26 | 13 | −25,00 | ||||
| 2025-08-11 | 13F | Pineridge Advisors LLC | 0 | −100,00 | 0 | |||||
| 2025-08-13 | 13F | Northern Trust Corp | 34 291 | 3,77 | 2 308 | −1,79 | ||||
| 2025-08-15 | 13F | Tower Research Capital LLC (TRC) | 0 | −100,00 | 0 | |||||
| 2025-08-13 | 13F | SageView Advisory Group, LLC | 10 165 | 1,22 | 651 | −8,82 | ||||
| 2025-08-29 | NP | GDMA - Gadsden Dynamic Multi-Asset ETF | 0 | −100,00 | 0 | −100,00 | ||||
| 2025-08-14 | 13F | Ieq Capital, Llc | 3 200 | 0,00 | 215 | −5,29 | ||||
| 2025-07-29 | 13F | Stanley-Laman Group, Ltd. | 0 | −100,00 | 0 | |||||
| 2025-08-12 | 13F | Steward Partners Investment Advisory, Llc | 4 580 | −4,08 | 308 | −9,14 | ||||
| 2025-08-14 | 13F | Citadel Advisors Llc | 0 | −100,00 | 0 | −100,00 | ||||
| 2025-08-14 | 13F | Fort Point Capital Partners LLC | 25 842 | −69,18 | 1 739 | −70,83 | ||||
| 2025-08-14 | 13F | Alliancebernstein L.p. | 245 797 | 1,10 | 16 542 | −4,31 | ||||
| 2025-08-05 | 13F | Tsfg, Llc | 27 | 0,00 | 0 | |||||
| 2025-08-14 | 13F/A | Skopos Labs, Inc. | 1 044 | 70 | ||||||
| 2025-04-22 | 13F | Tower View Investment Management & Research LLC | 0 | −100,00 | 0 | |||||
| 2025-07-29 | 13F | Birmingham Capital Management Co Inc/al | 55 250 | −30,94 | 3 718 | −34,63 | ||||
| 2025-08-14 | 13F | Capitolis Liquid Global Markets LLC | 0 | −100,00 | 0 | |||||
| 2025-07-30 | 13F | Nottingham Advisors, Inc. | 28 900 | 7,24 | 1 945 | 1,46 | ||||
| 2025-08-11 | 13F | TD Waterhouse Canada Inc. | 100 | 0,00 | 7 | −14,29 | ||||
| 2025-08-07 | 13F | PFG Advisors | 0 | −100,00 | 0 | |||||
| 2025-07-10 | 13F | Wealth Enhancement Advisory Services, Llc | 50 939 | −2,74 | 3 342 | −10,26 | ||||
| 2025-08-13 | 13F | Kilter Group LLC | 9 | 1 | ||||||
| 2025-07-09 | 13F | Fermata Advisors, LLC | 94 473 | 3,70 | 6 358 | −1,84 | ||||
| 2025-08-12 | 13F | O'shaughnessy Asset Management, Llc | 2 | 0,00 | 0 | |||||
| 2025-07-18 | 13F | Institute for Wealth Management, LLC. | 7 648 | 515 | ||||||
| 2025-08-14 | 13F | Tudor Investment Corp Et Al | 4 422 | −80,99 | 298 | −82,04 | ||||
| 2025-07-30 | 13F | Cullen/frost Bankers, Inc. | 1 991 | 134 | ||||||
| 2025-08-13 | 13F | Sepio Capital, LP | 3 286 | 0,77 | 221 | −4,33 | ||||
| 2025-08-08 | 13F | Gts Securities Llc | 4 314 | −92,29 | 290 | −92,71 | ||||
| 2025-07-16 | 13F | Freestate Advisors LLC | 3 424 | 230 | ||||||
| 2025-08-19 | 13F | Asset Dedication, LLC | 1 | 0 | ||||||
| 2025-05-01 | 13F | Rainey & Randall Investment Management Inc. | 0 | −100,00 | 0 | |||||
| 2025-07-29 | 13F | Beverly Hills Private Wealth, LLC | 46 832 | 19,39 | 3 152 | 12,98 | ||||
| 2025-08-14 | 13F | Mml Investors Services, Llc | 201 283 | −19,51 | 14 | −23,53 | ||||
| 2025-07-31 | 13F | Oppenheimer & Co Inc | 37 329 | 2 512 | ||||||
| 2025-08-11 | 13F | Empowered Funds, LLC | 0 | −100,00 | 0 | |||||
| 2025-04-10 | 13F | Fluent Financial, LLC | 0 | −100,00 | 0 | |||||
| 2025-05-09 | 13F | Headlands Technologies LLC | 0 | −100,00 | 0 | |||||
| 2025-07-17 | 13F | Janney Montgomery Scott LLC | 216 556 | 15 | ||||||
| 2025-08-14 | 13F | Quantinno Capital Management LP | 4 123 | 277 | ||||||
| 2025-08-14 | 13F | Ameriprise Financial Inc | 130 088 | −75,77 | 8 768 | −77,03 | ||||
| 2025-07-25 | 13F | Almanack Investment Partners, LLC. | 0 | −100,00 | 0 | |||||
| 2025-04-09 | 13F | Merit Financial Group, LLC | 0 | −100,00 | 0 | −100,00 | ||||
| 2025-08-14 | 13F | Wells Fargo & Company/mn | 182 055 | 83,21 | 12 252 | 73,39 | ||||
| 2025-08-01 | 13F | SwitchPoint Financial Planning, LLC | 3 475 | −0,03 | 234 | −5,67 | ||||
| 2025-04-30 | 13F | Allworth Financial LP | 0 | −100,00 | 0 | |||||
| 2025-05-14 | 13F | Caitlin John, LLC | 0 | −100,00 | 0 | |||||
| 2025-08-13 | 13F | BlackDiamond Wealth Management Inc. | 8 313 | 555 | ||||||
| 2025-08-07 | 13F | Midland Wealth Advisors Llc | 965 210 | 9,69 | 64 959 | 3,81 | ||||
| 2025-05-14 | 13F | Natixis | 0 | −100,00 | 0 | |||||
| 2025-08-01 | 13F | Envestnet Asset Management Inc | 53 321 | −8,69 | 3 588 | −13,58 | ||||
| 2025-07-09 | 13F | VisionPoint Advisory Group, LLC | 5 647 | −1,43 | 380 | −6,63 | ||||
| 2025-08-05 | 13F | Lord & Richards Wealth Management, LLC | 0 | −100,00 | 0 | |||||
| 2025-08-06 | 13F | Commonwealth Equity Services, Llc | 76 630 | 75,50 | 5 | 66,67 | ||||
| 2025-08-12 | 13F | Global Retirement Partners, LLC | 1 812 | −6,45 | 122 | −7,63 | ||||
| 2025-08-11 | 13F | Retirement Capital Strategies | 0 | −100,00 | 0 | |||||
| 2025-05-12 | 13F | Sandy Spring Bank | 141 | 464,00 | 10 | 900,00 | ||||
| 2025-07-24 | 13F | IFP Advisors, Inc | 6 238 | −0,64 | 420 | −6,05 | ||||
| 2025-05-12 | 13F | Owen LaRue, LLC | 0 | −100,00 | 0 | |||||
| 2025-08-12 | 13F | Ameritas Investment Partners, Inc. | 47 | 0,00 | 3 | 0,00 | ||||
| 2025-08-14 | 13F | Financial Engines Advisors L.L.C. | 20 931 | −14,69 | 1 409 | −19,26 | ||||
| 2025-08-12 | 13F | RiverFront Investment Group, LLC | 58 587 | 35,76 | 3 943 | 28,49 | ||||
| 2025-08-14 | 13F | Murphy & Mullick Capital Management Corp | 347 | 0,00 | 23 | −8,33 | ||||
| 2025-08-28 | NP | RQIAX - RESQ Strategic Income Fund Class A Shares | 47 100 | 0,00 | 3 170 | −5,37 | ||||
| 2025-08-08 | 13F | Meridian Wealth Management, LLC | 42 197 | 16,29 | 2 840 | 10,04 | ||||
| 2025-07-24 | 13F | Costello Asset Management, INC | 11 | 1 | ||||||
| 2025-07-08 | 13F | Ballew Advisors, Inc | 9 542 | −9,06 | 626 | −9,54 | ||||
| 2025-08-18 | 13F/A | National Bank Of Canada /fi/ | 73 072 | 623,99 | 4 918 | 585,77 | ||||
| 2025-07-25 | 13F | Cwm, Llc | 72 | 46,94 | 0 | |||||
| 2025-08-15 | 13F | Morgan Stanley | 945 635 | 5,64 | 63 641 | −0,02 | ||||
| 2025-08-14 | 13F | Bnp Paribas Arbitrage, Sa | 218 107 | 85,96 | 14 679 | 76,00 | ||||
| 2025-04-29 | NP | ATACX - ATAC Rotation Fund Investor Class Shares | 179 590 | 0,93 | 13 092 | 2,73 | ||||
| 2025-08-14 | 13F | Goldman Sachs Group Inc | 68 390 | 0,00 | 4 603 | −5,37 | ||||
| 2025-07-14 | 13F | Conrad Siegel Investment Advisors, Inc. | 108 628 | −10,56 | 7 311 | −15,35 | ||||
| 2025-07-24 | 13F | VanderPol Investments L.L.C. | 0 | −100,00 | 0 | |||||
| 2025-07-10 | 13F | Marshall Financial Group LLC | 93 266 | −2,44 | 6 020 | −11,43 | ||||
| 2025-07-16 | 13F | Maridea Wealth Management LLC | 6 377 | 1,11 | 429 | −4,24 | ||||
| 2025-07-21 | 13F | Andina Capital Management, LLC | 16 273 | −16,46 | 1 095 | −20,94 | ||||
| 2025-05-06 | 13F | Kovack Advisors, Inc. | 0 | −100,00 | 0 | |||||
| 2025-08-15 | 13F | Captrust Financial Advisors | 32 457 | −66,09 | 2 184 | −67,91 | ||||
| 2025-08-06 | 13F | Valtinson Bruner Financial Planning LLC | 294 107 | 8,90 | 19 793 | 3,07 | ||||
| 2025-05-01 | 13F | Quest 10 Wealth Builders, Inc. | 181 | 0,00 | 13 | 0,00 | ||||
| 2025-08-13 | 13F | Flow Traders U.s. Llc | 0 | −100,00 | 0 | |||||
| 2025-08-14 | 13F | Arizona PSPRS Trust | 0 | −100,00 | 0 | |||||
| 2025-07-08 | 13F | Range Financial Group LLC | 4 276 | −8,12 | 288 | −13,03 | ||||
| 2025-07-28 | 13F | Frazier Financial Advisors, LLC | 130 | 0,00 | 9 | −11,11 | ||||
| 2025-08-14 | 13F | Jane Street Group, Llc | 75 112 | 24,47 | 5 055 | 17,80 | ||||
| 2025-07-29 | 13F | TrueMark Investments, LLC | 0 | −100,00 | 0 | |||||
| 2025-07-25 | 13F | Atria Wealth Solutions, Inc. | 14 487 | −78,15 | 975 | −79,34 | ||||
| 2025-04-14 | 13F | IMC-Chicago, LLC | 0 | −100,00 | 0 | |||||
| 2025-07-29 | 13F | Private Trust Co Na | 6 450 | 0,00 | 434 | −5,24 | ||||
| 2025-07-31 | 13F | Whipplewood Advisors, LLC | 452 | 386,02 | 30 | −25,00 | ||||
| 2025-08-14 | 13F | Jane Street Group, Llc | Put | 22 600 | 3,20 | 1 521 | −2,38 | |||
| 2025-08-14 | 13F | Jane Street Group, Llc | Call | 194 600 | 191,32 | 13 097 | 175,71 | |||
| 2025-08-13 | 13F | Allium Financial Advisors, Llc | 6 169 | −28,54 | 415 | −32,30 | ||||
| 2025-08-06 | 13F | Harvest Portfolios Group Inc. | 540 320 | −5,10 | 36 364 | −10,18 | ||||
| 2025-07-23 | 13F | TriaGen Wealth Management LLC | 3 580 | 5,79 | 241 | 0,00 | ||||
| 2025-08-14 | 13F | Toroso Investments, LLC | 0 | −100,00 | 0 | |||||
| 2025-08-14 | 13F | Main Street Financial Solutions, LLC | 62 092 | 18,01 | 4 179 | 11,68 | ||||
| 2025-08-11 | 13F | HighTower Advisors, LLC | 69 325 | 11,87 | 4 666 | 5,88 | ||||
| 2025-07-17 | 13F | Income Research & Management | 403 862 | 27 180 | ||||||
| 2025-04-23 | 13F | Crewe Advisors LLC | 0 | −100,00 | 0 | |||||
| 2025-08-14 | 13F | Sig Brokerage, Lp | Call | 17 400 | 8,75 | 1 171 | 2,99 | |||
| 2025-08-04 | 13F | HBK Sorce Advisory LLC | 3 176 | 5,87 | 214 | 0,00 | ||||
| 2025-08-05 | 13F | Cassaday & Co Wealth Management LLC | 15 866 | 0,00 | 1 068 | −5,41 | ||||
| 2025-08-05 | 13F | Plante Moran Financial Advisors, LLC | 448 | 30 | ||||||
| 2025-08-14 | 13F | LaSalle St. Investment Advisors, LLC | 5 820 | 0,00 | 0 | |||||
| 2025-07-17 | 13F | Paradigm Financial Partners, Llc | 12 947 | 17,39 | 871 | 11,10 | ||||
| 2025-08-14 | 13F | Stifel Financial Corp | 10 192 | −47,94 | 686 | −50,79 | ||||
| 2025-07-29 | 13F | Quotient Wealth Partners, LLC | 0 | −100,00 | 0 | |||||
| 2025-08-13 | 13F | Northwestern Mutual Wealth Management Co | 3 438 | −17,67 | 231 | −21,96 | ||||
| 2025-07-10 | 13F | Sharkey, Howes & Javer | 31 633 | 39,06 | 2 129 | 31,60 | ||||
| 2025-08-11 | 13F | Principal Securities, Inc. | 9 | −89,53 | 1 | −100,00 | ||||
| 2025-07-21 | 13F | Mirae Asset Global Investments Co., Ltd. | 1 346 407 | 10,89 | 90 613 | 6,51 | ||||
| 2025-08-08 | 13F | Cetera Investment Advisers | 183 931 | 7,67 | 12 379 | 1,90 | ||||
| 2025-08-13 | 13F | Townsquare Capital Llc | 0 | −100,00 | 0 | |||||
| 2025-08-12 | 13F | MAI Capital Management | 44 | −95,79 | 3 | −97,30 | ||||
| 2025-08-04 | 13F | Hantz Financial Services, Inc. | 669 018 | −1,18 | 45 | −6,25 | ||||
| 2025-08-28 | 13F | China Universal Asset Management Co., Ltd. | 0 | −100,00 | 0 | |||||
| 2025-08-11 | 13F | Aptus Capital Advisors, LLC | 1 | 0,00 | 0 | |||||
| 2025-05-09 | 13F | GeoWealth Management, LLC | 0 | −100,00 | 0 | |||||
| 2025-07-17 | 13F | Johnson & White Wealth Management, LLC | 43 991 | −9,53 | 3 | −33,33 | ||||
| 2025-05-12 | 13F | Founders Financial Alliance, LLC | 0 | −100,00 | 0 | |||||
| 2025-07-28 | 13F | Eq Wealth Advisors, Llc | 0 | −100,00 | 0 | |||||
| 2025-07-14 | 13F | Park Avenue Securities Llc | 4 329 | 0 | ||||||
| 2025-08-08 | 13F | Creative Planning | 3 146 | 212 | ||||||
| 2025-08-12 | 13F | Gladstone Institutional Advisory LLC | 38 758 | −26,58 | 2 608 | −30,51 | ||||
| 2025-08-08 | 13F | Avantax Advisory Services, Inc. | 3 761 | −5,69 | 253 | −10,60 | ||||
| 2025-08-27 | 13F/A | Brinker Capital Investments, LLC | 17 414 | 10,43 | 1 172 | 4,46 | ||||
| 2025-08-07 | 13F | Guidance Capital, Inc | 0 | −100,00 | 0 | |||||
| 2025-04-29 | 13F | Td Private Client Wealth Llc | 0 | −100,00 | 0 | |||||
| 2025-07-15 | 13F | Cranbrook Wealth Management, LLC | 0 | −100,00 | 0 | |||||
| 2025-07-23 | 13F | Tectonic Advisors Llc | 60 026 | 8,73 | 4 040 | 2,90 | ||||
| 2025-08-14 | 13F/A | Forefront Analytics, LLC | 9 389 | 632 | ||||||
| 2025-07-18 | 13F | Clarity Financial LLC | 4 951 | 13,04 | 333 | 7,07 | ||||
| 2025-08-14 | 13F | Susquehanna International Group, Llp | Put | 218 300 | 8,07 | 14 692 | 2,28 | |||
| 2025-08-14 | 13F | Susquehanna International Group, Llp | 181 009 | 904,49 | 12 182 | 850,90 | ||||
| 2025-05-15 | 13F | Hrt Financial Lp | 0 | −100,00 | 0 | |||||
| 2025-08-12 | 13F | Boreal Capital Management LLC | 0 | 15 | ||||||
| 2025-08-13 | 13F | Johnson Financial Group, Inc. | 45 | −96,82 | 3 | −97,00 | ||||
| 2025-07-15 | 13F | Mather Group, Llc. | 0 | −100,00 | 0 | |||||
| 2025-08-19 | 13F | Advisory Services Network, LLC | 64 868 | 35,21 | 4 238 | 24,25 | ||||
| 2025-08-12 | 13F | Proequities, Inc. | 0 | 0 | ||||||
| 2025-07-11 | 13F | Deane Retirement Strategies, Inc. | 0 | −100,00 | 0 | |||||
| 2025-08-01 | 13F | Bessemer Group Inc | 25 | 0,00 | 0 | |||||
| 2025-08-06 | 13F | Stokes Family Office, LLC | 10 000 | 673 | ||||||
| 2025-08-14 | 13F | Susquehanna International Group, Llp | Call | 218 200 | −8,74 | 14 685 | −13,63 | |||
| 2025-07-29 | 13F | Commons Capital, Llc | 3 166 | −4,41 | 213 | −9,36 | ||||
| 2025-07-17 | 13F | Beacon Capital Management, LLC | 9 | 0,00 | 1 | |||||
| 2025-08-14 | 13F | Two Sigma Securities, Llc | 0 | −100,00 | 0 | |||||
| 2025-05-02 | 13F | Altman Advisors, Inc. | 0 | −100,00 | 0 | |||||
| 2025-08-06 | 13F | Atlantic Union Bankshares Corp | 57 | 4 | ||||||
| 2025-07-16 | 13F | Leading Edge Financial Planning LLC | 7 469 | 12,57 | 503 | 6,58 | ||||
| 2025-08-14 | 13F | UBS Group AG | 110 415 | −30,05 | 7 431 | −33,80 | ||||
| 2025-07-24 | 13F | Us Bancorp \de\ | 0 | −100,00 | 0 | |||||
| 2025-07-31 | 13F | Briaud Financial Planning, Inc | 1 176 | 0,00 | 0 | |||||
| 2025-08-06 | 13F | Decker Retirement Planning Inc. | 19 158 | 12 587,42 | 1 289 | 12 790,00 | ||||
| 2025-07-28 | 13F | Mowery & Schoenfeld Wealth Management, LLC | 0 | −100,00 | 0 | |||||
| 2025-08-12 | 13F | Nemes Rush Group LLC | 0 | −100,00 | 0 | |||||
| 2025-08-04 | 13F | Haven Private, LLC | 3 900 | −83,53 | 262 | −84,43 | ||||
| 2025-08-11 | 13F | Synergy Investment Management, LLC | 0 | −100,00 | 0 | |||||
| 2025-08-14 | 13F | Toronto Dominion Bank | Call | 139 400 | 19,86 | 9 382 | 13,43 | |||
| 2025-07-31 | 13F | Cambridge Investment Research Advisors, Inc. | 49 199 | −0,56 | 3 | 0,00 | ||||
| 2025-08-14 | 13F | Scientech Research LLC | 0 | −100,00 | 0 | |||||
| 2025-04-17 | 13F | Cyndeo Wealth Partners, LLC | 0 | −100,00 | 0 | |||||
| 2025-07-18 | 13F | Truist Financial Corp | 3 331 | 224 | ||||||
| 2025-08-14 | 13F | Colony Group, LLC | 7 427 | 0,00 | 500 | −5,49 | ||||
| 2025-08-18 | 13F | Wolverine Trading, Llc | Put | 38 400 | 7,56 | 2 543 | 1,68 | |||
| 2025-08-18 | 13F | Wolverine Trading, Llc | Call | 14 700 | −2,00 | 974 | −7,42 | |||
| 2025-08-18 | 13F | Wolverine Trading, Llc | 69 541 | 282,24 | 4 606 | 261,46 | ||||
| 2025-07-08 | 13F | Legacy Private Trust Co. | 166 274 | 10,75 | 11 190 | 4,81 | ||||
| 2025-07-25 | 13F | RHS Financial, LLC | 0 | −100,00 | 0 | |||||
| 2025-07-11 | 13F | SILVER OAK SECURITIES, Inc | 16 | 0,00 | 1 | 0,00 | ||||
| 2025-08-12 | 13F | BlackRock, Inc. | 17 055 | 146,42 | 1 148 | 133,13 | ||||
| 2025-08-12 | 13F | Jpmorgan Chase & Co | 170 464 | −93,97 | 11 472 | −94,30 | ||||
| 2025-08-13 | 13F | Russell Investments Group, Ltd. | 0 | −100,00 | 0 | |||||
| 2025-08-14 | 13F | Fmr Llc | 21 | −76,67 | 1 | −83,33 | ||||
| 2025-05-15 | 13F/A | Orion Portfolio Solutions, LLC | 15 769 | 7,69 | 1 121 | 13,12 | ||||
| 2025-07-28 | 13F | BRYN MAWR TRUST Co | 0 | −100,00 | 0 | |||||
| 2025-07-29 | 13F | Regions Financial Corp | 44 267 | 0,00 | 2 979 | −5,34 | ||||
| 2025-08-14 | 13F | Comerica Bank | 9 545 | −0,52 | 642 | −5,87 | ||||
| 2025-07-21 | 13F | Ameritas Advisory Services, LLC | 3 380 | −9,79 | 227 | −11,67 | ||||
| 2025-08-05 | 13F | Huntington National Bank | 0 | |||||||
| 2025-08-14 | 13F | Royal Bank Of Canada | 212 297 | 1,03 | 14 287 | −4,38 | ||||
| 2025-04-23 | 13F | Creative Financial Designs Inc /adv | 0 | 0 | ||||||
| 2025-08-14 | 13F | Boyer & Corporon Wealth Management, LLC | 10 163 | −43,21 | 684 | −46,23 | ||||
| 2025-08-14 | 13F | Bank Of America Corp /de/ | 1 263 638 | 12,07 | 85 043 | 6,07 | ||||
| 2025-08-14 | 13F | Fwl Investment Management, Llc | 3 305 | −15,58 | 222 | −20,14 | ||||
| 2025-08-08 | 13F | Pnc Financial Services Group, Inc. | 121 607 | −2,58 | 8 184 | −7,80 | ||||
| 2025-04-15 | 13F | Noble Wealth Management PBC | 80 | 0,00 | 6 | 0,00 | ||||
| 2025-07-30 | 13F | Paragon Advisors, LLC | 14 488 | −35,95 | 975 | −39,37 | ||||
| 2025-07-21 | 13F | Pflug Koory, LLC | 336 | 0,00 | 23 | −4,35 | ||||
| 2025-08-14 | 13F | Federation des caisses Desjardins du Quebec | 1 050 | 0,00 | 71 | −5,41 | ||||
| 2025-05-06 | 13F | Morling Financial Advisors, LLC | 0 | −100,00 | 0 | |||||
| 2025-08-12 | 13F | Howe & Rusling Inc | 200 | 0,00 | 13 | −7,14 | ||||
| 2025-07-17 | 13F | Sound Income Strategies, LLC | 37 | −43,94 | 3 | −50,00 | ||||
| 2025-07-14 | 13F | Sellwood Investment Partners LLC | 118 796 | 7,22 | 7 677 | −2,56 | ||||
| 2025-08-14 | 13F | Smartleaf Asset Management LLC | 7 | −95,51 | 0 | −100,00 | ||||
| 2025-07-15 | 13F | Fifth Third Bancorp | 15 | 0,00 | 1 | 0,00 | ||||
| 2025-07-22 | 13F | Accel Wealth Management | 14 963 | −1,38 | 1 007 | −6,68 | ||||
| 2025-07-29 | 13F | Gladwyn Financial Advisors, Inc. | 1 169 | 79 | ||||||
| 2025-07-29 | 13F | Oxbow Advisors, LLC | 0 | −100,00 | 0 | |||||
| 2025-05-07 | 13F | Drive Wealth Management, Llc | 0 | −100,00 | 0 | |||||
| 2025-08-08 | 13F | SBI Securities Co., Ltd. | 605 851 | 2,96 | 40 774 | −2,56 | ||||
| 2025-04-23 | 13F | Valmark Advisers, Inc. | 0 | −100,00 | 0 | −100,00 | ||||
| 2025-07-24 | 13F | E Fund Management (Hong Kong) Co., Ltd. | 0 | −100,00 | 0 | |||||
| 2025-07-24 | 13F | Eastern Bank | 500 | 0,00 | 34 | −5,71 | ||||
| 2025-08-06 | 13F | Adviser Investments LLC | 846 098 | −3,22 | 56 942 | −8,40 | ||||
| 2025-08-15 | 13F | E Fund Management Co., Ltd. | 0 | −100,00 | 0 | |||||
| 2025-08-14 | 13F | Group One Trading, L.p. | 100 | −80,00 | 7 | −82,86 |
Other Listings
| MX:EDV |