Grundläggande statistik
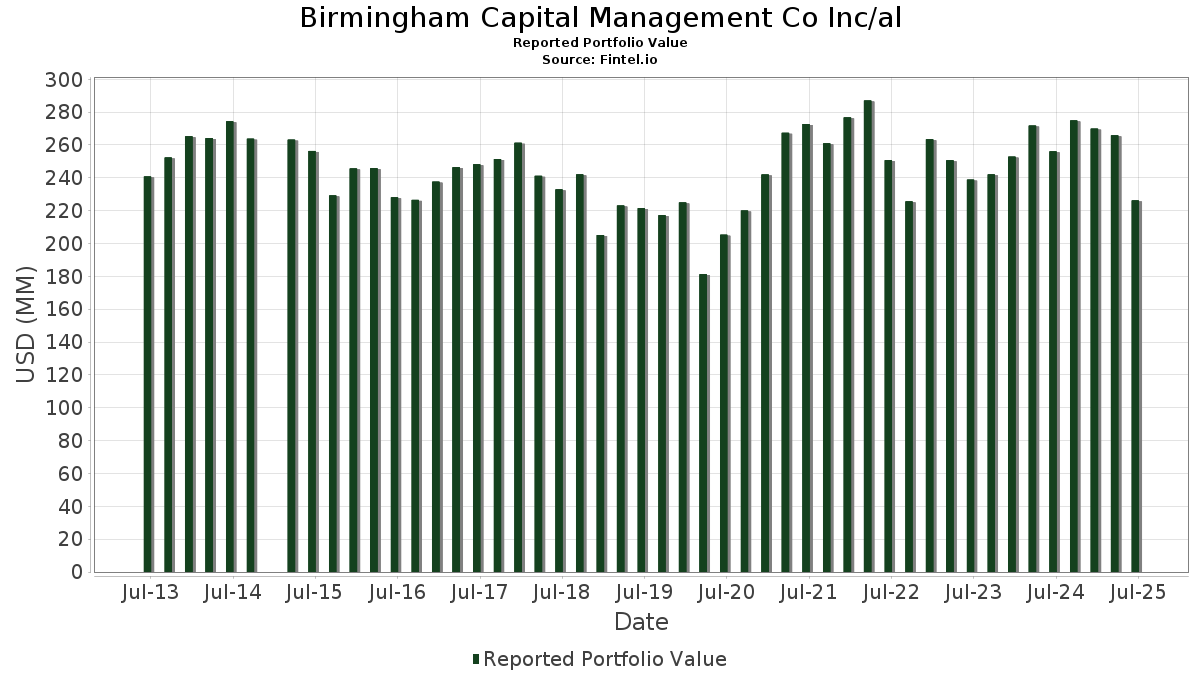
| Portföljvärde | $ 226 197 944 |
| Aktuella positioner | 99 |
Senaste innehav, resultat, förvaltat kapital (från 13F, 13D)
Birmingham Capital Management Co Inc/al har redovisat 99 totala innehav i sina senaste SEC-arkiveringar. Det senaste portföljvärdet beräknas vara $ 226 197 944 USD. Faktiskt förvaltade tillgångar (AUM) är detta värde plus likvida medel (som inte redovisas). Birmingham Capital Management Co Inc/als största innehav är Deere & Company (US:DE) , Caterpillar Inc. (US:CAT) , The Allstate Corporation (US:ALL) , McDonald's Corporation (US:MCD) , and Eli Lilly and Company (US:LLY) .
Största ökningarna detta kvartal
Vi använder förändringen i portföljallokeringen eftersom det är det mest meningsfulla måttet. Förändringar kan bero på transaktioner eller förändringar i aktiekurser.
| Värdepapper | Aktier (MM) |
Värde (MM$) |
Portfölj % av | ΔPortfölj % av |
|---|---|---|---|---|
| 0,04 | 15,52 | 6,8615 | 1,7096 | |
| 0,03 | 16,43 | 7,2632 | 1,4321 | |
| 0,05 | 7,20 | 3,1815 | 0,6336 | |
| 0,06 | 7,53 | 3,3289 | 0,5554 | |
| 0,01 | 6,07 | 2,6853 | 0,4704 | |
| 0,02 | 2,88 | 1,2747 | 0,3777 | |
| 0,01 | 4,37 | 1,9319 | 0,3768 | |
| 0,01 | 2,54 | 1,1238 | 0,3613 | |
| 0,01 | 4,81 | 2,1283 | 0,3525 | |
| 0,00 | 2,96 | 1,3088 | 0,3009 |
Största minskningarna detta kvartal
Vi använder förändringen i portföljallokeringen eftersom det är det mest meningsfulla måttet. Förändringar kan bero på transaktioner eller förändringar i aktiepriser.
| Värdepapper | Aktier (MM) |
Värde (MM$) |
Portfölj % av | ΔPortfölj % av |
|---|---|---|---|---|
| 0,04 | 5,63 | 2,4887 | −0,5227 | |
| 0,06 | 3,72 | 1,6438 | −0,4963 | |
| 0,01 | 0,64 | 0,2836 | −0,4516 | |
| 0,03 | 2,22 | 0,9809 | −0,4336 | |
| 0,04 | 4,38 | 1,9360 | −0,3666 | |
| 0,02 | 1,31 | 0,5796 | −0,3155 | |
| 0,02 | 1,10 | 0,4880 | −0,3151 | |
| 0,02 | 3,49 | 1,5444 | −0,3142 | |
| 0,00 | 1,34 | 0,5915 | −0,3004 | |
| 0,03 | 4,79 | 2,1163 | −0,2914 |
13F- och fond arkiveringar
Denna blankett lämnades in den 2025-07-29 för rapporteringsperioden 2025-06-30. Klicka på länksymbolen för att se hela transaktionshistoriken.
Uppgradera för att låsa upp premiumdata och exportera till Excel![]() .
.
| Värdepapper | Typ | Genomsnittligt aktiepris | Aktier (MM) |
ΔAktier (%) |
ΔAktier (%) |
Värde ($MM) |
Portfölj (%) |
ΔPortfölj (%) |
|
|---|---|---|---|---|---|---|---|---|---|
| DE / Deere & Company | 0,03 | −2,17 | 16,43 | 5,99 | 7,2632 | 1,4321 | |||
| CAT / Caterpillar Inc. | 0,04 | −3,72 | 15,52 | 13,33 | 6,8615 | 1,7096 | |||
| ALL / The Allstate Corporation | 0,05 | −7,81 | 9,47 | −10,38 | 4,1878 | 0,2115 | |||
| MCD / McDonald's Corporation | 0,03 | −10,36 | 9,31 | −16,16 | 4,1162 | −0,0615 | |||
| LLY / Eli Lilly and Company | 0,01 | −7,15 | 8,05 | −12,36 | 3,5600 | 0,1034 | |||
| EMR / Emerson Electric Co. | 0,06 | −16,01 | 7,53 | 2,13 | 3,3289 | 0,5554 | |||
| RTX / RTX Corporation | 0,05 | −3,61 | 7,20 | 6,26 | 3,1815 | 0,6336 | |||
| IBM / International Business Machines Corporation | 0,02 | −27,33 | 6,19 | −13,85 | 2,7385 | 0,0334 | |||
| LMT / Lockheed Martin Corporation | 0,01 | −0,49 | 6,07 | 3,18 | 2,6853 | 0,4704 | |||
| PG / The Procter & Gamble Company | 0,04 | −14,68 | 5,86 | −20,24 | 2,5913 | −0,1733 | |||
| CVX / Chevron Corporation | 0,04 | −17,84 | 5,63 | −29,67 | 2,4887 | −0,5227 | |||
| JNJ / Johnson & Johnson | 0,03 | −18,13 | 4,85 | −24,59 | 2,1439 | −0,2753 | |||
| CMI / Cummins Inc. | 0,01 | −2,39 | 4,81 | 1,99 | 2,1283 | 0,3525 | |||
| ABBV / AbbVie Inc. | 0,03 | −15,57 | 4,79 | −25,20 | 2,1163 | −0,2914 | |||
| MMM / 3M Company | 0,03 | −17,98 | 4,74 | −14,97 | 2,0965 | −0,0016 | |||
| KO / The Coca-Cola Company | 0,06 | −15,77 | 4,40 | −16,78 | 1,9467 | −0,0441 | |||
| XOM / Exxon Mobil Corporation | 0,04 | −21,07 | 4,38 | −28,45 | 1,9360 | −0,3666 | |||
| AXP / American Express Company | 0,01 | −10,84 | 4,37 | 5,73 | 1,9319 | 0,3768 | |||
| SPBO / SPDR Series Trust - SPDR Portfolio Corporate Bond ETF | 0,15 | −21,54 | 4,31 | −21,04 | 1,9054 | −0,1477 | |||
| HSY / The Hershey Company | 0,02 | −7,20 | 3,95 | −9,94 | 1,7468 | 0,0961 | |||
| SCHQ / Schwab Strategic Trust - Schwab Long-Term U.S. Treasury ETF | 0,12 | −19,22 | 3,81 | −21,37 | 1,6854 | −0,1385 | |||
| EDV / Vanguard World Fund - Vanguard Extended Duration Treasury ETF | 0,06 | −30,94 | 3,72 | −34,63 | 1,6438 | −0,4963 | |||
| SO / The Southern Company | 0,04 | −17,66 | 3,51 | −17,76 | 1,5518 | −0,0541 | |||
| AAPL / Apple Inc. | 0,02 | −23,45 | 3,49 | −29,29 | 1,5444 | −0,3142 | |||
| PFE / Pfizer Inc. | 0,13 | −18,99 | 3,21 | −22,51 | 1,4172 | −0,1389 | |||
| ABT / Abbott Laboratories | 0,02 | −7,62 | 3,05 | −5,28 | 1,3487 | 0,1371 | |||
| IVV / iShares Trust - iShares Core S&P 500 ETF | 0,00 | 0,00 | 2,96 | 10,49 | 1,3088 | 0,3009 | |||
| NVDA / NVIDIA Corporation | 0,02 | −17,05 | 2,88 | 20,93 | 1,2747 | 0,3777 | |||
| DUK / Duke Energy Corporation | 0,02 | −19,16 | 2,61 | −21,79 | 1,1536 | −0,1015 | |||
| GE / General Electric Company | 0,01 | −2,47 | 2,54 | 25,42 | 1,1238 | 0,3613 | |||
| FDX / FedEx Corporation | 0,01 | −12,29 | 2,35 | −18,22 | 1,0401 | −0,0421 | |||
| JPM / JPMorgan Chase & Co. | 0,01 | −30,97 | 2,24 | −18,41 | 0,9914 | −0,0426 | |||
| MRK / Merck & Co., Inc. | 0,03 | −33,09 | 2,22 | −41,01 | 0,9809 | −0,4336 | |||
| DG / Dollar General Corporation | 0,02 | −48,66 | 2,10 | −33,21 | 0,9276 | −0,2543 | |||
| BAC / Bank of America Corporation | 0,04 | −21,75 | 1,94 | −11,27 | 0,8561 | 0,0351 | |||
| COST / Costco Wholesale Corporation | 0,00 | 0,00 | 1,91 | 4,66 | 0,8447 | 0,1580 | |||
| SCHO / Schwab Strategic Trust - Schwab Short-Term U.S. Treasury ETF | 0,07 | −29,13 | 1,78 | −29,04 | 0,7868 | −0,1563 | |||
| BMY / Bristol-Myers Squibb Company | 0,04 | −15,22 | 1,68 | −35,64 | 0,7441 | −0,2400 | |||
| BA / The Boeing Company | 0,01 | −1,24 | 1,52 | 21,31 | 0,6721 | 0,2007 | |||
| INTC / Intel Corporation | 0,06 | −3,15 | 1,43 | −4,47 | 0,6327 | 0,0691 | |||
| GWW / W.W. Grainger, Inc. | 0,00 | −46,42 | 1,34 | −43,57 | 0,5915 | −0,3004 | |||
| MET / MetLife, Inc. | 0,02 | −44,99 | 1,31 | −44,89 | 0,5796 | −0,3155 | |||
| TXN / Texas Instruments Incorporated | 0,01 | −40,23 | 1,30 | −30,98 | 0,5755 | −0,1336 | |||
| C / Citigroup Inc. | 0,01 | −24,35 | 1,26 | −9,29 | 0,5569 | 0,0344 | |||
| DD / DuPont de Nemours, Inc. | 0,02 | −43,71 | 1,10 | −48,31 | 0,4880 | −0,3151 | |||
| GEV / GE Vernova Inc. | 0,00 | −2,90 | 1,10 | 68,56 | 0,4859 | 0,2402 | |||
| LNC / Lincoln National Corporation | 0,03 | 0,00 | 1,09 | −3,62 | 0,4834 | 0,0565 | |||
| CAH / Cardinal Health, Inc. | 0,01 | 0,00 | 1,09 | 22,01 | 0,4828 | 0,1459 | |||
| SLB / Schlumberger Limited | 0,03 | −12,76 | 1,09 | −29,48 | 0,4826 | −0,0996 | |||
| JCI / Johnson Controls International plc | 0,01 | −2,88 | 1,07 | 28,09 | 0,4719 | 0,1583 | |||
| SCHW / The Charles Schwab Corporation | 0,01 | −29,24 | 1,04 | −17,57 | 0,4588 | −0,0146 | |||
| HAL / Halliburton Company | 0,05 | −30,48 | 1,01 | −44,14 | 0,4470 | −0,2341 | |||
| ITA / iShares Trust - iShares U.S. Aerospace & Defense ETF | 0,01 | 0,00 | 0,96 | 23,32 | 0,4232 | 0,1309 | |||
| KHC / The Kraft Heinz Company | 0,04 | −38,89 | 0,93 | −48,15 | 0,4092 | −0,2623 | |||
| ITW / Illinois Tool Works Inc. | 0,00 | −1,98 | 0,92 | −2,35 | 0,4052 | 0,0523 | |||
| MSFT / Microsoft Corporation | 0,00 | −44,89 | 0,91 | −26,97 | 0,4011 | −0,0663 | |||
| KMI / Kinder Morgan, Inc. | 0,03 | −41,00 | 0,90 | −39,25 | 0,4000 | −0,1598 | |||
| CLX / The Clorox Company | 0,01 | −10,82 | 0,79 | −27,30 | 0,3499 | −0,0596 | |||
| HD / The Home Depot, Inc. | 0,00 | −20,57 | 0,76 | −20,58 | 0,3380 | −0,0240 | |||
| CSCO / Cisco Systems, Inc. | 0,01 | −49,07 | 0,76 | −42,76 | 0,3359 | −0,1632 | |||
| GT / The Goodyear Tire & Rubber Company | 0,07 | −1,69 | 0,72 | 10,37 | 0,3203 | 0,0733 | |||
| ROK / Rockwell Automation, Inc. | 0,00 | 0,00 | 0,70 | 28,60 | 0,3084 | 0,1043 | |||
| BKR / Baker Hughes Company | 0,02 | 0,00 | 0,67 | −12,87 | 0,2966 | 0,0073 | |||
| WMT / Walmart Inc. | 0,01 | −70,53 | 0,64 | −67,20 | 0,2836 | −0,4516 | |||
| VZ / Verizon Communications Inc. | 0,01 | −42,93 | 0,63 | −45,56 | 0,2791 | −0,1571 | |||
| WY / Weyerhaeuser Company | 0,02 | −38,46 | 0,63 | −46,05 | 0,2780 | −0,1601 | |||
| DIS / The Walt Disney Company | 0,01 | −34,13 | 0,62 | −17,26 | 0,2758 | −0,0078 | |||
| LOW / Lowe's Companies, Inc. | 0,00 | −29,68 | 0,59 | −33,14 | 0,2614 | −0,0711 | |||
| MSI / Motorola Solutions, Inc. | 0,00 | 0,00 | 0,59 | −3,93 | 0,2597 | 0,0296 | |||
| GL / Globe Life Inc. | 0,00 | 0,00 | 0,55 | −5,70 | 0,2418 | 0,0237 | |||
| RSP / Invesco Exchange-Traded Fund Trust - Invesco S&P 500 Equal Weight ETF | 0,00 | 0,00 | 0,55 | 5,01 | 0,2410 | 0,0455 | |||
| MO / Altria Group, Inc. | 0,01 | 0,00 | 0,49 | −2,20 | 0,2168 | 0,0279 | |||
| WHR / Whirlpool Corporation | 0,00 | 0,00 | 0,49 | 12,67 | 0,2163 | 0,0527 | |||
| EBAY / eBay Inc. | 0,01 | 0,00 | 0,48 | 9,77 | 0,2140 | 0,0483 | |||
| DAL / Delta Air Lines, Inc. | 0,01 | 0,00 | 0,48 | 12,65 | 0,2131 | 0,0523 | |||
| CCL / Carnival Corporation & plc | 0,02 | 0,00 | 0,47 | 43,83 | 0,2064 | 0,0844 | |||
| T / AT&T Inc. | 0,02 | −36,19 | 0,45 | −34,74 | 0,1978 | −0,0600 | |||
| CTVA / Corteva, Inc. | 0,01 | −11,18 | 0,44 | 5,04 | 0,1940 | 0,0371 | |||
| PYPL / PayPal Holdings, Inc. | 0,01 | 0,00 | 0,43 | 13,91 | 0,1922 | 0,0486 | |||
| PEP / PepsiCo, Inc. | 0,00 | 0,00 | 0,42 | −11,97 | 0,1854 | 0,0062 | |||
| ED / Consolidated Edison, Inc. | 0,00 | −16,67 | 0,41 | −24,45 | 0,1819 | −0,0228 | |||
| PCAR / PACCAR Inc | 0,00 | 0,00 | 0,40 | −2,47 | 0,1749 | 0,0225 | |||
| BP / BP p.l.c. - Depositary Receipt (Common Stock) | 0,01 | −30,70 | 0,38 | −38,66 | 0,1700 | −0,0657 | |||
| PSX / Phillips 66 | 0,00 | −52,80 | 0,38 | −54,46 | 0,1673 | −0,1450 | |||
| VMC / Vulcan Materials Company | 0,00 | 0,00 | 0,37 | 11,75 | 0,1642 | 0,0392 | |||
| ENB / Enbridge Inc. | 0,01 | −19,76 | 0,37 | −17,98 | 0,1617 | −0,0060 | |||
| COP / ConocoPhillips | 0,00 | −26,88 | 0,35 | −37,52 | 0,1540 | −0,0557 | |||
| TFC / Truist Financial Corporation | 0,01 | −4,33 | 0,32 | 0,00 | 0,1406 | 0,0209 | |||
| LHX / L3Harris Technologies, Inc. | 0,00 | −5,91 | 0,30 | 12,83 | 0,1323 | 0,0325 | |||
| GLW / Corning Incorporated | 0,01 | 0,00 | 0,30 | 15,12 | 0,1314 | 0,0341 | |||
| IWM / iShares Trust - iShares Russell 2000 ETF | 0,00 | 0,00 | 0,27 | 8,10 | 0,1183 | 0,0252 | |||
| A / Agilent Technologies, Inc. | 0,00 | −31,54 | 0,26 | −31,05 | 0,1161 | −0,0269 | |||
| BAX / Baxter International Inc. | 0,01 | −4,49 | 0,26 | −15,46 | 0,1138 | −0,0008 | |||
| DOW / Dow Inc. | 0,01 | 0,00 | 0,24 | −24,20 | 0,1054 | −0,0129 | |||
| GIS / General Mills, Inc. | 0,00 | −67,90 | 0,23 | −72,19 | 0,1017 | −0,2094 | |||
| FLR / Fluor Corporation | 0,00 | 0,22 | 0,0958 | 0,0958 | |||||
| BSX / Boston Scientific Corporation | 0,00 | 0,00 | 0,21 | 6,47 | 0,0950 | 0,0191 | |||
| NOC / Northrop Grumman Corporation | 0,00 | 0,00 | 0,21 | −2,30 | 0,0939 | 0,0121 | |||
| CLF / Cleveland-Cliffs Inc. | 0,01 | 0,00 | 0,11 | −7,38 | 0,0500 | 0,0040 | |||
| SHEL / Shell plc - Depositary Receipt (Common Stock) | 0,00 | −100,00 | 0,00 | 0,0000 | |||||
| PARAA / Paramount Global | 0,00 | −100,00 | 0,00 | 0,0000 | |||||
| CL / Colgate-Palmolive Company | 0,00 | −100,00 | 0,00 | 0,0000 | |||||
| FI / Fiserv, Inc. | 0,00 | −100,00 | 0,00 | 0,0000 | |||||
| PNW / Pinnacle West Capital Corporation | 0,00 | −100,00 | 0,00 | 0,0000 | |||||
| NEM / Newmont Corporation | 0,00 | −100,00 | 0,00 | 0,0000 | |||||
| OKE / ONEOK, Inc. | 0,00 | −100,00 | 0,00 | 0,0000 | |||||
| AEP / American Electric Power Company, Inc. | 0,00 | −100,00 | 0,00 | 0,0000 | |||||
| WPM / Wheaton Precious Metals Corp. | 0,00 | −100,00 | 0,00 | 0,0000 | |||||
| GOLD / Barrick Mining Corporation | 0,00 | −100,00 | 0,00 | 0,0000 | |||||
| GLD / SPDR Gold Trust | 0,00 | −100,00 | 0,00 | −100,00 | −0,1355 |