Grundläggande statistik
| Institutionella ägare | 149 total, 149 long only, 0 short only, 0 long/short - change of −3,23% MRQ |
| Genomsnittlig portföljallokering | 1.1951 % - change of −18,34% MRQ |
| Institutionella aktier (lång) | 25 861 634 (ex 13D/G) - change of −8,50MM shares −24,73% MRQ |
| Institutionellt värde (lång) | $ 1 402 124 USD ($1000) |
Institutionellt ägande och aktieägare
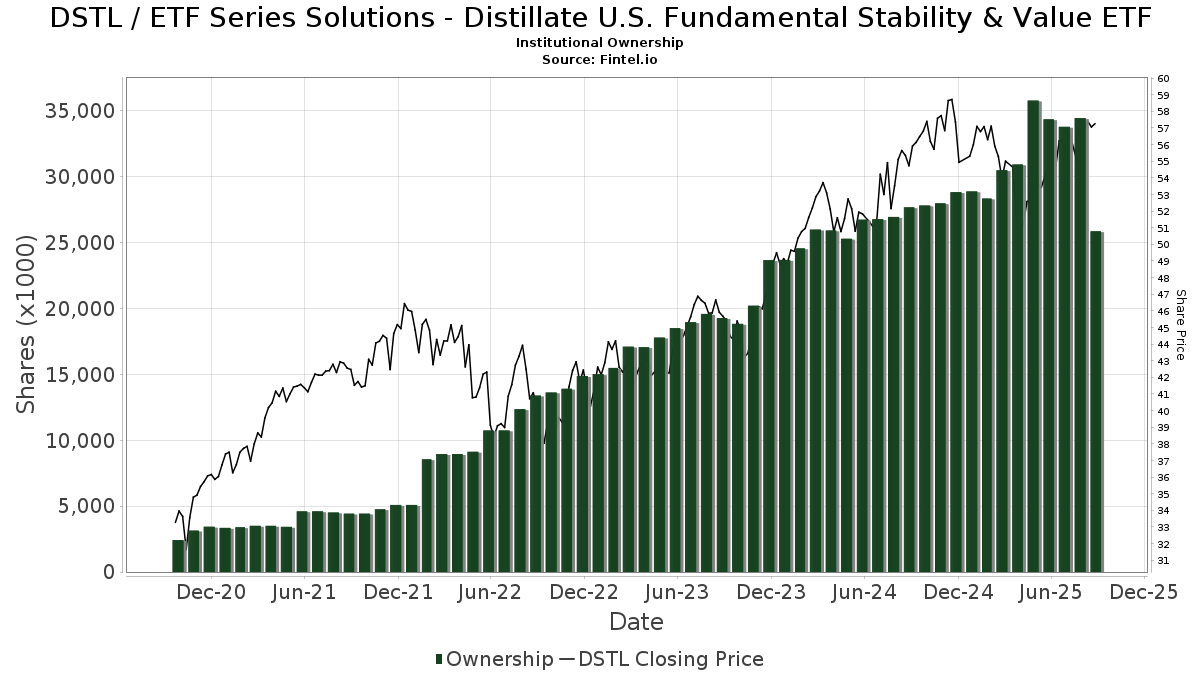
ETF Series Solutions - Distillate U.S. Fundamental Stability & Value ETF (US:DSTL) har 149 Institutionella ägare och aktieägare som har lämnat in 13D/G- eller 13F-formulär till Securities Exchange Commission (SEC). Dessa institut innehar totalt 25,861,634 aktier. Största aktieägare inkluderar Sequoia Financial Advisors, LLC, Wealth Enhancement Advisory Services, Llc, Oxford Financial Group Ltd, Abacus Planning Group, Inc., Madison Asset Management, LLC, Resonant Capital Advisors, LLC, AlphaCore Capital LLC, LPL Financial LLC, Avantax Advisory Services, Inc., and Raymond James Financial Inc .
ETF Series Solutions - Distillate U.S. Fundamental Stability & Value ETF (ARCA:DSTL) Institutionell ägarstruktur visar institutioners och fonders nuvarande positioner i företaget, samt de senaste förändringarna i positionernas storlek. Större aktieägare kan vara enskilda investerare, fonder, hedgefonder eller institutioner. Bilaga 13D visar att investeraren äger (eller ägde) mer än 5% av företaget och avser (eller avsåg) att aktivt eftersträva en förändring av affärsstrategin. Schedule 13G indikerar en passiv investering på över 5%.
The share price as of September 11, 2025 is 58,24 / share. Previously, on September 12, 2024, the share price was 55,14 / share. This represents an increase of 5,62% over that period.
Fondsentimentets poäng
Fondsentimentet poängen(fka Ägarackumulation-poäng) visar vilka aktier som är mest köpta av fonder. Det är resultatet av en sofistikerad kvantitativ flerfaktormodell som identifierar företag med de högsta nivåerna av institutionell ackumulering. Poängsättningsmodellen använder en kombination av den totala ökningen av redovisade ägare, förändringarna i portföljallokeringarna för dessa ägare och andra mått. Siffran sträcker sig från 0 till 100, där högre siffror indikerar en högre nivå av ackumulering i förhållande till sina konkurrenter, och 50 är genomsnittet.
Uppdateringsfrekvens: Dagligen
Se Ownership Explorer, som innehåller en lista över de högst rankade företagen.
Institutionell sälj/köp-kvot
Förutom att rapportera vanliga eget kapital- och skuldemissioner måste institutioner med mer än 100MM tillgångar under förvaltning också avslöja sina innehav av sälj- och köpoptioner. Eftersom säljoptioner i allmänhet indikerar ett negativt sentiment och köpoptioner indikerar ett positivt sentiment, kan vi få en uppfattning om det övergripande institutionella sentimentet genom att plotta förhållandet mellan säljoptioner och köpoptioner. Diagrammet till höger visar det historiska förhållandet mellan sälj- och köpoptioner för detta instrument.
Genom att använda sälj/köp-kvoten som en indikator på aktieägarnas sentiment undviker man en av de största bristerna med att använda det totala institutionella ägandet, nämligen att en betydande del av de förvaltade tillgångarna investeras passivt för att följa index. Passivt förvaltade fonder köper vanligtvis inte optioner, så indikatorn för sälj/köp-kvoten ger en bättre bild av stämningen i aktivt förvaltade fonder.
13F- och NPORT-arkiveringar
Detaljer om 13F-arkiveringar är gratis. Detaljer om NP-arkiveringar kräver ett premiummedlemskap. Gröna rader indikerar nya positioner. Röda rader indikerar stängda positioner. Klicka på länk symbolen för att se hela transaktionshistoriken.
Uppgradera
för att låsa upp premiumdata och exportera till Excel ![]() .
.
| Fil Datum | Källa | Investerare | Typ | Genomsnittligt pris (beräknat) |
Aktier | Δ Aktier (%) |
Rapporterat värde (1000 USD) |
Δ Värde (%) |
Portföljallokering (%) |
|
|---|---|---|---|---|---|---|---|---|---|---|
| 2025-07-24 | 13F/A | TFR Capital, LLC. | 27 952 | −5,21 | 1 547 | −3,25 | ||||
| 2025-07-24 | 13F | IFP Advisors, Inc | 47 491 | 0,64 | 2 629 | 2,70 | ||||
| 2025-08-13 | 13F | Russell Investments Group, Ltd. | 2 020 | 0,35 | 112 | 1,83 | ||||
| 2025-08-06 | 13F | AE Wealth Management LLC | 71 | 0,00 | 4 | 0,00 | ||||
| 2025-08-12 | 13F | Gladstone Institutional Advisory LLC | 124 719 | 3,53 | 6 903 | 5,65 | ||||
| 2025-07-17 | 13F | Barry Investment Advisors, LLC | 25 477 | 14,99 | 1 410 | 17,40 | ||||
| 2025-07-25 | 13F | We Are One Seven, LLC | 42 435 | −5,78 | 2 349 | −3,85 | ||||
| 2025-08-07 | 13F | David R. Rahn & Associates Inc. | 0 | −100,00 | 0 | |||||
| 2025-08-05 | 13F | Landmark Wealth Management, Inc. | 10 225 | −68,07 | 566 | −67,45 | ||||
| 2025-07-22 | 13F | Merit Financial Group, LLC | 70 261 | 3 889 | ||||||
| 2025-07-14 | 13F | Clayton Financial Group LLC | 4 625 | −94,18 | 256 | −94,08 | ||||
| 2025-08-11 | 13F | Berkeley, Inc | 401 045 | 9,43 | 22 198 | 11,67 | ||||
| 2025-08-13 | 13F | Level Four Advisory Services, Llc | 276 377 | 1,75 | 15 298 | 3,84 | ||||
| 2025-08-15 | 13F | Equitable Holdings, Inc. | 116 103 | −11,98 | 6 426 | −10,18 | ||||
| 2025-08-07 | 13F | American Alpha Advisors, LLC | 12 005 | −4,39 | 664 | −2,50 | ||||
| 2025-07-18 | 13F | SimpliFi, Inc. | 203 772 | 0,82 | 11 279 | 2,88 | ||||
| 2025-08-14 | 13F | Integrated Wealth Concepts LLC | 14 867 | −0,17 | 823 | 1,86 | ||||
| 2025-08-11 | 13F | HighTower Advisors, LLC | 13 568 | −93,72 | 751 | −93,60 | ||||
| 2025-08-14 | 13F | Oxford Financial Group Ltd | 1 668 041 | 2,39 | 92 326 | 4,49 | ||||
| 2025-08-15 | 13F | Morgan Stanley | 10 426 | −26,64 | 577 | −25,06 | ||||
| 2025-07-25 | 13F | Cwm, Llc | 51 | 0 | ||||||
| 2025-07-14 | 13F | Park Avenue Securities Llc | 138 031 | 32,68 | 8 | 40,00 | ||||
| 2025-07-18 | 13F | Centricity Wealth Management, LLC | 639 | 0,00 | 35 | 2,94 | ||||
| 2025-08-14 | 13F | Mercer Global Advisors Inc /adv | 3 630 | 201 | ||||||
| 2025-08-12 | 13F | Soundwatch Capital LLC | 3 923 | 1 807 | ||||||
| 2025-06-17 | NP | MAGSX - Madison Aggressive Allocation Fund Aggressive Allocation Fund Class A | 92 013 | −0,00 | 4 837 | −7,50 | ||||
| 2025-08-07 | 13F | Allworth Financial LP | 700 | 0,00 | 39 | 5,56 | ||||
| 2025-08-14 | 13F/A | Rockefeller Capital Management L.P. | 420 618 | 1,20 | 23 281 | 3,27 | ||||
| 2025-06-17 | NP | MMDAX - Madison Moderate Allocation Fund Moderate Allocation Fund Class A | 116 208 | −5,65 | 6 109 | −12,72 | ||||
| 2025-08-14 | 13F | Colony Group, LLC | 204 363 | 0,07 | 11 312 | 2,11 | ||||
| 2025-07-23 | 13F | Hardy Reed LLC | 0 | −100,00 | 0 | |||||
| 2025-08-13 | 13F | EverSource Wealth Advisors, LLC | 1 643 | 5 565,52 | 91 | 8 900,00 | ||||
| 2025-07-31 | 13F | Resonant Capital Advisors, LLC | 985 505 | 5,71 | 54 548 | 7,88 | ||||
| 2025-08-05 | 13F | GHP Investment Advisors, Inc. | 60 | 0,00 | 3 | 0,00 | ||||
| 2025-07-11 | 13F | Farther Finance Advisors, LLC | 154 | −81,82 | 9 | −82,22 | ||||
| 2025-07-18 | 13F | BCU Wealth Advisors, LLC | 5 892 | 0,22 | 326 | 2,52 | ||||
| 2025-07-31 | 13F | Cambridge Investment Research Advisors, Inc. | 318 157 | −0,05 | 18 | 0,00 | ||||
| 2025-08-14 | 13F | Bank Of America Corp /de/ | 232 596 | −15,74 | 12 874 | −14,01 | ||||
| 2025-08-07 | 13F | FDx Advisors, Inc. | 0 | −100,00 | 0 | |||||
| 2025-07-31 | 13F | Brinker Capital Investments, LLC | 0 | −100,00 | 0 | −100,00 | ||||
| 2025-07-09 | 13F | WealthCare Investment Partners, LLC | 9 916 | 0,33 | 558 | 13,88 | ||||
| 2025-08-19 | 13F | Advisory Services Network, LLC | 24 538 | −12,55 | 1 345 | −11,57 | ||||
| 2025-08-04 | 13F | Assetmark, Inc | 216 | −42,25 | 12 | −45,00 | ||||
| 2025-08-13 | 13F | Northwestern Mutual Wealth Management Co | 2 453 | −40,20 | 136 | −39,19 | ||||
| 2025-08-18 | 13F | Geneos Wealth Management Inc. | 3 650 | 0,00 | 202 | 2,54 | ||||
| 2025-07-02 | 13F | Crumly & Associates Inc. | 360 414 | 4,02 | 19 949 | 6,15 | ||||
| 2025-08-14 | 13F | Goldman Sachs Group Inc | 107 252 | 405,00 | 5 936 | 415,73 | ||||
| 2025-08-14 | 13F | Operose Advisors LLC | 681 | 0,00 | 38 | 2,78 | ||||
| 2025-07-10 | 13F | Wealth Enhancement Advisory Services, Llc | 2 258 144 | 55,65 | 127 111 | 61,53 | ||||
| 2025-07-31 | 13F | Orion Capital Management LLC | 175 635 | 0,62 | 9 721 | 2,68 | ||||
| 2025-08-13 | 13F | Per Stirling Capital Management, LLC. | 11 361 | −8,01 | 629 | −6,13 | ||||
| 2025-07-25 | 13F | Envestnet Portfolio Solutions, Inc. | 0 | −100,00 | 0 | |||||
| 2025-08-12 | 13F | Tradition Wealth Management, LLC | 8 233 | −2,60 | 456 | −0,66 | ||||
| 2025-08-14 | 13F | Comerica Bank | 0 | −100,00 | 0 | |||||
| 2025-08-06 | 13F | Commonwealth Equity Services, Llc | 45 137 | −3,96 | 2 | 0,00 | ||||
| 2025-07-28 | 13F | Harbour Investments, Inc. | 34 746 | 20,34 | 1 923 | 22,88 | ||||
| 2025-07-25 | 13F | LRI Investments, LLC | 9 805 | 8,90 | 543 | 11,07 | ||||
| 2025-08-13 | 13F | Cerity Partners LLC | 659 583 | −0,35 | 36 508 | 1,69 | ||||
| 2025-08-15 | 13F | Global View Capital Management LLC | 8 450 | −5,44 | 468 | −3,51 | ||||
| 2025-08-12 | 13F | O'shaughnessy Asset Management, Llc | 5 912 | −4,31 | 327 | −2,39 | ||||
| 2025-07-30 | NP | ENDW - Cambria Endowment Style ETF | 2 164 | 116 | ||||||
| 2025-08-14 | 13F | Stifel Financial Corp | 15 084 | −41,57 | 835 | −40,43 | ||||
| 2025-07-11 | 13F | Adirondack Trust Co | 849 | 47 | ||||||
| 2025-08-12 | 13F | LPL Financial LLC | 852 766 | −13,21 | 47 201 | −11,43 | ||||
| 2025-08-13 | 13F | Quadrant Capital Group Llc | 0 | −100,00 | 0 | |||||
| 2025-08-04 | 13F | Spire Wealth Management | 2 060 | 0,00 | 114 | 2,70 | ||||
| 2025-08-18 | NP | ULTRA SERIES FUND - Madison Target Retirement 2040 Fund Class I | 98 548 | 1,33 | 5 455 | 3,41 | ||||
| 2025-08-14 | 13F | Mml Investors Services, Llc | 6 484 | −5,59 | 0 | |||||
| 2025-08-18 | NP | ULTRA SERIES FUND - Conservative Allocation Fund Class I | 17 446 | −40,44 | 966 | −39,23 | ||||
| 2025-08-07 | 13F | Weil Company, Inc. | 46 799 | −68,35 | 2 590 | −67,71 | ||||
| 2025-08-14 | 13F | Raymond James Financial Inc | 682 951 | −4,01 | 37 801 | −2,05 | ||||
| 2025-08-14 | 13F | Herold Advisors, Inc. | 91 377 | −6,35 | 5 058 | −4,44 | ||||
| 2025-08-14 | 13F | Wells Fargo & Company/mn | 15 | −99,99 | 1 | −100,00 | ||||
| 2025-08-14 | 13F | CIBC World Markets Inc. | 16 113 | −11,92 | 892 | −10,18 | ||||
| 2025-08-08 | 13F | Hibernia Wealth Partners, LLC | 23 396 | 100,21 | 1 295 | 104,42 | ||||
| 2025-08-14 | 13F/A | Perritt Capital Management Inc | 136 512 | 1,86 | 7 556 | 3,95 | ||||
| 2025-08-14 | 13F | Certified Advisory Corp | 6 794 | 0,00 | 376 | 2,17 | ||||
| 2025-08-05 | 13F | Bank of New York Mellon Corp | 0 | −100,00 | 0 | |||||
| 2025-08-14 | 13F | Hrt Financial Lp | 5 125 | 0 | ||||||
| 2025-08-18 | NP | ULTRA SERIES FUND - Aggressive Allocation Fund Class I | 50 636 | −12,52 | 2 803 | −10,74 | ||||
| 2025-07-17 | 13F | Vermillion Wealth Management, Inc. | 672 | 0,00 | 37 | 2,78 | ||||
| 2025-08-08 | 13F | Cetera Investment Advisers | 80 091 | −17,73 | 4 433 | −16,04 | ||||
| 2025-08-06 | 13F | SOUTH STATE Corp | 0 | −100,00 | 0 | |||||
| 2025-08-26 | 13F/A | Thrivent Financial For Lutherans | 7 528 | 0 | ||||||
| 2025-07-30 | 13F | Green Square Capital Advisors Llc | 606 155 | 1,92 | 33 551 | 4,00 | ||||
| 2025-08-12 | 13F | Richard W. Paul & Associates, LLC | 35 291 | 1,47 | 1 953 | 3,55 | ||||
| 2025-08-14 | 13F | Hilltop Holdings Inc. | 31 098 | −0,85 | 1 721 | 1,18 | ||||
| 2025-08-14 | 13F | Qube Research & Technologies Ltd | 17 085 | 0,86 | 946 | 2,94 | ||||
| 2025-08-01 | 13F | Envestnet Asset Management Inc | 70 992 | −79,81 | 3 929 | −79,40 | ||||
| 2025-08-14 | 13F | Ausdal Financial Partners, Inc. | 34 947 | −5,25 | 1 934 | −3,30 | ||||
| 2025-07-23 | 13F | Ameliora Wealth Management Ltd. | 0 | −100,00 | 0 | |||||
| 2025-08-13 | 13F | GeoWealth Management, LLC | 6 447 | −10,89 | 357 | −9,18 | ||||
| 2025-08-18 | NP | ULTRA SERIES FUND - Moderate Allocation Fund Class I | 66 002 | −30,14 | 3 653 | −28,71 | ||||
| 2025-08-18 | NP | ULTRA SERIES FUND - Madison Target Retirement 2020 Fund Class I | 6 477 | −30,23 | 359 | −28,83 | ||||
| 2025-07-24 | 13F | Us Bancorp \de\ | 5 777 | −8,04 | 320 | −6,18 | ||||
| 2025-07-29 | 13F | Oxbow Advisors, LLC | 220 693 | 0,04 | 12 215 | 2,08 | ||||
| 2025-07-17 | 13F | Oakworth Capital, Inc. | 672 | 0,00 | 37 | 2,78 | ||||
| 2025-04-15 | 13F | Members Wealth Llc | 6 742 | −28,15 | 366 | −30,87 | ||||
| 2025-07-22 | 13F | Apexium Financial, Lp | 236 184 | 10,31 | 13 073 | 12,56 | ||||
| 2025-08-12 | 13F | CIBC Private Wealth Group, LLC | 3 583 | −56,74 | 198 | −50,62 | ||||
| 2025-08-14 | 13F | Arete Wealth Advisors, LLC | 17 942 | −7,35 | 1 | −100,00 | ||||
| 2025-08-04 | 13F | Flagship Harbor Advisors, Llc | 73 229 | 0,89 | 4 053 | 2,95 | ||||
| 2025-08-14 | 13F | Harwood Advisory Group, LLC | 65 897 | 0,33 | 3 647 | 1,11 | ||||
| 2025-07-22 | 13F | Belpointe Asset Management LLC | 5 162 | −10,61 | 286 | −8,95 | ||||
| 2025-08-13 | 13F | Empire Financial Management Company, LLC | 246 129 | −1,99 | 13 623 | 0,01 | ||||
| 2025-08-12 | 13F | Proequities, Inc. | 0 | 0 | ||||||
| 2025-08-11 | 13F | Shufro Rose & Co Llc | 5 817 | −20,80 | 315 | −20,85 | ||||
| 2025-08-08 | 13F | Pnc Financial Services Group, Inc. | 626 | 35 | ||||||
| 2025-07-14 | 13F | U.S. Capital Wealth Advisors, LLC | 0 | −100,00 | 0 | |||||
| 2025-07-29 | 13F | ODonnell Financial Services, LLC | 474 625 | 0,03 | 26 270 | 2,08 | ||||
| 2025-08-06 | 13F | Stonebridge Financial Planning Group, LLC | 69 317 | −1,01 | 3 837 | 1,00 | ||||
| 2025-07-15 | 13F | Heritage Oak Wealth Advisors Llc | 18 868 | 1,34 | 1 044 | 3,47 | ||||
| 2025-08-12 | 13F | Steward Partners Investment Advisory, Llc | 1 627 | −75,33 | 90 | −74,79 | ||||
| 2025-08-14 | 13F | Jane Street Group, Llc | 7 185 | 398 | ||||||
| 2025-07-16 | 13F | Meridian Financial, LLC | 6 900 | 11,29 | 382 | 13,39 | ||||
| 2025-08-15 | 13F | Captrust Financial Advisors | 170 713 | −25,41 | 9 449 | −23,89 | ||||
| 2025-07-18 | 13F | Truist Financial Corp | 13 751 | −47,22 | 761 | −46,14 | ||||
| 2025-08-14 | 13F | Fmr Llc | 377 | −71,16 | 21 | −71,43 | ||||
| 2025-07-30 | 13F | Rehmann Capital Advisory Group | 25 065 | −1,02 | 1 387 | 1,02 | ||||
| 2025-08-13 | 13F | SCS Capital Management LLC | 7 310 | 405 | ||||||
| 2025-07-25 | 13F | Atria Wealth Solutions, Inc. | 0 | −100,00 | 0 | −100,00 | ||||
| 2025-07-15 | 13F | Oregon Pacific Wealth Management, LLC | 4 264 | −67,47 | 236 | −66,76 | ||||
| 2025-08-14 | 13F | Citadel Advisors Llc | 5 491 | 0,00 | 304 | 2,02 | ||||
| 2025-08-06 | 13F | Aspect Partners, LLC | 44 727 | 9,10 | 2 476 | 11,34 | ||||
| 2025-04-22 | 13F | Mendota Financial Group, LLC | 0 | −100,00 | 0 | −100,00 | ||||
| 2025-08-11 | 13F | Madison Asset Management, LLC | 1 115 963 | −17,07 | 61 769 | −15,37 | ||||
| 2025-08-18 | NP | ULTRA SERIES FUND - Madison Target Retirement 2050 Fund Class I | 100 329 | 0,03 | 5 553 | 2,08 | ||||
| 2025-07-09 | 13F | Fermata Advisors, LLC | 74 153 | 6,39 | 4 104 | 8,57 | ||||
| 2025-08-06 | 13F | Centerpoint Advisory Group | 75 505 | −1,68 | 4 179 | 0,34 | ||||
| 2025-08-12 | 13F | Allen Capital Group, LLC | 568 804 | −3,90 | 31 483 | −1,93 | ||||
| 2025-07-08 | 13F | Nbc Securities, Inc. | 0 | −100,00 | 0 | |||||
| 2025-07-14 | 13F | Opal Wealth Advisors, LLC | 3 076 | 3,57 | 170 | 5,59 | ||||
| 2025-04-21 | 13F | PSI Advisors, LLC | 0 | −100,00 | 0 | |||||
| 2025-07-15 | 13F | Accurate Wealth Management, LLC | 10 945 | −4,66 | 618 | 5,10 | ||||
| 2025-09-04 | 13F/A | Advisor Group Holdings, Inc. | 56 486 | −24,51 | 3 127 | −22,96 | ||||
| 2025-08-08 | 13F | Thoroughbred Financial Services, Llc | 43 032 | −15,32 | 2 | 0,00 | ||||
| 2025-08-11 | 13F | Aspen Investment Management Inc | 0 | −100,00 | 0 | |||||
| 2025-08-06 | 13F | Csenge Advisory Group | 66 990 | 1,63 | 3 587 | 7,20 | ||||
| 2025-08-14 | 13F | Mariner, LLC | 18 265 | 1 011 | ||||||
| 2025-08-06 | 13F | Legacy Investment Solutions, LLC | 5 407 | −66,37 | 299 | −66,96 | ||||
| 2025-05-15 | 13F | Glenmede Trust Co Na | 4 500 | 0,00 | 244 | −1,21 | ||||
| 2025-08-05 | 13F | Simplex Trading, Llc | 86 | 11,69 | 0 | |||||
| 2025-08-14 | 13F | Royal Bank Of Canada | 11 325 | −97,88 | 627 | −97,83 | ||||
| 2025-08-05 | 13F | Hutchens & Kramer Investment Management Group, LLC | 13 665 | 17,80 | 768 | 21,94 | ||||
| 2025-08-12 | 13F | BlackRock, Inc. | 1 185 | 0,00 | 66 | 1,56 | ||||
| 2025-06-17 | NP | MCNAX - Madison Conservative Allocation Fund Conservative Allocation Fund Class A | 34 691 | −8,12 | 1 824 | −15,01 | ||||
| 2025-08-14 | 13F | Susquehanna International Group, Llp | 8 281 | 458 | ||||||
| 2025-07-09 | 13F | Sapient Capital Llc | 29 412 | 0,00 | 1 628 | 2,01 | ||||
| 2025-08-12 | 13F | Global Retirement Partners, LLC | 0 | −100,00 | 0 | |||||
| 2025-08-14 | 13F | Two Sigma Securities, Llc | 4 583 | 254 | ||||||
| 2025-07-16 | 13F | Old Port Advisors | 128 578 | −1,76 | 7 117 | 0,25 | ||||
| 2025-08-06 | 13F | Sage Advisory Services, Ltd.Co. | 14 198 | −92,17 | 786 | −92,01 | ||||
| 2025-08-08 | 13F | Hartland & Co., LLC | 454 | 10,19 | 25 | 13,64 | ||||
| 2025-07-25 | 13F | Sequoia Financial Advisors, LLC | 5 403 637 | 2,71 | 299 091 | 4,81 | ||||
| 2025-08-08 | 13F | Avantax Advisory Services, Inc. | 801 110 | 3,67 | 44 341 | 5,79 | ||||
| 2025-05-09 | 13F | Keeler THomas Management LLC | 0 | −100,00 | 0 | −100,00 | ||||
| 2025-07-28 | 13F | Arlington Financial Advisors, LLC | 464 826 | 1,12 | 25 728 | 3,19 | ||||
| 2025-08-05 | 13F | Carolinas Wealth Consulting Llc | 0 | −100,00 | 0 | −100,00 | ||||
| 2025-08-14 | 13F | UBS Group AG | 4 669 | −4,05 | 258 | −1,90 | ||||
| 2025-07-21 | 13F/A | Abacus Planning Group, Inc. | 1 381 445 | −3,21 | 76 463 | −1,23 | ||||
| 2025-08-05 | 13F | Huntington National Bank | 1 232 | 2,07 | ||||||
| 2025-08-06 | 13F | Legacy Wealth Managment, LLC/ID | 5 407 | 7,62 | 299 | 9,93 | ||||
| 2025-08-19 | 13F | Anchor Investment Management, LLC | 7 164 | 0,00 | 397 | 2,06 | ||||
| 2025-04-22 | 13F | PFG Investments, LLC | 0 | −100,00 | 0 | |||||
| 2025-08-12 | 13F | AlphaCore Capital LLC | 959 896 | 0,70 | 53 130 | 2,77 | ||||
| 2025-07-01 | 13F | Park National Corp /oh/ | 52 402 | −91,43 | 2 900 | −91,26 | ||||
| 2025-07-17 | 13F | Cyr Financial Inc. | 0 | −100,00 | 0 | −100,00 | ||||
| 2025-07-21 | 13F | Ameritas Advisory Services, LLC | 2 602 | −41,12 | 144 | −40,00 | ||||
| 2025-07-23 | 13F | Sunbeam Capital Management, LLC | 155 720 | 17,51 | 8 619 | 19,92 | ||||
| 2025-05-13 | 13F | Hrc Wealth Management, Llc | 0 | −100,00 | 0 | |||||
| 2025-07-24 | 13F | Blair William & Co/il | 82 | 1,23 | 5 | 0,00 | ||||
| 2025-08-12 | 13F | Jpmorgan Chase & Co | 81 214 | 154,46 | 4 495 | 159,68 | ||||
| 2025-08-18 | NP | ULTRA SERIES FUND - Madison Target Retirement 2030 Fund Class I | 73 181 | −4,59 | 4 051 | −2,64 |