Grundläggande statistik
| Institutionella aktier (lång) | 32 770 410 - 58,91% (ex 13D/G) - change of 13,82MM shares 72,91% MRQ |
| Institutionellt värde (lång) | $ 437 686 USD ($1000) |
Institutionellt ägande och aktieägare
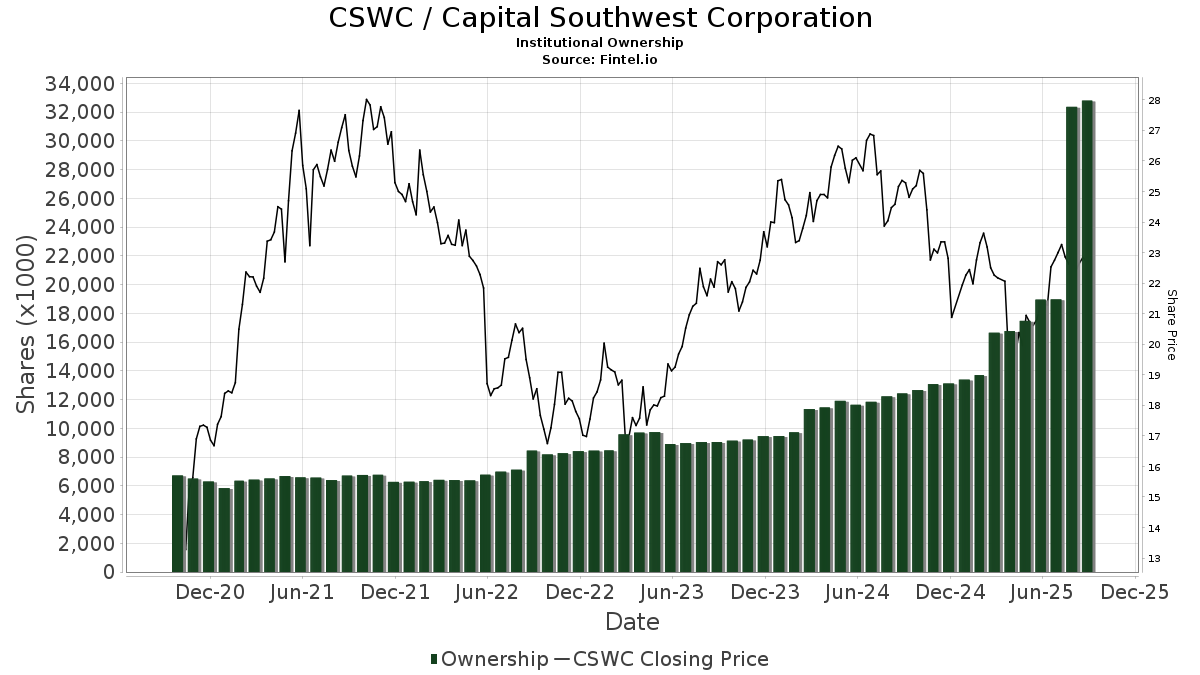
Capital Southwest Corporation (US:CSWC) har 192 Institutionella ägare och aktieägare som har lämnat in 13D/G- eller 13F-formulär till Securities Exchange Commission (SEC). Dessa institut innehar totalt 32,772,785 aktier. Största aktieägare inkluderar Kingstone Capital Partners Texas, LLC, Sanders Morris Harris Llc, Van Eck Associates Corp, BIZD - VanEck Vectors BDC Income ETF, Two Sigma Advisers, Lp, UBS Group AG, Two Sigma Investments, Lp, Sound Income Strategies, LLC, Balyasny Asset Management Llc, and Millennium Management Llc .
Capital Southwest Corporation (NasdaqGS:CSWC) Institutionell ägarstruktur visar institutioners och fonders nuvarande positioner i företaget, samt de senaste förändringarna i positionernas storlek. Större aktieägare kan vara enskilda investerare, fonder, hedgefonder eller institutioner. Bilaga 13D visar att investeraren äger (eller ägde) mer än 5% av företaget och avser (eller avsåg) att aktivt eftersträva en förändring av affärsstrategin. Schedule 13G indikerar en passiv investering på över 5%.
The share price as of September 9, 2025 is 22,92 / share. Previously, on September 10, 2024, the share price was 25,06 / share. This represents a decline of 8,54% over that period.
Fondsentimentets poäng
Fondsentimentet poängen(fka Ägarackumulation-poäng) visar vilka aktier som är mest köpta av fonder. Det är resultatet av en sofistikerad kvantitativ flerfaktormodell som identifierar företag med de högsta nivåerna av institutionell ackumulering. Poängsättningsmodellen använder en kombination av den totala ökningen av redovisade ägare, förändringarna i portföljallokeringarna för dessa ägare och andra mått. Siffran sträcker sig från 0 till 100, där högre siffror indikerar en högre nivå av ackumulering i förhållande till sina konkurrenter, och 50 är genomsnittet.
Uppdateringsfrekvens: Dagligen
Se Ownership Explorer, som innehåller en lista över de högst rankade företagen.
Institutionell sälj/köp-kvot
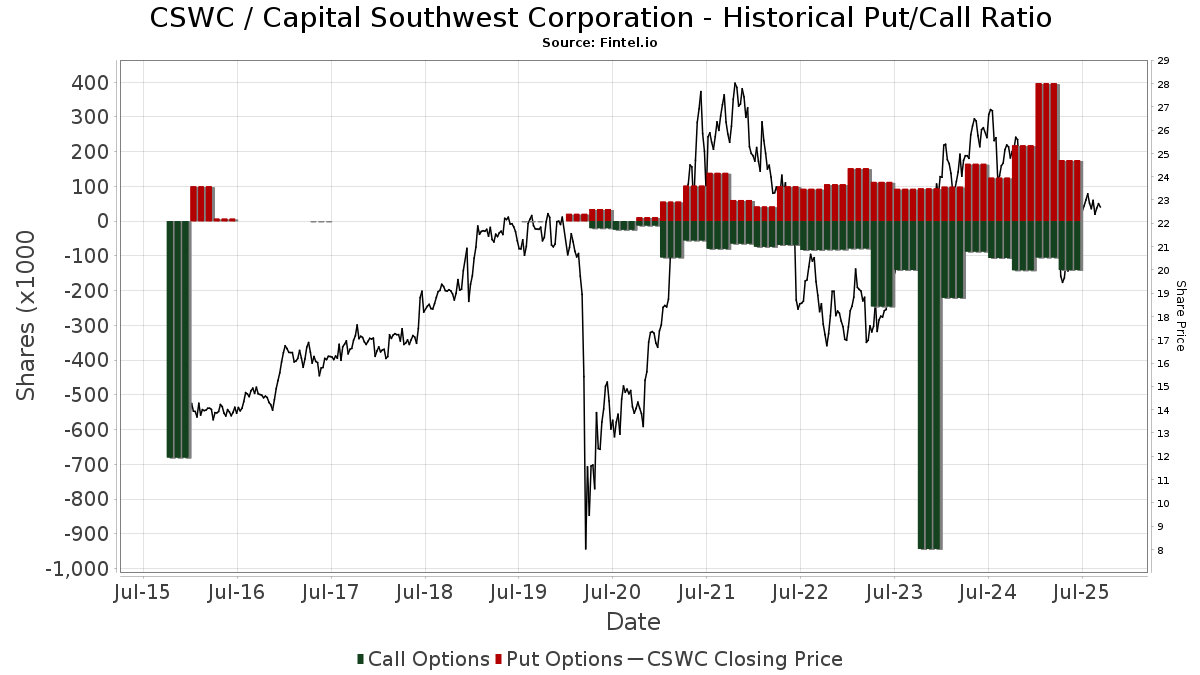
Förutom att rapportera vanliga eget kapital- och skuldemissioner måste institutioner med mer än 100MM tillgångar under förvaltning också avslöja sina innehav av sälj- och köpoptioner. Eftersom säljoptioner i allmänhet indikerar ett negativt sentiment och köpoptioner indikerar ett positivt sentiment, kan vi få en uppfattning om det övergripande institutionella sentimentet genom att plotta förhållandet mellan säljoptioner och köpoptioner. Diagrammet till höger visar det historiska förhållandet mellan sälj- och köpoptioner för detta instrument.
Genom att använda sälj/köp-kvoten som en indikator på aktieägarnas sentiment undviker man en av de största bristerna med att använda det totala institutionella ägandet, nämligen att en betydande del av de förvaltade tillgångarna investeras passivt för att följa index. Passivt förvaltade fonder köper vanligtvis inte optioner, så indikatorn för sälj/köp-kvoten ger en bättre bild av stämningen i aktivt förvaltade fonder.
13F- och NPORT-arkiveringar
Detaljer om 13F-arkiveringar är gratis. Detaljer om NP-arkiveringar kräver ett premiummedlemskap. Gröna rader indikerar nya positioner. Röda rader indikerar stängda positioner. Klicka på länk symbolen för att se hela transaktionshistoriken.
Uppgradera
för att låsa upp premiumdata och exportera till Excel ![]() .
.
| Fil Datum | Källa | Investerare | Typ | Genomsnittligt pris (beräknat) |
Aktier | Δ Aktier (%) |
Rapporterat värde (1000 USD) |
Δ Värde (%) |
Portföljallokering (%) |
|
|---|---|---|---|---|---|---|---|---|---|---|
| 2025-08-27 | NP | JNL SERIES TRUST - JNL Multi-Manager Alternative Fund (A) | Short | −1 763 | −19,20 | −39 | −20,83 | |||
| 2025-08-18 | 13F | Wolverine Trading, Llc | Put | 0 | −100,00 | 0 | ||||
| 2025-08-14 | 13F | Tudor Investment Corp Et Al | 35 219 | 776 | ||||||
| 2025-08-06 | 13F | Smh Capital Advisors Inc | 45 215 | −1,67 | 997 | −2,92 | ||||
| 2025-08-14 | 13F | FJ Capital Management LLC | 35 067 | −12,51 | 773 | −13,65 | ||||
| 2025-08-06 | 13F | Rialto Wealth Management, LLC | 4 809 | 0,00 | 106 | −1,87 | ||||
| 2025-08-14 | 13F | Voloridge Investment Management, Llc | 80 641 | 22,70 | 1 777 | 21,21 | ||||
| 2025-08-12 | 13F | Advisors Asset Management, Inc. | 112 511 | −24,27 | 2 480 | −25,22 | ||||
| 2025-08-14 | 13F | Brevan Howard Capital Management LP | 54 503 | 1 201 | ||||||
| 2025-08-19 | 13F | National Asset Management, Inc. | 92 163 | 82,05 | 2 031 | 83,97 | ||||
| 2025-08-12 | 13F | Archer Investment Corp | 0 | −100,00 | 0 | |||||
| 2025-08-14 | 13F | UBS Group AG | 783 060 | 163,77 | 17 259 | 160,46 | ||||
| 2025-08-15 | 13F | Morgan Stanley | 227 396 | 42,30 | 5 012 | 40,52 | ||||
| 2025-07-14 | 13F | Ridgewood Investments LLC | 500 | 0,00 | 11 | 0,00 | ||||
| 2025-08-18 | 13F | Wolverine Trading, Llc | 0 | −100,00 | 0 | |||||
| 2025-07-24 | 13F | Grace & White Inc /ny | 174 597 | −1,13 | 3 848 | −2,36 | ||||
| 2025-08-04 | 13F | Muzinich & Co., Inc. | 225 790 | 64,37 | 4 976 | 62,30 | ||||
| 2025-08-07 | 13F | Samalin Investment Counsel, LLC | 25 864 | 7,97 | 570 | 6,74 | ||||
| 2025-08-14 | 13F | Verition Fund Management LLC | 31 500 | −6,73 | 694 | −7,84 | ||||
| 2025-06-18 | NP | Putnam ETF Trust - Putnam BDC ETF - | 267 259 | 5,63 | 5 447 | −4,37 | ||||
| 2025-07-17 | 13F | Janney Montgomery Scott LLC | 0 | −100,00 | 0 | |||||
| 2025-07-30 | 13F | Denali Advisors Llc | 113 850 | −2,19 | 2 509 | −3,43 | ||||
| 2025-08-11 | 13F | Moerus Capital Management LLC | 73 983 | 0,00 | 1 631 | −1,27 | ||||
| 2025-08-11 | 13F | Citigroup Inc | 0 | −100,00 | 0 | |||||
| 2025-08-12 | 13F | Jpmorgan Chase & Co | 8 423 | −74,44 | 186 | −74,83 | ||||
| 2025-08-08 | 13F | Pnc Financial Services Group, Inc. | 1 566 | 0,00 | 35 | 0,00 | ||||
| 2025-07-30 | 13F | Sanders Morris Harris Llc | 1 390 339 | −2,98 | 30 643 | −4,20 | ||||
| 2025-08-14 | 13F | Sunbelt Securities, Inc. | 37 229 | −5,10 | 812 | −7,20 | ||||
| 2025-07-25 | 13F | Total Clarity Wealth Management, Inc. | 0 | −100,00 | 0 | |||||
| 2025-08-14 | 13F | Harwood Advisory Group, LLC | 0 | −100,00 | 0 | |||||
| 2025-07-18 | 13F | SOA Wealth Advisors, LLC. | 0 | −100,00 | 0 | |||||
| 2025-08-13 | 13F | Beacon Pointe Advisors, LLC | 226 212 | −45,42 | 4 986 | −46,11 | ||||
| 2025-08-15 | 13F | Prevail Innovative Wealth Advisors, Llc | 56 395 | 1 243 | ||||||
| 2025-08-12 | 13F | TCTC Holdings, LLC | 2 136 | 0,00 | 47 | 0,00 | ||||
| 2025-08-14 | 13F | Sovereign's Capital Management, LLC | 77 048 | 9,49 | 1 698 | 8,15 | ||||
| 2025-04-28 | 13F | Mainstream Capital Management LLC | 0 | −100,00 | 0 | |||||
| 2025-07-28 | 13F | Melia Wealth LLC | 464 973 | 10,10 | 10 248 | 8,73 | ||||
| 2025-08-14 | 13F | GWM Advisors LLC | 639 | −96,48 | 14 | −96,54 | ||||
| 2025-07-21 | 13F | Catalina Capital Group, LLC | 0 | −100,00 | 0 | |||||
| 2025-08-14 | 13F | Punch & Associates Investment Management, Inc. | 0 | −100,00 | 0 | |||||
| 2025-04-29 | 13F | Raleigh Capital Management Inc. | 0 | −100,00 | 0 | |||||
| 2025-07-28 | 13F | Naviter Wealth, LLC | 100 105 | 22,45 | 2 206 | 17,28 | ||||
| 2025-08-13 | 13F | PharVision Advisers, LLC | 11 249 | 248 | ||||||
| 2025-08-19 | 13F | Newbridge Financial Services Group, Inc. | 3 176 | 70 | ||||||
| 2025-07-31 | 13F | Caitong International Asset Management Co., Ltd | 19 | 0 | ||||||
| 2025-07-25 | 13F | Atria Wealth Solutions, Inc. | 9 738 | 215 | ||||||
| 2025-08-08 | 13F | Creative Planning | 9 114 | 201 | ||||||
| 2025-08-14 | 13F | Goldman Sachs Group Inc | 212 781 | −17,42 | 4 690 | −18,47 | ||||
| 2025-08-13 | 13F | Virtus Investment Advisers, Inc. | 41 064 | −7,02 | 905 | −8,12 | ||||
| 2025-08-15 | 13F | Tower Research Capital LLC (TRC) | 1 877 | 13 307,14 | 41 | |||||
| 2025-07-21 | 13F | Monticello Wealth Management, Llc | 18 272 | 0,00 | 403 | −1,23 | ||||
| 2025-05-12 | 13F | Fmr Llc | 0 | −100,00 | 0 | |||||
| 2025-08-13 | 13F | Quantbot Technologies LP | 75 546 | 22,73 | 1 665 | 21,27 | ||||
| 2025-08-14 | 13F | Cubist Systematic Strategies, LLC | 107 201 | 98,47 | 2 363 | 96,02 | ||||
| 2025-08-13 | 13F | Jump Financial, LLC | 40 579 | 894 | ||||||
| 2025-08-05 | 13F | Simplex Trading, Llc | Call | 11 000 | 83,33 | 0 | ||||
| 2025-07-31 | 13F | Nisa Investment Advisors, Llc | 3 500 | 600,00 | 77 | 600,00 | ||||
| 2025-07-24 | 13F | IFP Advisors, Inc | 475 | 10 | ||||||
| 2025-08-14 | 13F | Royal Bank Of Canada | 149 055 | 115,59 | 3 285 | 112,76 | ||||
| 2025-08-05 | 13F | Simplex Trading, Llc | Put | 8 500 | −42,95 | 0 | ||||
| 2025-08-05 | 13F | Simplex Trading, Llc | 14 793 | 24,33 | 0 | |||||
| 2025-07-24 | NP | FNCMX - Fidelity Nasdaq Composite Index Fund This fund is a listed as child fund of Fmr Llc and if that institution has disclosed ownership in this security, then these positions will not be double counted when calculating total shares and total value | 11 251 | 0,00 | 234 | −10,69 | ||||
| 2025-05-15 | 13F | Wolverine Trading, Llc | Call | 0 | −100,00 | 0 | −100,00 | |||
| 2025-08-14 | 13F | Nebula Research & Development LLC | 25 907 | 571 | ||||||
| 2025-07-11 | 13F | Caldwell Securities, Inc | 41 052 | −1,62 | 905 | −2,90 | ||||
| 2025-08-08 | 13F | Geode Capital Management, Llc | 11 251 | 0,00 | 248 | −1,59 | ||||
| 2025-08-14 | 13F | Benjamin Edwards Inc | 87 765 | 3,52 | 1 934 | 2,22 | ||||
| 2025-08-13 | 13F | EverSource Wealth Advisors, LLC | 2 787 | 18,14 | 61 | 17,31 | ||||
| 2025-08-14 | 13F | Engineers Gate Manager LP | 41 379 | 111,26 | 912 | 108,47 | ||||
| 2025-05-14 | 13F | Brown Brothers Harriman & Co | 0 | −100,00 | 0 | |||||
| 2025-08-12 | 13F | Franklin Resources Inc | 290 762 | −2,63 | 6 408 | −3,86 | ||||
| 2025-04-28 | 13F | Redmont Wealth Advisors Llc | 53 623 | −19,89 | 1 197 | −18,08 | ||||
| 2025-08-25 | 13F/A | Promus Capital, LLC | 1 384 | 0,00 | 31 | 0,00 | ||||
| 2025-08-12 | 13F | Change Path, LLC | 98 874 | 7,45 | 2 179 | 6,14 | ||||
| 2025-07-25 | 13F | Cwm, Llc | 2 930 | 26,57 | 0 | |||||
| 2025-08-14 | 13F | Susquehanna International Group, Llp | 21 139 | −43,76 | 466 | −44,51 | ||||
| 2025-08-08 | 13F | Cetera Investment Advisers | 361 722 | 402,78 | 7 972 | 396,70 | ||||
| 2025-08-14 | 13F | Quantinno Capital Management LP | 10 893 | 240 | ||||||
| 2025-07-14 | 13F | AdvisorNet Financial, Inc | 300 | −50,66 | 7 | −53,85 | ||||
| 2025-08-14 | 13F | Susquehanna International Group, Llp | Call | 87 800 | 55,95 | 1 935 | 54,06 | |||
| 2025-07-23 | 13F | Columbus Macro, LLC | 290 704 | 6 407 | ||||||
| 2025-08-14 | 13F | Susquehanna International Group, Llp | Put | 63 100 | 50,96 | 1 391 | 49,14 | |||
| 2025-08-07 | 13F | Hodges Capital Management Inc. | 106 045 | 15,57 | 2 337 | 14,11 | ||||
| 2025-08-14 | 13F | Mariner, LLC | 28 314 | 43,75 | 624 | 42,14 | ||||
| 2025-07-21 | 13F | Ameriflex Group, Inc. | 0 | −100,00 | 0 | |||||
| 2025-07-15 | 13F | North Star Investment Management Corp. | 1 025 | 94,13 | 23 | 100,00 | ||||
| 2025-07-23 | 13F | Nbt Bank N A /ny | 30 | 0,00 | 1 | |||||
| 2025-07-28 | NP | PEX - ProShares Global Listed Private Equity ETF | 10 594 | 7,46 | 221 | −3,93 | ||||
| 2025-08-07 | 13F | Allworth Financial LP | 4 600 | 101 | ||||||
| 2025-08-14 | 13F | Raymond James Financial Inc | 286 597 | −4,66 | 6 317 | −5,86 | ||||
| 2025-08-14 | 13F | Jane Street Group, Llc | Call | 26 600 | 586 | |||||
| 2025-07-23 | 13F | Tectonic Advisors Llc | 521 686 | 18,44 | 11 498 | 16,95 | ||||
| 2025-08-14 | 13F | Jane Street Group, Llc | 20 497 | 102,28 | 452 | 99,56 | ||||
| 2025-07-24 | 13F | Ronald Blue Trust, Inc. | 3 148 | 6,24 | 69 | 4,55 | ||||
| 2025-08-14 | 13F | State Street Corp | 49 224 | 243,38 | 1 085 | 239,81 | ||||
| 2025-09-04 | 13F/A | Advisor Group Holdings, Inc. | 25 645 | −2,32 | 565 | −3,58 | ||||
| 2025-07-25 | NP | First Trust Specialty Finance & Financial Opportunities Fund This fund is a listed as child fund of First Trust Advisors Lp and if that institution has disclosed ownership in this security, then these positions will not be double counted when calculating total shares and total value | 71 000 | 0,00 | 1 478 | −10,59 | ||||
| 2025-07-11 | 13F | Farther Finance Advisors, LLC | 3 698 | 786,81 | 82 | 800,00 | ||||
| 2025-08-14 | 13F/A | Barclays Plc | 24 717 | −83,89 | 1 | −100,00 | ||||
| 2025-08-15 | 13F | Caxton Associates Llp | 14 257 | 0,00 | 314 | −1,26 | ||||
| 2025-07-31 | 13F | Sumitomo Mitsui Trust Holdings, Inc. | 172 597 | 28,63 | 3 804 | 27,05 | ||||
| 2025-08-11 | 13F | Nomura Asset Management Co Ltd | 2 135 | 58,50 | 47 | 56,67 | ||||
| 2025-08-14 | 13F | Point72 Hong Kong Ltd | 2 189 | 48 | ||||||
| 2025-03-28 | NP | ESCQX - Embark Small Cap Equity Fund Retirement Class | 398 887 | 0,00 | 8 979 | −6,92 | ||||
| 2025-07-17 | 13F | Sound Income Strategies, LLC | 702 201 | 13,99 | 15 477 | 12,56 | ||||
| 2025-08-14 | 13F | Wells Fargo & Company/mn | 12 200 | 54,82 | 269 | 53,14 | ||||
| 2025-07-22 | 13F | Grimes & Company, Inc. | 13 303 | −28,47 | 293 | −29,40 | ||||
| 2025-08-06 | 13F | First Horizon Advisors, Inc. | 2 628 | 1 214,00 | 58 | 1 325,00 | ||||
| 2025-08-11 | 13F | HHM Wealth Advisors, LLC | 500 | 0,00 | 11 | 0,00 | ||||
| 2025-08-14 | 13F | Vident Advisory, LLC | 19 087 | 6,06 | 421 | 4,74 | ||||
| 2025-08-13 | 13F | Townsquare Capital Llc | 0 | −100,00 | 0 | |||||
| 2025-08-14 | 13F | Point72 Asset Management, L.P. | 78 808 | 1 737 | ||||||
| 2025-08-12 | 13F | Argent Trust Co | 123 348 | 52,63 | 2 719 | 50,75 | ||||
| 2025-08-14 | 13F | Dearborn Partners Llc | 15 787 | −14,31 | 348 | −15,57 | ||||
| 2025-07-09 | 13F | Harbor Capital Advisors, Inc. | 0 | −100,00 | 0 | |||||
| 2025-07-31 | 13F | Cambridge Investment Research Advisors, Inc. | 28 528 | −12,17 | 1 | |||||
| 2025-05-13 | 13F | Quadrant Capital Group Llc | 0 | −100,00 | 0 | |||||
| 2025-08-12 | 13F | LPL Financial LLC | 205 640 | 4,03 | 4 532 | 2,72 | ||||
| 2025-08-12 | 13F | Aigen Investment Management, Lp | 11 822 | 261 | ||||||
| 2025-04-24 | 13F | Wingate Wealth Advisors, Inc. | 0 | −100,00 | 0 | |||||
| 2025-08-14 | 13F | Balyasny Asset Management Llc | 546 280 | −31,98 | 12 040 | −32,83 | ||||
| 2025-08-14 | 13F | Van Eck Associates Corp | 1 347 300 | 15,46 | 30 | 11,54 | ||||
| 2025-08-12 | 13F | Trexquant Investment LP | 46 630 | 1 028 | ||||||
| 2025-08-12 | 13F | Proequities, Inc. | Put | 0 | 0 | |||||
| 2025-08-12 | 13F | Proequities, Inc. | Call | 0 | 0 | |||||
| 2025-08-12 | 13F | Proequities, Inc. | 0 | 0 | ||||||
| 2025-07-31 | 13F | Oppenheimer & Co Inc | 0 | −100,00 | 0 | |||||
| 2025-08-12 | 13F | Legal & General Group Plc | 332 746 | 4,58 | 7 334 | 3,27 | ||||
| 2025-07-14 | 13F | U.S. Capital Wealth Advisors, LLC | 0 | −100,00 | 0 | |||||
| 2025-08-14 | 13F | Group One Trading, L.p. | 0 | −100,00 | 0 | −100,00 | ||||
| 2025-08-07 | 13F | Runnymede Capital Advisors, Inc. | 0 | −100,00 | 0 | |||||
| 2025-08-15 | 13F | Northeast Financial Consultants Inc | 0 | −100,00 | 0 | |||||
| 2025-07-18 | 13F | PFG Investments, LLC | 0 | −100,00 | 0 | |||||
| 2025-08-11 | 13F | Hexagon Capital Partners LLC | 0 | −100,00 | 0 | |||||
| 2025-07-22 | 13F | IMC-Chicago, LLC | Put | 10 100 | −15,83 | 223 | −16,85 | |||
| 2025-07-23 | 13F | Hager Investment Management Services, Llc | 500 | 0,00 | 11 | 0,00 | ||||
| 2025-08-14 | 13F | Quarry LP | 3 715 | 174,98 | 82 | 170,00 | ||||
| 2025-07-21 | 13F | DHJJ Financial Advisors, Ltd. | 5 | 0,00 | 0 | |||||
| 2025-08-14 | 13F | Bnp Paribas Arbitrage, Sa | 0 | −100,00 | 0 | |||||
| 2025-08-13 | 13F | Legacy Capital Wealth Partners, LLC | 59 024 | −2,02 | 1 301 | −3,27 | ||||
| 2025-08-11 | 13F | Core Wealth Partners LLC | 11 520 | 0,00 | 254 | −1,56 | ||||
| 2025-05-14 | 13F | Mml Investors Services, Llc | 0 | −100,00 | 0 | |||||
| 2025-07-24 | 13F | Us Bancorp \de\ | 13 756 | 0,00 | 303 | −1,30 | ||||
| 2025-07-21 | 13F | Mirae Asset Global Investments Co., Ltd. | 0 | −100,00 | 0 | |||||
| 2025-08-12 | 13F | AlphaCore Capital LLC | 0 | −100,00 | 0 | |||||
| 2025-05-15 | 13F | Oxford Asset Management Llp | 11 392 | 254 | ||||||
| 2025-08-13 | 13F | Guggenheim Capital Llc | 24 606 | 6,50 | 542 | 5,24 | ||||
| 2025-05-15 | 13F | Lido Advisors, LLC | 0 | −100,00 | 0 | −100,00 | ||||
| 2025-08-12 | 13F | MAI Capital Management | 3 524 | 32,53 | 78 | 30,51 | ||||
| 2025-08-05 | 13F | Dunhill Financial, LLC | 400 | 9 | ||||||
| 2025-08-14 | 13F | Colony Group, LLC | 9 272 | −1,80 | 204 | −2,86 | ||||
| 2025-08-13 | 13F/A | DLD Asset Management, LP | Put | 0 | −100,00 | 0 | ||||
| 2025-04-29 | 13F | Concurrent Investment Advisors, LLC | 0 | −100,00 | 0 | |||||
| 2025-07-11 | 13F | Kingstone Capital Partners Texas, LLC | 13 089 875 | 311 | ||||||
| 2025-08-14 | 13F | Schonfeld Strategic Advisors LLC | 66 243 | −43,64 | 1 460 | −44,38 | ||||
| 2025-08-15 | 13F | Kestra Advisory Services, LLC | 45 856 | −2,20 | 1 011 | −3,44 | ||||
| 2025-08-15 | 13F | CI Private Wealth, LLC | 0 | −100,00 | 0 | |||||
| 2025-06-25 | NP | VPC - Virtus Private Credit Strategy ETF | 40 343 | 1,45 | 822 | −8,16 | ||||
| 2025-08-05 | 13F | Huntington National Bank | 2 | 0,00 | 0 | |||||
| 2025-08-27 | 13F/A | Squarepoint Ops LLC | 11 613 | −1,76 | 256 | −3,04 | ||||
| 2025-08-14 | 13F | Point72 Asia (Singapore) Pte. Ltd. | 1 894 | 42 | ||||||
| 2025-08-14 | 13F | Evergreen Capital Management Llc | 0 | −100,00 | 0 | |||||
| 2025-08-14 | 13F | DRW Securities, LLC | 24 985 | 148,11 | 551 | 145,54 | ||||
| 2025-08-12 | 13F | BlackRock, Inc. | 320 720 | 22,49 | 7 069 | 20,94 | ||||
| 2025-08-12 | 13F | CIBC Private Wealth Group, LLC | 1 551 | −0,06 | 34 | 25,93 | ||||
| 2025-07-30 | 13F | Atlantic Edge Private Wealth Management, LLC | 200 | 0,00 | 4 | 0,00 | ||||
| 2025-08-13 | 13F | Invesco Ltd. | 34 003 | 21,84 | 749 | 20,42 | ||||
| 2025-06-30 | NP | PSP - Invesco Global Listed Private Equity ETF This fund is a listed as child fund of Invesco Ltd. and if that institution has disclosed ownership in this security, then these positions will not be double counted when calculating total shares and total value | 26 473 | −18,88 | 540 | −26,57 | ||||
| 2025-08-14 | 13F | Aquatic Capital Management LLC | 13 329 | −42,49 | 294 | −43,33 | ||||
| 2025-08-13 | 13F | Capital Analysts, Inc. | 2 685 | 2,64 | 0 | |||||
| 2025-08-14 | 13F | VPR Management LLC | 2 500 | 55 | ||||||
| 2025-07-23 | NP | FAAAX - Franklin K2 Alternative Strategies Fund Class A | Short | −612 | −37,30 | −13 | −45,45 | |||
| 2025-08-12 | 13F/A | Cozad Asset Management Inc | 49 161 | 4,26 | 1 084 | 2,95 | ||||
| 2025-06-27 | NP | LBO - WHITEWOLF Publicly Listed Private Equity ETF | 7 035 | 14,28 | 143 | 3,62 | ||||
| 2025-08-18 | 13F | Geneos Wealth Management Inc. | 1 930 | 0,00 | 43 | −2,33 | ||||
| 2025-08-13 | 13F | Northern Trust Corp | 45 690 | 286,16 | 1 007 | 281,44 | ||||
| 2025-08-15 | 13F | Zuckerman Investment Group, LLC | 460 375 | 7,81 | 10 147 | 6,45 | ||||
| 2025-08-14 | 13F | Hrt Financial Lp | 242 080 | 176,04 | 5 | 400,00 | ||||
| 2025-08-14 | 13F | Summit Trail Advisors, Llc | 10 630 | 234 | ||||||
| 2025-07-25 | 13F | Apollon Wealth Management, LLC | 23 797 | 10,69 | 524 | 9,39 | ||||
| 2025-08-14 | 13F | Qube Research & Technologies Ltd | 63 474 | −73,19 | 1 399 | −73,54 | ||||
| 2025-08-14 | 13F | Two Sigma Investments, Lp | 761 221 | −4,67 | 16 777 | −5,86 | ||||
| 2025-07-01 | 13F | Confluence Investment Management Llc | 102 107 | 0,58 | 2 250 | −0,66 | ||||
| 2025-07-23 | 13F | Mraz, Amerine & Associates, Inc. | 42 958 | −1,77 | 947 | −3,27 | ||||
| 2025-08-21 | NP | BIZD - VanEck Vectors BDC Income ETF | 1 241 902 | 11,47 | 27 372 | 10,07 | ||||
| 2025-05-05 | 13F | Lindbrook Capital, Llc | 0 | −100,00 | 0 | |||||
| 2025-08-14 | 13F | Millennium Management Llc | 526 734 | 7,72 | 11 609 | 6,37 | ||||
| 2025-08-18 | 13F | Hollencrest Capital Management | 7 055 | 2,62 | 155 | 1,31 | ||||
| 2025-08-11 | 13F | HighTower Advisors, LLC | 10 190 | 8,54 | 225 | 7,18 | ||||
| 2025-07-08 | 13F | Parallel Advisors, LLC | 4 185 | −4,93 | 92 | −6,12 | ||||
| 2025-08-07 | 13F | Campbell & CO Investment Adviser LLC | 20 873 | −2,29 | 460 | −3,36 | ||||
| 2025-05-14 | 13F | Comerica Bank | 0 | −100,00 | 0 | |||||
| 2025-05-07 | 13F | Spectrum Wealth Counsel, LLC | 230 | 0,00 | 5 | 0,00 | ||||
| 2025-08-14 | 13F | Two Sigma Advisers, Lp | 983 500 | −3,09 | 21 676 | −4,31 | ||||
| 2025-08-07 | 13F | First Dallas Securities Inc. | 77 102 | 7,20 | 1 699 | 5,86 | ||||
| 2025-05-16 | 13F | Jones Financial Companies Lllp | 0 | −100,00 | 0 | |||||
| 2025-07-18 | 13F | Generali Investments CEE, investicni spolecnost, a.s. | 12 628 | 0,00 | 278 | −1,07 | ||||
| 2025-08-28 | NP | TRIFX - Catalyst/SMH Total Return Income Fund Class A | 20 000 | 0,00 | 441 | −1,35 | ||||
| 2025-07-18 | 13F | Union Bancaire Privee, UBP SA | 14 349 | 5,08 | 45 130 | 14 745,07 | ||||
| 2025-07-22 | 13F | Autumn Glory Partners, LLC | 26 000 | 0,00 | 573 | −1,21 | ||||
| 2025-08-01 | 13F | Y-Intercept (Hong Kong) Ltd | 48 215 | 1 063 | ||||||
| 2025-08-12 | 13F | Global Retirement Partners, LLC | 12 695 | −50,37 | 280 | −50,00 | ||||
| 2025-08-14 | 13F | Bank Of America Corp /de/ | 28 036 | −54,51 | 618 | −55,13 | ||||
| 2025-08-05 | 13F | Bard Associates Inc | 17 256 | 0,00 | 380 | −1,30 | ||||
| 2025-08-13 | 13F | Lansforsakringar Fondforvaltning AB (publ) | 0 | −100,00 | 0 | |||||
| 2025-07-15 | 13F | Fortitude Family Office, LLC | 1 400 | 31 | ||||||
| 2025-08-06 | 13F | Commonwealth Equity Services, Llc | 79 788 | 2,90 | 2 | 0,00 | ||||
| 2025-08-14 | 13F | Group One Trading, L.p. | Put | 4 000 | −75,46 | 88 | −75,76 | |||
| 2025-07-03 | 13F | Garde Capital, Inc. | 2 401 | 0,00 | 53 | −1,89 | ||||
| 2025-07-09 | 13F | Epiq Partners, Llc | 266 800 | 4,46 | 5 880 | 3,16 | ||||
| 2025-07-09 | 13F | Lbmc Investment Advisors, Llc | 18 250 | 0,00 | 402 | −1,23 | ||||
| 2025-08-14 | 13F | Group One Trading, L.p. | Call | 15 300 | −19,47 | 337 | −20,52 | |||
| 2025-07-16 | 13F | Signaturefd, Llc | 2 483 | 51,96 | 55 | 50,00 | ||||
| 2025-08-13 | 13F | ExodusPoint Capital Management, LP | 24 975 | −36,13 | 1 | |||||
| 2025-07-25 | 13F | LRI Investments, LLC | 250 | 0,00 | 6 | 0,00 | ||||
| 2025-08-06 | 13F | Wedbush Securities Inc | 11 723 | 0 | ||||||
| 2025-07-31 | 13F | Washington Trust Advisors, Inc. | 5 000 | 0,00 | 110 | −0,90 | ||||
| 2025-08-14 | 13F | Sciencast Management LP | 0 | −100,00 | 0 | |||||
| 2025-08-14 | 13F | Citadel Advisors Llc | Put | 65 600 | −8,64 | 1 446 | −9,80 | |||
| 2025-07-22 | 13F | Gsa Capital Partners Llp | 17 874 | 0 | ||||||
| 2025-08-14 | 13F | Atom Investors LP | 19 751 | 435 | ||||||
| 2025-08-04 | 13F | Wolverine Asset Management Llc | Put | 25 600 | 564 | |||||
| 2025-08-13 | 13F | OMERS ADMINISTRATION Corp | 34 900 | 769 | ||||||
| 2025-08-14 | 13F | Citadel Advisors Llc | 409 241 | 22,74 | 9 020 | 21,21 | ||||
| 2025-07-28 | 13F | Mutual Advisors, LLC | 9 244 | −46,81 | 216 | −38,75 | ||||
| 2025-08-11 | 13F | Delta Asset Management Llc/tn | 70 | 0,00 | 2 | 0,00 | ||||
| 2025-07-14 | 13F | Toth Financial Advisory Corp | 600 | −10,45 | 13 | −7,14 | ||||
| 2025-08-13 | 13F | Marshall Wace, Llp | 147 162 | −40,84 | 3 243 | −41,59 | ||||
| 2025-08-15 | 13F | Great West Life Assurance Co /can/ | 51 018 | 5,74 | 1 | 0,00 | ||||
| 2025-08-01 | 13F | Envestnet Asset Management Inc | 335 718 | 639,74 | 7 399 | 631,13 | ||||
| 2025-08-08 | 13F | Larson Financial Group LLC | 1 000 | 0,00 | 22 | 0,00 | ||||
| 2025-08-14 | 13F | First Manhattan Co | 258 986 | −9,80 | 5 708 | −10,92 | ||||
| 2025-07-23 | 13F | Tcfg Wealth Management, Llc | 0 | −100,00 | 0 | |||||
| 2025-08-07 | 13F | ProShare Advisors LLC | 9 909 | 0,51 | 218 | −0,91 | ||||
| 2025-08-08 | 13F | Avantax Advisory Services, Inc. | 10 830 | −2,93 | 239 | −4,42 | ||||
| 2025-08-14 | 13F | D. E. Shaw & Co., Inc. | 26 960 | 5,42 | 594 | 4,21 | ||||
| 2025-05-14 | 13F | Virtus ETF Advisers LLC | 0 | −100,00 | 0 | |||||
| 2025-08-14 | 13F | Ameriprise Financial Inc | 69 501 | −23,33 | 1 532 | −24,36 | ||||
| 2025-08-07 | 13F | Hennion & Walsh Asset Management, Inc. | 79 511 | −38,49 | 1 752 | −39,27 | ||||
| 2025-08-14 | 13F | Palisade Capital Management Llc/nj | 10 747 | 0,00 | 237 | −1,26 | ||||
| 2025-08-08 | 13F | Foundations Investment Advisors, LLC | 118 196 | 10,80 | 2 605 | 9,45 | ||||
| 2025-08-12 | 13F | Cornerstone Wealth Management, LLC | 43 005 | 1,62 | 948 | 0,32 | ||||
| 2025-07-31 | 13F | Catalyst Capital Advisors LLC | 20 000 | 0,00 | 441 | −1,35 | ||||
| 2025-08-14 | 13F | Citadel Advisors Llc | Call | 0 | −100,00 | 0 | ||||
| 2025-08-13 | 13F | Northwestern Mutual Wealth Management Co | 4 000 | 0,00 | 88 | −1,12 | ||||
| 2025-08-04 | 13F | Spire Wealth Management | 600 | 0,00 | 13 | 0,00 |
Other Listings
| DE:SFW | 19,69 € |