Grundläggande statistik
| Institutionella ägare | 127 total, 127 long only, 0 short only, 0 long/short - change of −1,54% MRQ |
| Genomsnittlig portföljallokering | 0.0900 % - change of −7,51% MRQ |
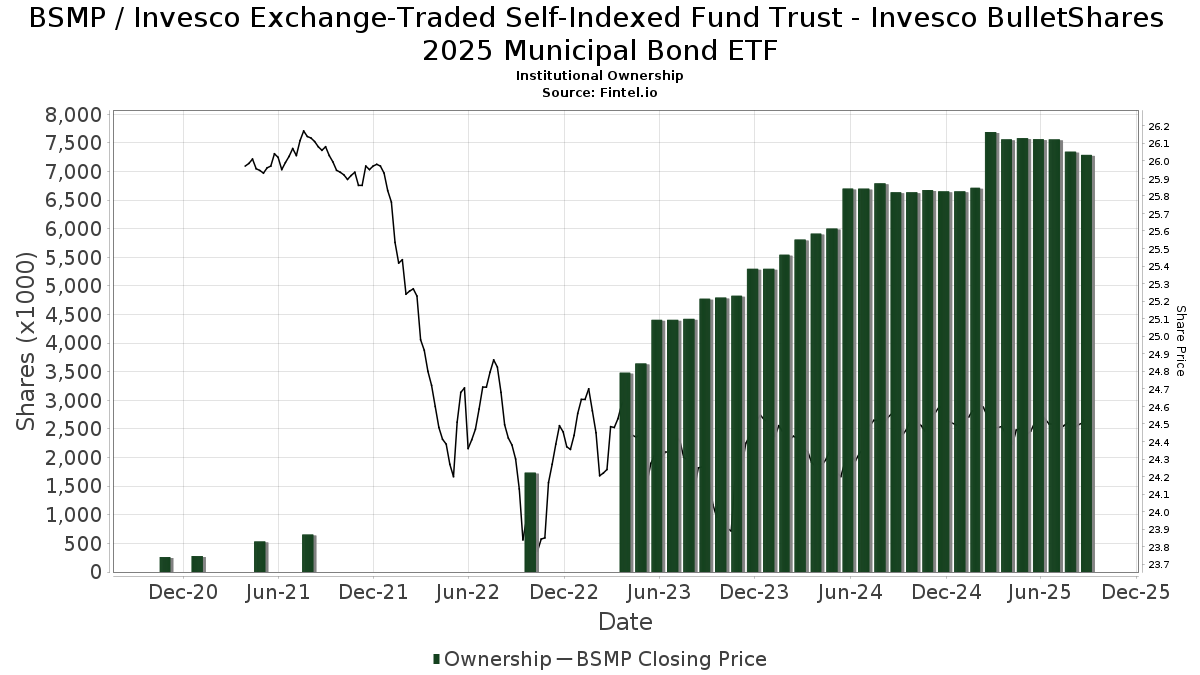
| Institutionella aktier (lång) | 7 291 619 (ex 13D/G) - change of −0,27MM shares −3,63% MRQ |
| Institutionellt värde (lång) | $ 158 308 USD ($1000) |
Institutionellt ägande och aktieägare
Invesco Exchange-Traded Self-Indexed Fund Trust - Invesco BulletShares 2025 Municipal Bond ETF (US:BSMP) har 127 Institutionella ägare och aktieägare som har lämnat in 13D/G- eller 13F-formulär till Securities Exchange Commission (SEC). Dessa institut innehar totalt 7,291,619 aktier. Största aktieägare inkluderar Wells Fargo & Company/mn, LPL Financial LLC, Bank Of America Corp /de/, Invesco Ltd., Cwm, Llc, Advisor Group Holdings, Inc., Commonwealth Equity Services, Llc, Morgan Stanley, Integrated Wealth Concepts LLC, and Envestnet Asset Management Inc .
Invesco Exchange-Traded Self-Indexed Fund Trust - Invesco BulletShares 2025 Municipal Bond ETF (NasdaqGM:BSMP) Institutionell ägarstruktur visar institutioners och fonders nuvarande positioner i företaget, samt de senaste förändringarna i positionernas storlek. Större aktieägare kan vara enskilda investerare, fonder, hedgefonder eller institutioner. Bilaga 13D visar att investeraren äger (eller ägde) mer än 5% av företaget och avser (eller avsåg) att aktivt eftersträva en förändring av affärsstrategin. Schedule 13G indikerar en passiv investering på över 5%.
The share price as of September 12, 2025 is 24,54 / share. Previously, on September 16, 2024, the share price was 24,54 / share. This represents an increase of 0,00% over that period.
Fondsentimentets poäng
Fondsentimentet poängen(fka Ägarackumulation-poäng) visar vilka aktier som är mest köpta av fonder. Det är resultatet av en sofistikerad kvantitativ flerfaktormodell som identifierar företag med de högsta nivåerna av institutionell ackumulering. Poängsättningsmodellen använder en kombination av den totala ökningen av redovisade ägare, förändringarna i portföljallokeringarna för dessa ägare och andra mått. Siffran sträcker sig från 0 till 100, där högre siffror indikerar en högre nivå av ackumulering i förhållande till sina konkurrenter, och 50 är genomsnittet.
Uppdateringsfrekvens: Dagligen
Se Ownership Explorer, som innehåller en lista över de högst rankade företagen.
Institutionell sälj/köp-kvot
Förutom att rapportera vanliga eget kapital- och skuldemissioner måste institutioner med mer än 100MM tillgångar under förvaltning också avslöja sina innehav av sälj- och köpoptioner. Eftersom säljoptioner i allmänhet indikerar ett negativt sentiment och köpoptioner indikerar ett positivt sentiment, kan vi få en uppfattning om det övergripande institutionella sentimentet genom att plotta förhållandet mellan säljoptioner och köpoptioner. Diagrammet till höger visar det historiska förhållandet mellan sälj- och köpoptioner för detta instrument.
Genom att använda sälj/köp-kvoten som en indikator på aktieägarnas sentiment undviker man en av de största bristerna med att använda det totala institutionella ägandet, nämligen att en betydande del av de förvaltade tillgångarna investeras passivt för att följa index. Passivt förvaltade fonder köper vanligtvis inte optioner, så indikatorn för sälj/köp-kvoten ger en bättre bild av stämningen i aktivt förvaltade fonder.
13F- och NPORT-arkiveringar
Detaljer om 13F-arkiveringar är gratis. Detaljer om NP-arkiveringar kräver ett premiummedlemskap. Gröna rader indikerar nya positioner. Röda rader indikerar stängda positioner. Klicka på länk symbolen för att se hela transaktionshistoriken.
Uppgradera
för att låsa upp premiumdata och exportera till Excel ![]() .
.
| Fil Datum | Källa | Investerare | Typ | Genomsnittligt pris (beräknat) |
Aktier | Δ Aktier (%) |
Rapporterat värde (1000 USD) |
Δ Värde (%) |
Portföljallokering (%) |
|
|---|---|---|---|---|---|---|---|---|---|---|
| 2025-07-10 | 13F | Sterling Financial Group, Inc. | 17 228 | −3,87 | 423 | −3,65 | ||||
| 2025-08-06 | 13F | Commonwealth Equity Services, Llc | 213 595 | −16,55 | 5 | −16,67 | ||||
| 2025-08-12 | 13F | Wayfinding Financial, LLC | 0 | −100,00 | 0 | |||||
| 2025-07-09 | 13F | Central Valley Advisors, Llc | 175 492 | −1,44 | 4 307 | −1,19 | ||||
| 2025-08-14 | 13F | Tennessee Valley Asset Management Partners | 0 | −100,00 | 0 | |||||
| 2025-07-11 | 13F | Farther Finance Advisors, LLC | 2 369 | 136,90 | 58 | 141,67 | ||||
| 2025-08-12 | 13F | Proequities, Inc. | 0 | 0 | ||||||
| 2025-07-10 | 13F | Focus Financial Network, Inc. | 58 699 | −39,26 | 1 440 | −39,11 | ||||
| 2025-07-21 | 13F | Precedent Wealth Partners, Llc | 77 108 | −7,69 | 1 892 | −7,44 | ||||
| 2025-08-13 | 13F | VestGen Advisors, LLC | 33 942 | −11,28 | 832 | −11,22 | ||||
| 2025-07-28 | 13F | Harbour Investments, Inc. | 17 594 | 0,67 | 432 | 0,94 | ||||
| 2025-08-01 | 13F | Envestnet Asset Management Inc | 189 367 | −31,78 | 4 647 | −31,61 | ||||
| 2025-08-14 | 13F | Royal Bank Of Canada | 40 068 | −7,50 | 983 | −7,26 | ||||
| 2025-07-14 | 13F | CRA Financial Services, LLC | 10 000 | 0,00 | 245 | 0,41 | ||||
| 2025-08-14 | 13F | Integrated Wealth Concepts LLC | 193 682 | 0,76 | 4 753 | 1,00 | ||||
| 2025-08-11 | 13F | Aptus Capital Advisors, LLC | 87 334 | 0,67 | 2 143 | 0,94 | ||||
| 2025-07-28 | 13F | Tlwm | 21 694 | 0,00 | 532 | 0,19 | ||||
| 2025-08-08 | 13F | Cetera Investment Advisers | 13 572 | 6,87 | 333 | 7,42 | ||||
| 2025-08-11 | 13F | HighTower Advisors, LLC | 74 986 | 16,97 | 1 840 | 17,27 | ||||
| 2025-08-12 | 13F | Kohmann Bosshard Financial Services, LLC | 10 088 | 0,00 | 248 | 0,41 | ||||
| 2025-08-06 | 13F | ORBA Wealth Advisors, L.L.C. | 20 000 | 0,00 | 491 | 0,20 | ||||
| 2025-08-14 | 13F | Aqr Capital Management Llc | 35 179 | −13,40 | 863 | −13,18 | ||||
| 2025-09-04 | 13F/A | Advisor Group Holdings, Inc. | 234 154 | −6,71 | 5 746 | −6,48 | ||||
| 2025-07-24 | 13F | IFP Advisors, Inc | 0 | −100,00 | 0 | |||||
| 2025-08-11 | 13F | Elequin Capital Lp | 0 | −100,00 | 0 | |||||
| 2025-08-14 | 13F | Warren Averett Asset Management, LLC | 17 205 | −2,76 | 422 | −2,54 | ||||
| 2025-08-08 | 13F | Meridian Wealth Management, LLC | 31 596 | 0,00 | 775 | 0,26 | ||||
| 2025-07-22 | 13F | Marietta Wealth Management, LLC | 20 380 | 500 | ||||||
| 2025-08-12 | 13F | YANKCOM Partnership | 13 062 | −5,57 | 321 | −5,33 | ||||
| 2025-07-15 | 13F | Accurate Wealth Management, LLC | 28 084 | 688 | ||||||
| 2025-07-11 | 13F | AA Financial Advisors, LLC | 29 632 | 0,04 | 727 | 0,28 | ||||
| 2025-08-14 | 13F | Wells Fargo & Company/mn | 627 406 | −9,78 | 15 397 | −9,56 | ||||
| 2025-07-23 | 13F | WESPAC Advisors, LLC | 17 328 | 0,00 | 425 | 0,24 | ||||
| 2025-07-21 | 13F | Crews Bank & Trust | 7 360 | 0,00 | 181 | 0,00 | ||||
| 2025-08-12 | 13F | Cornerstone Wealth Management, LLC | 44 214 | 0,84 | 1 085 | 1,12 | ||||
| 2025-07-29 | 13F | Stephens Inc /ar/ | 0 | −100,00 | 0 | |||||
| 2025-08-14 | 13F | Jane Street Group, Llc | 101 564 | 37,77 | 2 492 | 38,14 | ||||
| 2025-07-30 | 13F | Brookstone Capital Management | 8 406 | 1,05 | 206 | 1,48 | ||||
| 2025-08-14 | 13F | Ameriprise Financial Inc | 15 744 | 0,13 | 386 | 0,52 | ||||
| 2025-08-11 | 13F | PAX Financial Group, LLC | 45 880 | −12,73 | 1 126 | −12,52 | ||||
| 2025-08-05 | 13F | Hills Bank & Trust Co | 93 899 | 12,53 | 2 304 | 12,83 | ||||
| 2025-08-01 | 13F | First Command Advisory Services, Inc. | 45 374 | 11,73 | 1 113 | 11,97 | ||||
| 2025-08-12 | 13F | Northeast Planning Associates, Inc. / Nh / | 17 580 | −6,57 | 431 | −6,30 | ||||
| 2025-08-19 | 13F | Anchor Investment Management, LLC | 3 000 | 0,00 | 74 | 0,00 | ||||
| 2025-08-08 | 13F | Pnc Financial Services Group, Inc. | 67 026 | −56,78 | 1 645 | −56,69 | ||||
| 2025-08-06 | 13F | Paulson Wealth Management Inc. | 41 218 | −7,81 | 1 011 | −7,59 | ||||
| 2025-07-08 | 13F | Webster Bank, N. A. | 41 999 | −13,72 | 1 031 | −13,52 | ||||
| 2025-07-10 | 13F | Wealth Enhancement Advisory Services, Llc | 18 605 | 0,00 | 456 | 0,22 | ||||
| 2025-07-18 | 13F | Foundry Financial Group, Inc. | 8 200 | 0,00 | 201 | 0,50 | ||||
| 2025-07-16 | 13F | Tassel Capital Management, Inc. | 16 537 | 0,67 | 406 | 0,75 | ||||
| 2025-07-24 | 13F | Leo Wealth, LLC | 22 066 | 542 | ||||||
| 2025-07-31 | 13F | Resonant Capital Advisors, LLC | 60 261 | −3,13 | 1 479 | −2,89 | ||||
| 2025-05-06 | 13F | Rsm Us Wealth Management Llc | 0 | −100,00 | 0 | |||||
| 2025-08-13 | 13F | Vermillion & White Wealth Management Group, LLC | 24 396 | −27,68 | 599 | −27,52 | ||||
| 2025-07-25 | 13F | Hobbs Group Advisors, LLC | 15 569 | −53,54 | 382 | −53,41 | ||||
| 2025-08-07 | 13F | Resources Investment Advisors, LLC. | 20 818 | 4,07 | 511 | 4,29 | ||||
| 2025-08-12 | 13F | Reliant Wealth Planning | 83 356 | 2 046 | ||||||
| 2025-07-10 | 13F | Voisard Asset Management Group, Inc. | 19 686 | −39,64 | 483 | −39,47 | ||||
| 2025-08-12 | 13F | Farmers National Bank | 49 121 | −1,27 | 1 205 | −1,07 | ||||
| 2025-08-13 | 13F | Capital Analysts, Inc. | 2 130 | 0,00 | 0 | |||||
| 2025-08-13 | 13F | Denver Wealth Management, Inc. | 37 939 | −25,65 | 931 | −25,46 | ||||
| 2025-07-15 | 13F | Garrett Investment Advisors LLC | 42 830 | −34,92 | 1 051 | −34,72 | ||||
| 2025-08-13 | 13F | Cary Street Partners Financial Llc | 0 | −100,00 | 0 | −100,00 | ||||
| 2025-08-12 | 13F | OneAscent Financial Services LLC | 189 175 | −5,29 | 5 | 0,00 | ||||
| 2025-07-31 | 13F | Leavell Investment Management, Inc. | 9 415 | 0,00 | 231 | 0,43 | ||||
| 2025-07-25 | 13F | We Are One Seven, LLC | 0 | −100,00 | 0 | |||||
| 2025-08-15 | 13F | Captrust Financial Advisors | 9 996 | 0,00 | 245 | 0,41 | ||||
| 2025-08-06 | 13F | Atlantic Union Bankshares Corp | 180 338 | 11,00 | 4 425 | 11,26 | ||||
| 2025-04-11 | 13F | Davis Capital Management | 7 113 | −61,62 | 174 | −61,67 | ||||
| 2025-08-13 | 13F | Level Four Advisory Services, Llc | 9 912 | −0,65 | 243 | −0,41 | ||||
| 2025-07-16 | 13F | Signaturefd, Llc | 11 417 | 0,00 | 280 | 0,36 | ||||
| 2025-08-14 | 13F | Colony Group, LLC | 85 616 | 4,59 | 2 101 | 4,89 | ||||
| 2025-08-14 | 13F | IHT Wealth Management, LLC | 10 194 | 0,00 | 250 | 0,40 | ||||
| 2025-05-15 | 13F | Creative Planning | 0 | −100,00 | 0 | |||||
| 2025-08-12 | 13F | Heritage Trust Co | 10 949 | 0,00 | 269 | 0,00 | ||||
| 2025-08-13 | 13F | Brown Advisory Inc | 33 004 | 0,00 | 810 | 0,25 | ||||
| 2025-08-13 | 13F | Transce3nd, LLC | 394 | 0,00 | 10 | 0,00 | ||||
| 2025-08-01 | 13F | Koss-Olinger Consulting, LLC | 29 864 | 187,40 | 733 | 188,19 | ||||
| 2025-08-14 | 13F | Fmr Llc | 1 | −99,53 | 0 | −100,00 | ||||
| 2025-08-13 | 13F | Flow Traders U.s. Llc | 12 418 | −24,74 | 0 | |||||
| 2025-08-05 | 13F | Sigma Planning Corp | 0 | −100,00 | 0 | |||||
| 2025-08-11 | 13F | Principal Securities, Inc. | 2 801 | −26,29 | 69 | −26,88 | ||||
| 2025-07-14 | 13F | Clear Harbor Asset Management, LLC | 19 455 | 0,20 | 477 | 0,42 | ||||
| 2025-08-12 | 13F | Jpmorgan Chase & Co | 0 | −100,00 | 0 | |||||
| 2025-07-25 | 13F | Cwm, Llc | 267 949 | −3,60 | 7 | 0,00 | ||||
| 2025-07-07 | 13F | Horizons Wealth Management | 13 274 | 0,00 | 326 | 0,31 | ||||
| 2025-08-14 | 13F | GWM Advisors LLC | 149 126 | 5,61 | 3 660 | 5,87 | ||||
| 2025-08-04 | 13F | AlphaStar Capital Management, LLC | 44 786 | 14,09 | 1 099 | 14,48 | ||||
| 2025-05-14 | 13F | Comerica Bank | 0 | −100,00 | 0 | |||||
| 2025-07-22 | 13F | Knights of Columbus Asset Advisors LLC | 6 840 | 0,00 | 168 | 0,00 | ||||
| 2025-07-28 | 13F | BRYN MAWR TRUST Co | 4 063 | 100 | ||||||
| 2025-08-05 | 13F | Key FInancial Inc | 140 705 | 7,65 | 3 453 | 7,91 | ||||
| 2025-08-12 | 13F | Jacobi Capital Management LLC | 11 777 | 24,93 | 289 | 25,22 | ||||
| 2025-08-19 | 13F | Advisory Services Network, LLC | 11 595 | 23,34 | 284 | 23,04 | ||||
| 2025-08-13 | 13F | Jones Financial Companies Lllp | 12 629 | 103,89 | 310 | 104,64 | ||||
| 2025-08-13 | 13F | Northwestern Mutual Wealth Management Co | 117 878 | 8,85 | 2 893 | 9,13 | ||||
| 2025-08-14 | 13F | EP Wealth Advisors, Inc. | 15 022 | −29,46 | 369 | −29,37 | ||||
| 2025-08-13 | 13F | Beacon Pointe Advisors, LLC | 32 536 | −0,61 | 798 | −0,37 | ||||
| 2025-08-14 | 13F | Diversify Advisory Services, LLC | 9 686 | 0,00 | 237 | 0,42 | ||||
| 2025-08-13 | 13F | MONECO Advisors, LLC | 114 183 | 20,68 | 2 802 | 20,98 | ||||
| 2025-04-14 | 13F | Midland Wealth Advisors Llc | 0 | −100,00 | 0 | |||||
| 2025-08-01 | 13F | Clark Asset Management, LLC | 10 065 | 247 | ||||||
| 2025-08-14 | 13F | Bank Of America Corp /de/ | 312 416 | 8,18 | 7 667 | 8,45 | ||||
| 2025-07-01 | 13F | Confluence Investment Management Llc | 106 632 | −3,10 | 2 617 | −2,86 | ||||
| 2025-08-14 | 13F | Stifel Financial Corp | 25 178 | 46,30 | 618 | 46,56 | ||||
| 2025-07-25 | 13F | Astoria Portfolio Advisors LLC. | 31 633 | −23,08 | 773 | −22,85 | ||||
| 2025-08-14 | 13F | Raymond James Financial Inc | 148 620 | 9,13 | 3 647 | 9,42 | ||||
| 2025-08-26 | 13F/A | Thrivent Financial For Lutherans | 69 972 | 2 | ||||||
| 2025-07-14 | 13F | Masso Torrence Wealth Management Inc. | 11 075 | −55,76 | 272 | −55,72 | ||||
| 2025-08-11 | 13F | Private Advisor Group, LLC | 32 042 | 0,23 | 786 | 0,51 | ||||
| 2025-07-30 | 13F | Eqis Capital Management, Inc. | 10 690 | −4,90 | 262 | −4,73 | ||||
| 2025-08-05 | 13F | Claro Advisors LLC | 0 | −100,00 | 0 | |||||
| 2025-08-14 | 13F | Mml Investors Services, Llc | 83 409 | 19,88 | 2 | 100,00 | ||||
| 2025-08-07 | 13F | Addison Advisors LLC | 9 720 | −15,07 | 239 | −15,00 | ||||
| 2025-07-22 | 13F | Kickstand Ventures, Llc. | 14 123 | −9,43 | 347 | −9,19 | ||||
| 2025-07-14 | 13F | Sentinel Pension Advisors Inc | 33 869 | −8,39 | 831 | −8,18 | ||||
| 2025-07-22 | 13F | Duncan Williams Asset Management, LLC | 14 123 | 347 | ||||||
| 2025-08-06 | 13F | Savant Capital, LLC | 47 563 | −22,22 | 1 167 | −21,99 | ||||
| 2025-08-11 | 13F | Howard Wealth Management, Llc | 12 257 | 0,59 | 301 | 0,67 | ||||
| 2025-04-21 | 13F | Nelson, Van Denburg & Campbell Wealth Management Group, LLC | 0 | −100,00 | 0 | |||||
| 2025-04-23 | 13F | Creative Financial Designs Inc /adv | 0 | −100,00 | 0 | |||||
| 2025-08-19 | 13F | Asset Dedication, LLC | 116 560 | 16,31 | 2 860 | 16,59 | ||||
| 2025-03-25 | 13F | Higgins & Schmidt Wealth Strategies LLC | 0 | −100,00 | 0 | −100,00 | ||||
| 2025-08-05 | 13F | Huntington National Bank | 239 | −7,75 | ||||||
| 2025-04-15 | 13F | Collier Financial | 10 615 | −20,22 | 260 | −20,55 | ||||
| 2025-08-13 | 13F | Invesco Ltd. | 290 279 | 7,07 | 7 123 | 7,34 | ||||
| 2025-08-25 | 13F | Silverlake Wealth Management Llc | 11 024 | 0,00 | 271 | 0,37 | ||||
| 2025-08-12 | 13F | MAI Capital Management | 2 542 | 0,20 | 62 | 0,00 | ||||
| 2025-08-15 | 13F | Equitable Holdings, Inc. | 53 422 | 14,00 | 1 311 | 14,21 | ||||
| 2025-07-14 | 13F | AdvisorNet Financial, Inc | 929 | 0,00 | 23 | 0,00 | ||||
| 2025-08-14 | 13F | Citadel Advisors Llc | 0 | −100,00 | 0 | |||||
| 2025-07-16 | 13F | ORG Partners LLC | 850 | 0,00 | 21 | 0,00 | ||||
| 2025-08-05 | 13F | Fourth Dimension Wealth, LLC | 26 314 | 12,10 | 646 | 12,37 | ||||
| 2025-08-15 | 13F | Morgan Stanley | 206 652 | −16,44 | 5 071 | −16,24 | ||||
| 2025-07-25 | 13F | Bill Few Associates, Inc. | 8 813 | 0,00 | 216 | 0,47 | ||||
| 2025-08-18 | 13F | Geneos Wealth Management Inc. | 375 | 0,00 | 9 | 0,00 | ||||
| 2025-08-12 | 13F | LPL Financial LLC | 431 703 | 7,83 | 10 594 | 8,09 | ||||
| 2025-08-13 | 13F | StoneX Group Inc. | 22 504 | −20,51 | 552 | −20,35 | ||||
| 2025-08-13 | 13F | Lido Advisors, LLC | 35 354 | 0,00 | 868 | 0,23 | ||||
| 2025-07-21 | 13F | Old Second National Bank Of Aurora | 30 231 | −10,25 | 742 | −10,07 | ||||
| 2025-07-21 | 13F | River Street Advisors LLC | 14 943 | −3,82 | 367 | −3,68 | ||||
| 2025-07-29 | 13F | Private Trust Co Na | 14 425 | −65,14 | 354 | −65,12 | ||||
| 2025-07-31 | 13F | Carnegie Capital Asset Management, LLC | 27 270 | −51,92 | 669 | −51,70 | ||||
| 2025-08-14 | 13F | Glen Eagle Advisors, LLC | 1 | −99,70 | 0 | −100,00 | ||||
| 2025-08-08 | 13F | Larson Financial Group LLC | 5 132 | 0,00 | 126 | 0,00 | ||||
| 2025-08-14 | 13F | UBS Group AG | 159 561 | −14,49 | 3 916 | −14,30 | ||||
| 2025-05-12 | 13F | Independent Advisor Alliance | 0 | −100,00 | 0 | |||||
| 2025-08-14 | 13F | Old Mission Capital Llc | 9 000 | 221 |