Grundläggande statistik
| Institutionella ägare | 242 total, 240 long only, 1 short only, 1 long/short - change of 9,01% MRQ |
| Genomsnittlig portföljallokering | 0.2121 % - change of −12,04% MRQ |
| Institutionella aktier (lång) | 35 358 901 (ex 13D/G) - change of 4,49MM shares 14,54% MRQ |
| Institutionellt värde (lång) | $ 549 472 USD ($1000) |
Institutionellt ägande och aktieägare
VanEck ETF Trust - VanEck BDC Income ETF (US:BIZD) har 242 Institutionella ägare och aktieägare som har lämnat in 13D/G- eller 13F-formulär till Securities Exchange Commission (SEC). Dessa institut innehar totalt 35,358,901 aktier. Största aktieägare inkluderar Bank Of America Corp /de/, Morgan Stanley, LPL Financial LLC, Wells Fargo & Company/mn, UBS Group AG, Mission Hills Financial Advisory, LLC, Condor Capital Management, Haven Private, LLC, Kestra Advisory Services, LLC, and Clark Capital Management Group, Inc. .
VanEck ETF Trust - VanEck BDC Income ETF (ARCA:BIZD) Institutionell ägarstruktur visar institutioners och fonders nuvarande positioner i företaget, samt de senaste förändringarna i positionernas storlek. Större aktieägare kan vara enskilda investerare, fonder, hedgefonder eller institutioner. Bilaga 13D visar att investeraren äger (eller ägde) mer än 5% av företaget och avser (eller avsåg) att aktivt eftersträva en förändring av affärsstrategin. Schedule 13G indikerar en passiv investering på över 5%.
The share price as of September 19, 2025 is 15,68 / share. Previously, on September 23, 2024, the share price was 16,52 / share. This represents a decline of 5,08% over that period.

Fondsentimentets poäng
Fondsentimentet poängen(fka Ägarackumulation-poäng) visar vilka aktier som är mest köpta av fonder. Det är resultatet av en sofistikerad kvantitativ flerfaktormodell som identifierar företag med de högsta nivåerna av institutionell ackumulering. Poängsättningsmodellen använder en kombination av den totala ökningen av redovisade ägare, förändringarna i portföljallokeringarna för dessa ägare och andra mått. Siffran sträcker sig från 0 till 100, där högre siffror indikerar en högre nivå av ackumulering i förhållande till sina konkurrenter, och 50 är genomsnittet.
Uppdateringsfrekvens: Dagligen
Se Ownership Explorer, som innehåller en lista över de högst rankade företagen.
AI+ Ask Fintel’s AI assistant about VanEck ETF Trust - VanEck BDC Income ETF.
Thinking of good questions…
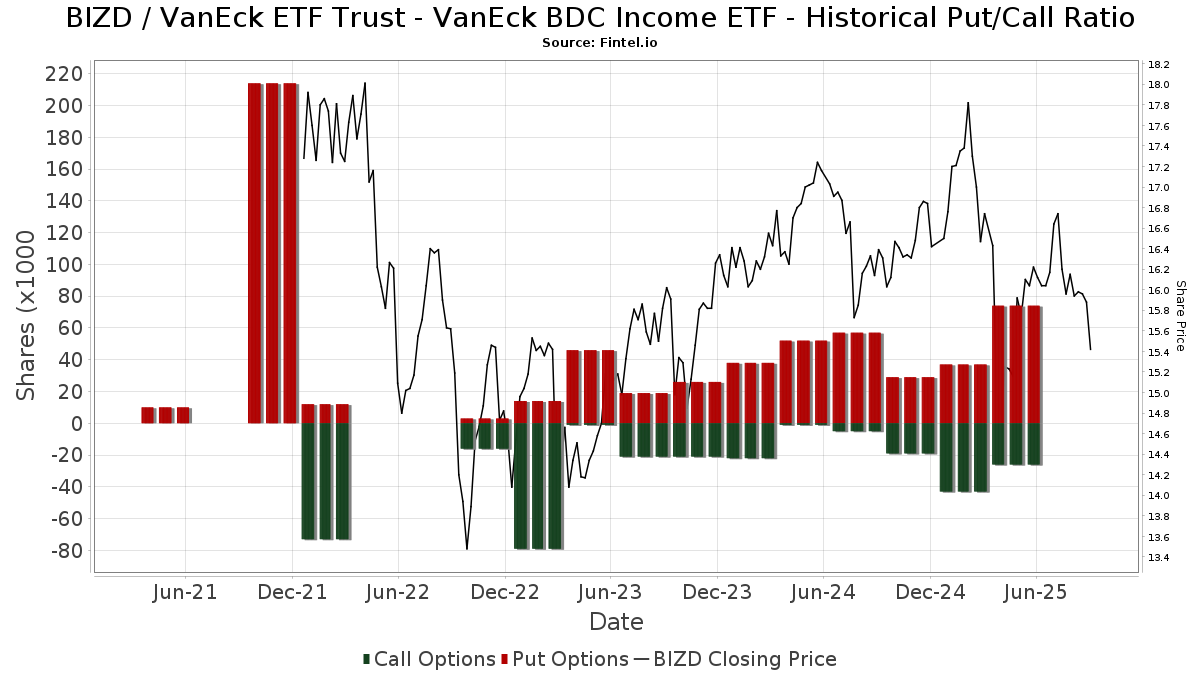
Institutionell sälj/köp-kvot
Förutom att rapportera vanliga eget kapital- och skuldemissioner måste institutioner med mer än 100MM tillgångar under förvaltning också avslöja sina innehav av sälj- och köpoptioner. Eftersom säljoptioner i allmänhet indikerar ett negativt sentiment och köpoptioner indikerar ett positivt sentiment, kan vi få en uppfattning om det övergripande institutionella sentimentet genom att plotta förhållandet mellan säljoptioner och köpoptioner. Diagrammet till höger visar det historiska förhållandet mellan sälj- och köpoptioner för detta instrument.
Genom att använda sälj/köp-kvoten som en indikator på aktieägarnas sentiment undviker man en av de största bristerna med att använda det totala institutionella ägandet, nämligen att en betydande del av de förvaltade tillgångarna investeras passivt för att följa index. Passivt förvaltade fonder köper vanligtvis inte optioner, så indikatorn för sälj/köp-kvoten ger en bättre bild av stämningen i aktivt förvaltade fonder.
13F- och NPORT-arkiveringar
Detaljer om 13F-arkiveringar är gratis. Detaljer om NP-arkiveringar kräver ett premiummedlemskap. Gröna rader indikerar nya positioner. Röda rader indikerar stängda positioner. Klicka på länk symbolen för att se hela transaktionshistoriken.
Uppgradera
för att låsa upp premiumdata och exportera till Excel ![]() .
.
| Fil Datum | Källa | Investerare | Typ | Genomsnittligt pris (beräknat) |
Aktier | Δ Aktier (%) |
Rapporterat värde (1000 USD) |
Δ Värde (%) |
Portföljallokering (%) |
|
|---|---|---|---|---|---|---|---|---|---|---|
| 2025-08-05 | 13F | Bard Associates Inc | 501 955 | 1 003,80 | 8 172 | 972,31 | ||||
| 2025-08-13 | 13F | Townsquare Capital Llc | 40 869 | −85,09 | 665 | −85,52 | ||||
| 2025-07-31 | 13F | Gill Capital Partners, Llc | 10 797 | 0,00 | 176 | −2,78 | ||||
| 2025-06-10 | 13F | Birchbrook, Inc. | 0 | −100,00 | 0 | −100,00 | ||||
| 2025-07-23 | 13F | Sax Wealth Advisors, Llc | 112 475 | 43,87 | 1 831 | 39,77 | ||||
| 2025-07-18 | 13F | Centricity Wealth Management, LLC | 2 330 | −67,77 | 38 | −69,42 | ||||
| 2025-08-07 | 13F | Apeiron RIA LLC | 17 978 | −2,49 | 293 | −5,19 | ||||
| 2025-08-12 | 13F | Steward Partners Investment Advisory, Llc | 351 595 | −25,00 | 5 724 | −27,15 | ||||
| 2025-07-11 | 13F | Great Waters Wealth Management | 12 186 | 0,00 | 198 | −2,94 | ||||
| 2025-08-07 | 13F | Allworth Financial LP | 13 300 | 217 | ||||||
| 2025-08-14 | 13F | Financial Network Wealth Advisors LLC | 4 358 | 3,52 | 71 | 0,00 | ||||
| 2025-07-30 | 13F | D.a. Davidson & Co. | 11 820 | −0,84 | 192 | −3,52 | ||||
| 2025-08-05 | 13F | Bank Of Montreal /can/ | 110 | 2 | ||||||
| 2025-08-26 | NP | MCTOX - Modern Capital Tactical Opportunities Fund Class A Shares | 90 000 | 1 467 | ||||||
| 2025-05-06 | 13F | Alpha Omega Group, Inc. | 261 934 | 19,07 | 4 390 | 20,01 | ||||
| 2025-08-12 | 13F | Change Path, LLC | 127 595 | −10,73 | 2 077 | −13,28 | ||||
| 2025-05-09 | 13F | AXS Investments LLC | 0 | −100,00 | 0 | |||||
| 2025-08-08 | 13F | Wealth Alliance | 41 691 | 4,39 | 679 | 1,35 | ||||
| 2025-05-15 | 13F | D. E. Shaw & Co., Inc. | 0 | −100,00 | 0 | −100,00 | ||||
| 2025-08-11 | 13F | Howard Wealth Management, Llc | 100 873 | 27,85 | 1 642 | 24,21 | ||||
| 2025-08-01 | 13F | Gwn Securities Inc. | 0 | −100,00 | 0 | |||||
| 2025-08-06 | 13F | Stonebridge Financial Planning Group, LLC | 120 356 | 23,12 | 1 959 | 19,60 | ||||
| 2025-08-01 | 13F | Delta Investment Management, LLC | 178 328 | 10,02 | 2 903 | 6,89 | ||||
| 2025-08-12 | 13F | Cynosure Management, Llc | 156 439 | 2,09 | 2 547 | −0,86 | ||||
| 2025-08-14 | 13F | Two Sigma Investments, Lp | 0 | −100,00 | 0 | |||||
| 2025-07-30 | 13F | Whittier Trust Co Of Nevada Inc | 65 724 | 0,00 | 1 069 | −2,82 | ||||
| 2025-07-21 | 13F | Future Financial Wealth Managment LLC | 85 774 | −10,81 | 1 396 | −13,35 | ||||
| 2025-08-12 | 13F | Coldstream Capital Management Inc | 0 | −100,00 | 0 | |||||
| 2025-08-29 | NP | CGHIX - Timber Point Global Allocations Fund Institutional Class Shares | 10 000 | 163 | ||||||
| 2025-07-29 | 13F | Koshinski Asset Management, Inc. | 10 190 | 0,00 | 166 | −2,94 | ||||
| 2025-05-01 | 13F | Ballentine Partners, LLC | 0 | −100,00 | 0 | −100,00 | ||||
| 2025-07-21 | 13F | Credential Qtrade Securities Inc. | 0 | −100,00 | 0 | −100,00 | ||||
| 2025-08-14 | 13F | Bnp Paribas Arbitrage, Sa | 15 | −86,73 | 0 | −100,00 | ||||
| 2025-07-08 | 13F | Parallel Advisors, LLC | 427 | 7 | ||||||
| 2025-08-14 | 13F | Goldman Sachs Group Inc | 12 944 | −74,83 | 211 | −75,61 | ||||
| 2025-07-28 | 13F | J.Safra Asset Management Corp | 91 140 | 1 476 | ||||||
| 2025-07-29 | 13F | Salomon & Ludwin, LLC | 917 | 0,00 | 15 | −6,67 | ||||
| 2025-05-30 | NP | ERNZ - TrueShares Active Yield ETF | 224 919 | 1 108,66 | 3 770 | 1 119,74 | ||||
| 2025-08-08 | 13F | Beck Bode, LLC | 12 080 | −37,07 | 197 | −38,94 | ||||
| 2025-05-15 | 13F | Talon Private Wealth, LLC | 0 | −100,00 | 0 | −100,00 | ||||
| 2025-07-25 | 13F | Astoria Portfolio Advisors LLC. | 11 760 | 196 | ||||||
| 2025-08-14 | 13F | Mariner, LLC | 300 265 | 10,60 | 4 888 | 7,31 | ||||
| 2025-09-04 | 13F/A | Advisor Group Holdings, Inc. | 538 746 | 3,34 | 8 777 | 0,45 | ||||
| 2025-07-23 | 13F | Citizens National Bank Trust Department | 50 | 0,00 | 1 | |||||
| 2025-08-06 | 13F | Commonwealth Equity Services, Llc | 375 874 | 1,01 | 6 | 0,00 | ||||
| 2025-08-04 | 13F | Creekmur Asset Management LLC | 4 | 0,00 | 0 | |||||
| 2025-04-28 | 13F | Strategic Financial Concepts, LLC | 0 | −100,00 | 0 | −100,00 | ||||
| 2025-07-28 | 13F | Bridges Investment Management Inc | 105 767 | 9,32 | 1 722 | 6,17 | ||||
| 2025-08-12 | 13F | Putnam Fl Investment Management Co | 259 429 | 238,30 | 4 224 | 228,64 | ||||
| 2025-07-31 | 13F | Pacitti Group Inc. | 58 587 | 7,93 | 954 | 4,84 | ||||
| 2025-07-11 | 13F | Farther Finance Advisors, LLC | 1 369 | 22 | ||||||
| 2025-07-14 | 13F | Park Avenue Securities Llc | 123 164 | 2 | ||||||
| 2025-08-29 | NP | AIIFX - Timber Point Alternative Income Fund Institutional Class Shares | 20 000 | 326 | ||||||
| 2025-08-14 | 13F | Wells Fargo & Company/mn | 2 143 936 | 32,93 | 34 903 | 29,13 | ||||
| 2025-08-14 | 13F | GWM Advisors LLC | 380 160 | 104,17 | 6 189 | 98,33 | ||||
| 2025-08-12 | 13F | Proequities, Inc. | 0 | 0 | ||||||
| 2025-08-14 | 13F | Integrated Wealth Concepts LLC | 22 649 | 83,69 | 369 | 78,64 | ||||
| 2025-07-31 | 13F | Sage Mountain Advisors LLC | 20 804 | −43,24 | 339 | −44,95 | ||||
| 2025-08-14 | 13F | CoreCap Advisors, LLC | 3 676 | 4,70 | 60 | 1,72 | ||||
| 2025-05-12 | 13F | Independent Advisor Alliance | 0 | −100,00 | 0 | |||||
| 2025-07-31 | 13F | Oppenheimer & Co Inc | 14 347 | 0,00 | 234 | −2,92 | ||||
| 2025-08-06 | 13F | Moors & Cabot, Inc. | 14 350 | 20,08 | 234 | 16,50 | ||||
| 2025-08-12 | 13F | CIBC Private Wealth Group, LLC | 49 807 | −10,91 | 811 | 3,85 | ||||
| 2025-07-16 | 13F | Register Financial Advisors LLC | 19 545 | 0,11 | 318 | −2,75 | ||||
| 2025-08-13 | 13F | OMERS ADMINISTRATION Corp | 0 | −100,00 | 0 | |||||
| 2025-08-14 | 13F | Napa Wealth Management | 42 639 | −38,74 | 694 | −40,48 | ||||
| 2025-07-29 | 13F | Stratos Wealth Partners, LTD. | 178 526 | −5,40 | 2 906 | −8,10 | ||||
| 2025-08-01 | 13F | Belvedere Trading LLC | Put | 20 000 | 326 | |||||
| 2025-07-18 | 13F | Consolidated Portfolio Review Corp | 37 717 | −54,67 | 614 | −55,95 | ||||
| 2025-08-13 | 13F | Congress Wealth Management LLC / DE / | 52 399 | 35,43 | 853 | 31,64 | ||||
| 2025-04-10 | 13F | Sugar Maple Asset Management, LLC | 0 | −100,00 | 0 | −100,00 | ||||
| 2025-08-13 | 13F | Continuum Advisory, LLC | 0 | −100,00 | 0 | |||||
| 2025-08-13 | 13F | Beacon Pointe Advisors, LLC | 138 018 | 2 247 | ||||||
| 2025-07-14 | 13F | Sowell Financial Services LLC | 47 313 | 3,87 | 770 | 0,92 | ||||
| 2025-07-22 | 13F | Measured Risk Portfolios, Inc. | 141 323 | 1,91 | 2 301 | −1,03 | ||||
| 2025-07-17 | 13F | Janney Montgomery Scott LLC | 187 613 | −6,28 | 3 | 0,00 | ||||
| 2025-07-28 | 13F | Mission Hills Financial Advisory, LLC | 999 233 | 15,44 | 16 268 | 12,13 | ||||
| 2025-07-15 | 13F | Kentucky Trust Co | 500 | 0,00 | 8 | 0,00 | ||||
| 2025-08-01 | 13F | Pasadena Private Wealth, LLC | 0 | −100,00 | 0 | |||||
| 2025-07-30 | 13F | Bleakley Financial Group, LLC | 23 898 | 2,81 | 389 | 0,00 | ||||
| 2025-08-06 | 13F | AE Wealth Management LLC | 3 135 | −11,86 | 51 | −13,56 | ||||
| 2025-08-06 | 13F | Valtinson Bruner Financial Planning LLC | 14 528 | 0,17 | 237 | −2,88 | ||||
| 2025-07-10 | 13F | Wealth Enhancement Advisory Services, Llc | 25 096 | 12,50 | 407 | 9,12 | ||||
| 2025-08-11 | 13F | HighTower Advisors, LLC | 99 633 | −10,74 | 1 622 | −13,26 | ||||
| 2025-05-05 | 13F | Transce3nd, LLC | 0 | −100,00 | 0 | −100,00 | ||||
| 2025-08-14 | 13F | Gotham Asset Management, LLC | 0 | −100,00 | 0 | |||||
| 2025-07-17 | 13F | HB Wealth Management, LLC | 20 090 | −19,60 | 327 | −21,77 | ||||
| 2025-08-12 | 13F | O'shaughnessy Asset Management, Llc | 0 | −100,00 | 0 | |||||
| 2025-07-25 | 13F | GFS Advisors, LLC | 77 800 | 0,00 | 1 267 | −2,84 | ||||
| 2025-08-14 | 13F | Royal Bank Of Canada | 518 925 | 11,28 | 8 447 | 8,07 | ||||
| 2025-08-06 | 13F | Aspect Partners, LLC | 893 | 15,67 | 15 | 16,67 | ||||
| 2025-07-22 | 13F | Beacon Financial Advisory LLC | 25 320 | 18,08 | 412 | 14,76 | ||||
| 2025-08-07 | 13F | Parkside Financial Bank & Trust | 1 109 | 0,00 | 18 | 0,00 | ||||
| 2025-08-14 | 13F | Visionary Wealth Advisors | 30 115 | −0,18 | 490 | −2,97 | ||||
| 2025-07-25 | 13F | Cwm, Llc | 18 056 | 995,63 | 0 | |||||
| 2025-08-11 | 13F | Hexagon Capital Partners LLC | 13 616 | 0,00 | 222 | −3,07 | ||||
| 2025-08-14 | 13F | Van Den Berg Management I, Inc | 3 000 | 49 | ||||||
| 2025-08-08 | 13F | Foundations Investment Advisors, LLC | 305 454 | −11,92 | 4 973 | −14,44 | ||||
| 2025-08-13 | 13F | Cerity Partners LLC | 19 149 | −46,63 | 312 | −48,25 | ||||
| 2025-07-24 | 13F | IFP Advisors, Inc | 56 023 | 995,70 | 912 | 972,94 | ||||
| 2025-07-10 | 13F | Capital Advisory Group Advisory Services, LLC | 14 423 | 2,35 | 235 | −0,85 | ||||
| 2025-08-12 | 13F | Real Talk Capital, LLC | 36 533 | −3,59 | 595 | −6,46 | ||||
| 2025-08-01 | 13F | James Investment Research Inc | 27 874 | 454 | ||||||
| 2025-07-08 | 13F | IAM Advisory, LLC | 15 063 | −44,43 | 245 | −46,04 | ||||
| 2025-07-10 | 13F | Financial Management Network Inc | 184 226 | 3,28 | 2 988 | 17,82 | ||||
| 2025-08-14 | 13F | Money Concepts Capital Corp | 36 837 | 600 | ||||||
| 2025-08-01 | 13F | Envestnet Asset Management Inc | 407 803 | 42,10 | 6 639 | 38,03 | ||||
| 2025-08-15 | 13F | Captrust Financial Advisors | 14 529 | 237 | ||||||
| 2025-08-14 | 13F | Mml Investors Services, Llc | 58 645 | −12,89 | 1 | −100,00 | ||||
| 2025-08-01 | 13F | Shilanski & Associates, Inc. | 203 050 | 1,52 | 3 306 | −1,40 | ||||
| 2025-07-15 | 13F | Attessa Capital LLC | 11 997 | −22,71 | 195 | −25,00 | ||||
| 2025-04-22 | 13F | Castleview Partners, Llc | 0 | −100,00 | 0 | |||||
| 2025-08-14 | 13F | Susquehanna International Group, Llp | 143 563 | 1 031,49 | 2 337 | 1 002,36 | ||||
| 2025-07-09 | 13F | Triumph Capital Management | 29 676 | 5,09 | 483 | 2,11 | ||||
| 2025-08-11 | 13F | Anfield Capital Management, LLC | 7 129 | 2,47 | 116 | 0,00 | ||||
| 2025-04-21 | 13F | Luken Investment Analytics, LLC | 0 | −100,00 | 0 | |||||
| 2025-08-06 | 13F | Black Swift Group, LLC | 72 000 | −35,79 | 1 172 | −37,63 | ||||
| 2025-08-27 | 13F/A | Brinker Capital Investments, LLC | 64 759 | −34,14 | 1 054 | −36,00 | ||||
| 2025-05-07 | 13F | Norden Group Llc | 0 | −100,00 | 0 | |||||
| 2025-08-07 | 13F | Guidance Capital, Inc | 69 390 | −5,80 | 1 108 | −2,12 | ||||
| 2025-08-13 | 13F | Wambolt & Associates, LLC | 32 667 | −1,71 | 520 | −5,11 | ||||
| 2025-08-12 | 13F | Barings Llc | 236 283 | 0,00 | 3 847 | −2,88 | ||||
| 2025-08-13 | 13F | Northwestern Mutual Wealth Management Co | 25 748 | 58,45 | 419 | 54,04 | ||||
| 2025-08-04 | 13F | Arkadios Wealth Advisors | 220 148 | 11,95 | 3 584 | 8,77 | ||||
| 2025-08-12 | 13F | Advisors Asset Management, Inc. | 31 729 | −7,57 | 517 | −10,26 | ||||
| 2025-05-06 | 13F | Bank Julius Baer & Co. Ltd, Zurich | 0 | −100,00 | 0 | −100,00 | ||||
| 2025-08-11 | 13F | Brown Brothers Harriman & Co | 0 | −100,00 | 0 | |||||
| 2025-07-21 | 13F | Andina Capital Management, LLC | 30 467 | 2,86 | 496 | 0,00 | ||||
| 2025-08-13 | 13F | Colonial Trust Advisors | 475 | 0,00 | 8 | 0,00 | ||||
| 2025-08-18 | 13F | Hollencrest Capital Management | 5 885 | 0,00 | 96 | −3,06 | ||||
| 2025-08-06 | 13F | Axim Planning & Wealth | 10 104 | 164 | ||||||
| 2025-08-07 | 13F | Samalin Investment Counsel, LLC | 138 597 | 0,85 | 2 256 | −2,04 | ||||
| 2025-08-14 | 13F | Sherman Asset Management, Inc. | 3 508 | 57 | ||||||
| 2025-04-24 | 13F | Wingate Wealth Advisors, Inc. | 0 | −100,00 | 0 | −100,00 | ||||
| 2025-08-13 | 13F | Russell Investments Group, Ltd. | 1 540 | 25 | ||||||
| 2025-07-15 | 13F | DKM Wealth Management, Inc. | 22 400 | 0,00 | 365 | −2,93 | ||||
| 2025-07-25 | 13F | Atria Wealth Solutions, Inc. | 60 743 | −34,49 | 989 | −36,42 | ||||
| 2025-08-06 | 13F | Wedbush Securities Inc | 129 283 | 3,85 | 2 | 0,00 | ||||
| 2025-07-23 | 13F | Nbt Bank N A /ny | 61 | 3,39 | 1 | |||||
| 2025-07-15 | 13F | Graypoint LLC | 243 401 | 72,41 | 3 963 | 67,46 | ||||
| 2025-08-11 | 13F | CBIZ Investment Advisory Services, LLC | 0 | −100,00 | 0 | −100,00 | ||||
| 2025-08-14 | 13F | Silvercrest Asset Management Group Llc | 11 976 | 0,00 | 195 | −3,00 | ||||
| 2025-08-08 | 13F | Creative Planning | 97 706 | −5,52 | 1 591 | −8,25 | ||||
| 2025-07-25 | 13F | Concurrent Investment Advisors, LLC | 17 255 | 8,82 | 281 | 5,66 | ||||
| 2025-07-31 | 13F | Glass Jacobson Investment Advisors llc | 398 | 0,00 | 6 | 0,00 | ||||
| 2025-08-14 | 13F | UBS Group AG | 1 029 666 | −29,71 | 16 763 | −31,73 | ||||
| 2025-08-12 | 13F | SRS Capital Advisors, Inc. | 4 437 | 72 | ||||||
| 2025-08-12 | 13F | Jpmorgan Chase & Co | 26 816 | −15,54 | 437 | −18,05 | ||||
| 2025-08-08 | 13F | L & S Advisors Inc | 20 819 | 339 | ||||||
| 2025-08-13 | 13F | Cary Street Partners Financial Llc | 21 803 | −19,26 | 355 | −21,68 | ||||
| 2025-08-14 | 13F | Stifel Financial Corp | 463 259 | 5,44 | 7 542 | 2,42 | ||||
| 2025-05-15 | 13F | Millennium Management Llc | 0 | −100,00 | 0 | −100,00 | ||||
| 2025-08-04 | 13F | Pensionmark Financial Group, Llc | 28 597 | −0,26 | 466 | −3,12 | ||||
| 2025-08-13 | 13F | Brown Advisory Inc | 31 222 | 0,00 | 508 | −2,87 | ||||
| 2025-08-19 | 13F | Cape Investment Advisory, Inc. | 2 000 | 0,00 | 33 | −3,03 | ||||
| 2025-08-12 | 13F | Global Retirement Partners, LLC | 65 480 | 73,36 | 1 066 | 69,75 | ||||
| 2025-08-15 | 13F | CI Private Wealth, LLC | 38 732 | 251,53 | 631 | 242,39 | ||||
| 2025-08-11 | 13F | Aptus Capital Advisors, LLC | 200 | 0,00 | 3 | 0,00 | ||||
| 2025-08-14 | 13F | Hrt Financial Lp | 0 | −100,00 | 0 | |||||
| 2025-07-21 | 13F | Ameriflex Group, Inc. | 0 | −100,00 | 0 | |||||
| 2025-07-28 | 13F | Naviter Wealth, LLC | 337 401 | 464,80 | 5 493 | 445,38 | ||||
| 2025-07-31 | 13F | Whipplewood Advisors, LLC | 142 | −81,41 | 2 | 0,00 | ||||
| 2025-08-08 | 13F | Capital Investment Advisory Services, LLC | 9 271 | 347,66 | 151 | 341,18 | ||||
| 2025-08-12 | 13F | J.w. Cole Advisors, Inc. | 159 680 | 1,38 | 2 600 | −1,52 | ||||
| 2025-08-18 | 13F | Tyler-Stone Wealth Management | 35 136 | 0,00 | 572 | −2,72 | ||||
| 2025-08-05 | 13F | Milestone Asset Management, Llc | 42 945 | 46,57 | 699 | 42,36 | ||||
| 2025-07-14 | 13F | Opal Wealth Advisors, LLC | 16 186 | 264 | ||||||
| 2025-07-29 | 13F | TrueMark Investments, LLC | 0 | −100,00 | 0 | |||||
| 2025-07-29 | 13F | International Assets Investment Management, Llc | 89 146 | 33,96 | 1 451 | 30,13 | ||||
| 2025-08-12 | 13F | MAI Capital Management | 353 | 2,62 | 6 | 0,00 | ||||
| 2025-07-29 | 13F | Stephens Inc /ar/ | 30 475 | 7,02 | 496 | 3,98 | ||||
| 2025-08-13 | 13F | Everstar Asset Management, LLC | 19 656 | 9,42 | 320 | 6,31 | ||||
| 2025-08-08 | 13F | Avantax Advisory Services, Inc. | 127 289 | 10,85 | 2 072 | 7,69 | ||||
| 2025-08-14 | 13F | Citadel Advisors Llc | Call | 26 700 | −38,19 | 435 | −40,06 | |||
| 2025-08-14 | 13F | Citadel Advisors Llc | Put | 54 700 | 45,09 | 891 | 41,05 | |||
| 2025-07-29 | 13F | Private Trust Co Na | 4 373 | 274,08 | 71 | 273,68 | ||||
| 2025-08-08 | 13F | Cetera Investment Advisers | 120 429 | 11,07 | 1 961 | 7,87 | ||||
| 2025-08-15 | 13F | Morgan Stanley | 4 698 710 | 5,09 | 76 495 | 2,08 | ||||
| 2025-07-21 | 13F | Ameritas Advisory Services, LLC | 119 592 | 1 947 | ||||||
| 2025-08-14 | 13F | Bank Of America Corp /de/ | 5 295 265 | 62,58 | 86 207 | 57,92 | ||||
| 2025-08-12 | 13F | Park Square Financial Group, LLC | 97 | 470,59 | 2 | |||||
| 2025-08-14 | 13F | Sunbelt Securities, Inc. | 3 000 | 0,00 | 50 | −2,00 | ||||
| 2025-07-21 | 13F | Ntv Asset Management Llc | 13 000 | 0,00 | 212 | −2,76 | ||||
| 2025-08-14 | 13F | Beaird Harris Wealth Management, LLC | 2 060 | −26,66 | 34 | −29,79 | ||||
| 2025-08-13 | 13F | Johnson Financial Group, Inc. | 42 500 | 0,00 | 692 | −2,95 | ||||
| 2025-08-08 | 13F | Condor Capital Management | 830 944 | 2,03 | 13 528 | −0,89 | ||||
| 2025-08-14 | 13F | Van Eck Associates Corp | 334 254 | 51 562,13 | 5 | |||||
| 2025-05-28 | 13F/A | Jones Financial Companies Lllp | 0 | −100,00 | 0 | −100,00 | ||||
| 2025-08-11 | 13F | Perennial Investment Advisors, LLC | 74 420 | −4,27 | 1 212 | −6,99 | ||||
| 2025-05-02 | 13F | Cullen/frost Bankers, Inc. | 0 | −100,00 | 0 | −100,00 | ||||
| 2025-08-14 | 13F/A | Barclays Plc | 14 594 | 0,00 | 0 | |||||
| 2025-08-12 | 13F | AlphaCore Capital LLC | 1 150 | −63,64 | 19 | −66,04 | ||||
| 2025-08-14 | 13F | Warren Averett Asset Management, LLC | 98 384 | 4,34 | 1 602 | 1,33 | ||||
| 2025-07-14 | 13F | Clear Harbor Asset Management, LLC | 11 390 | 0,00 | 185 | −2,63 | ||||
| 2025-05-12 | 13F | Simplex Trading, Llc | 0 | −100,00 | 0 | |||||
| 2025-07-14 | 13F | AdvisorNet Financial, Inc | 137 204 | −5,86 | 2 234 | −8,56 | ||||
| 2025-08-07 | 13F | Cascade Financial Partners, LLC | 17 126 | 0,11 | 279 | −2,80 | ||||
| 2025-08-12 | 13F | Bokf, Na | 3 200 | 52 | ||||||
| 2025-08-14 | 13F | Aqr Capital Management Llc | 19 267 | 314 | ||||||
| 2025-08-19 | 13F | National Asset Management, Inc. | 0 | −100,00 | 0 | |||||
| 2025-08-11 | 13F | Principal Securities, Inc. | 29 890 | 109,11 | 487 | 105,06 | ||||
| 2025-09-09 | 13F | NWF Advisory Services Inc. | 58 843 | 62,02 | 958 | 57,40 | ||||
| 2025-07-30 | 13F | Insight Advisors, LLC/ PA | 14 131 | −42,28 | 230 | −43,90 | ||||
| 2025-08-14 | 13F | Federation des caisses Desjardins du Quebec | 3 500 | 0,00 | 57 | −1,72 | ||||
| 2025-08-04 | 13F | Creative Financial Designs Inc /adv | 1 200 | 0,00 | 20 | −5,00 | ||||
| 2025-08-12 | 13F | Jefferies Financial Group Inc. | 28 699 | 65,23 | 467 | 60,48 | ||||
| 2025-07-18 | 13F | Truist Financial Corp | 26 316 | 10,25 | 428 | 7,00 | ||||
| 2025-04-01 | 13F | Massmutual Trust Co Fsb/adv | 0 | −100,00 | 0 | −100,00 | ||||
| 2025-07-24 | 13F | WMG Financial Advisors, LLC | 27 350 | 445 | ||||||
| 2025-08-04 | 13F | Spire Wealth Management | 95 445 | 3,46 | 1 554 | 0,45 | ||||
| 2025-08-08 | 13F | Emerald Investment Partners, Llc | 266 | −4,32 | 4 | 0,00 | ||||
| 2025-08-19 | 13F | Anchor Investment Management, LLC | 13 329 | 0,00 | 217 | −3,14 | ||||
| 2025-08-19 | 13F | Advisory Services Network, LLC | 12 726 | 206 | ||||||
| 2025-08-15 | 13F | Equitable Holdings, Inc. | 244 717 | 24,98 | 3 984 | 21,40 | ||||
| 2025-08-08 | 13F | Crossmark Global Holdings, Inc. | 0 | −100,00 | 0 | |||||
| 2025-08-13 | 13F | Gibbs Wealth Management | 91 301 | 1 486 | ||||||
| 2025-08-14 | 13F | IHT Wealth Management, LLC | 28 408 | 11,32 | 462 | 8,20 | ||||
| 2025-07-11 | 13F | SILVER OAK SECURITIES, Inc | 18 266 | −0,27 | 297 | −3,57 | ||||
| 2025-07-16 | 13F | Maridea Wealth Management LLC | 29 967 | 4,43 | 488 | 1,46 | ||||
| 2025-07-31 | 13F | Moloney Securities Asset Management, LLC | 0 | −100,00 | 0 | |||||
| 2025-08-15 | 13F | Kestra Advisory Services, LLC | 568 118 | 20,54 | 9 249 | 17,09 | ||||
| 2025-07-25 | 13F | Endowment Wealth Management, Inc. | 25 201 | 10,85 | 410 | 7,61 | ||||
| 2025-08-07 | 13F | Kestra Private Wealth Services, Llc | 71 772 | 2,51 | 1 168 | −0,43 | ||||
| 2025-07-14 | 13F | U.S. Capital Wealth Advisors, LLC | 40 361 | 49,90 | 657 | 45,68 | ||||
| 2025-08-05 | 13F | Magnolia Capital Advisors Llc | 44 871 | 730 | ||||||
| 2025-07-16 | 13F | MKT Advisors LLC | 0 | −100,00 | 0 | |||||
| 2025-08-04 | 13F | L.m. Kohn & Company | 13 319 | 217 | ||||||
| 2025-05-22 | 13F | Mattson Financial Services, LLC | 0 | −100,00 | 0 | |||||
| 2025-08-29 | 13F | Centaurus Financial, Inc. | 212 322 | 7,22 | 3 | 0,00 | ||||
| 2025-08-14 | 13F | L2 Asset Management, LLC | 22 831 | 372 | ||||||
| 2025-08-13 | 13F | GeoWealth Management, LLC | 9 784 | 159 | ||||||
| 2025-07-08 | 13F | Webster Bank, N. A. | 3 456 | 0,00 | 56 | −1,75 | ||||
| 2025-08-14 | 13F | Hilltop Holdings Inc. | 342 178 | 4,46 | 5 571 | 1,46 | ||||
| 2025-05-07 | 13F | Sheaff Brock Investment Advisors, LLC | 13 300 | 0,00 | 223 | 0,45 | ||||
| 2025-08-14 | 13F | Clark Capital Management Group, Inc. | 541 456 | 322,50 | 8 815 | 310,53 | ||||
| 2025-08-04 | 13F | Haven Private, LLC | 618 099 | 3,22 | 10 063 | 0,27 | ||||
| 2025-08-11 | 13F | Private Advisor Group, LLC | 73 870 | −1,35 | 1 203 | −4,15 | ||||
| 2025-08-12 | 13F | Trexquant Investment LP | 11 207 | 182 | ||||||
| 2025-08-12 | 13F | LPL Financial LLC | 2 670 533 | −4,55 | 43 476 | −7,28 | ||||
| 2025-08-14 | 13F/A | Rockefeller Capital Management L.P. | 15 617 | 254 | ||||||
| 2025-06-12 | 13F/A | Deutsche Bank Ag\ | 0 | −100,00 | 0 | |||||
| 2025-07-17 | 13F | Sound Income Strategies, LLC | 4 792 | −11,72 | 78 | −13,33 | ||||
| 2025-08-13 | 13F | Lido Advisors, LLC | 73 906 | −0,64 | 1 203 | −3,45 | ||||
| 2025-08-06 | 13F | First Horizon Advisors, Inc. | 896 | 15 | ||||||
| 2025-08-08 | 13F | Larson Financial Group LLC | 19 466 | 14,02 | 317 | 10,49 | ||||
| 2025-08-13 | 13F | Baker Avenue Asset Management, LP | 19 086 | 9,15 | 311 | 5,80 | ||||
| 2025-08-08 | 13F | NAN FUNG TRINITY (HK) Ltd | 0 | −100,00 | 0 | |||||
| 2025-05-13 | 13F | Claudia M.p. Batlle, Crp (r) Llc | 0 | −100,00 | 0 | |||||
| 2025-07-31 | 13F | Cambridge Investment Research Advisors, Inc. | 90 453 | −20,36 | 1 | 0,00 | ||||
| 2025-05-16 | 13F | Coppell Advisory Solutions LLC | 0 | −100,00 | 0 | |||||
| 2025-08-08 | 13F | CFO4Life Group, LLC | 37 407 | 154,26 | 609 | 147,15 | ||||
| 2025-08-14 | 13F | Ieq Capital, Llc | 19 267 | 0,00 | 314 | −2,80 | ||||
| 2025-08-14 | 13F | Raymond James Financial Inc | 422 682 | 1,85 | 6 881 | −1,06 | ||||
| 2025-08-19 | 13F | Newbridge Financial Services Group, Inc. | 468 | 2,86 | 8 | 0,00 | ||||
| 2025-07-17 | 13F | Albion Financial Group /ut | 45 065 | −4,00 | 734 | −6,74 | ||||
| 2025-07-08 | 13F/A | Adams Asset Advisors, LLC | 76 419 | 1 244 | ||||||
| 2025-07-15 | 13F | West Oak Capital, LLC | 1 450 | 0,00 | 0 | |||||
| 2025-07-11 | 13F | First PREMIER Bank | 32 396 | −6,32 | 1 | |||||
| 2025-07-24 | 13F | Us Bancorp \de\ | 0 | −100,00 | 0 | |||||
| 2025-08-06 | 13F | Texas Yale Capital Corp. | 26 850 | −3,59 | 437 | −6,22 | ||||
| 2025-08-12 | 13F | SlateStone Wealth, LLC | 38 000 | −53,94 | 1 | −100,00 | ||||
| 2025-08-14 | 13F | Group One Trading, L.p. | 2 010 | 402,50 | 33 | 433,33 | ||||
| 2025-08-15 | 13F/A | Symphony Financial, Ltd. Co. | 41 457 | 665 | ||||||
| 2025-07-16 | 13F | Investment Partners Asset Management, Inc. | 106 353 | 2,03 | 1 731 | −0,92 | ||||
| 2025-07-30 | 13F/A | Alpha Wealth Funds, LLC | 74 096 | 6,45 | 1 206 | 3,43 | ||||
| 2025-08-14 | 13F | Comerica Bank | 26 219 | −12,52 | 427 | −15,14 | ||||
| 2025-07-28 | 13F | Harbour Investments, Inc. | 45 812 | 62,02 | 746 | 57,51 | ||||
| 2025-07-24 | 13F | Ronald Blue Trust, Inc. | 1 500 | 24 | ||||||
| 2025-07-15 | 13F | Oregon Pacific Wealth Management, LLC | 19 141 | −3,08 | 312 | −5,76 | ||||
| 2025-05-05 | 13F | Denali Advisors Llc | 0 | −100,00 | 0 | −100,00 | ||||
| 2025-05-14 | 13F | Jane Street Group, Llc | 0 | −100,00 | 0 | |||||
| 2025-07-21 | 13F | Barrett & Company, Inc. | 2 250 | 0,00 | 37 | −2,70 | ||||
| 2025-08-14 | 13F | Ausdal Financial Partners, Inc. | 13 319 | 217 | ||||||
| 2025-07-22 | 13F | Wealthcare Advisory Partners LLC | 55 559 | 167,60 | 904 | 160,52 | ||||
| 2025-07-14 | 13F | Sterling Group Wealth Management, LLC | 24 215 | 0,79 | 394 | −1,99 | ||||
| 2025-08-08 | 13F | Pnc Financial Services Group, Inc. | 250 | 0,00 | 4 | 0,00 | ||||
| 2025-08-11 | 13F | Cornerstone Planning Group LLC | 243 | 2,53 | 4 | 0,00 | ||||
| 2025-08-14 | 13F | MGB Wealth Management, LLC | 7 493 | 0,00 | 122 | −3,20 | ||||
| 2025-08-14 | 13F | Fmr Llc | 114 | −69,76 | 2 | −83,33 | ||||
| 2025-08-14 | 13F | Kovitz Investment Group Partners, LLC | 11 096 | 181 | ||||||
| 2025-08-14 | 13F | Qube Research & Technologies Ltd | 25 | −99,97 | 0 | −100,00 | ||||
| 2025-07-23 | 13F | Kingswood Wealth Advisors, Llc | 111 727 | 13,37 | 1 819 | 11,40 | ||||
| 2025-08-04 | 13F | Bay Colony Advisory Group, Inc d/b/a Bay Colony Advisors | 24 039 | −19,21 | 391 | −21,96 | ||||
| 2025-07-25 | 13F | We Are One Seven, LLC | 167 093 | 15,70 | 2 720 | 12,40 | ||||
| 2025-07-03 | 13F | Garde Capital, Inc. | 528 | 9 | ||||||
| 2025-07-16 | 13F | PFS Partners, LLC | 589 | 0,00 | 10 | 0,00 | ||||
| 2025-08-12 | 13F | Tocqueville Asset Management L.p. | 196 827 | 9,75 | 3 204 | 6,62 | ||||
| 2025-08-14 | 13F | Scott Marsh Financial, LLC | 21 297 | 347 | ||||||
| 2025-05-15 | 13F/A | Orion Portfolio Solutions, LLC | 98 327 | −0,07 | 1 648 | 0,67 |