Grundläggande statistik
| Institutionella aktier (lång) | 174 308 174 - 31,43% (ex 13D/G) - change of −2,79MM shares −1,58% MRQ |
| Institutionellt värde (lång) | $ 5 359 349 USD ($1000) |
Institutionellt ägande och aktieägare
Amer Sports, Inc. (US:AS) har 372 Institutionella ägare och aktieägare som har lämnat in 13D/G- eller 13F-formulär till Securities Exchange Commission (SEC). Dessa institut innehar totalt 174,964,488 aktier. Största aktieägare inkluderar FountainVest China Capital Partners GP3 Ltd., Fmr Llc, D. E. Shaw & Co., Inc., Qube Research & Technologies Ltd, Viking Global Investors Lp, Brown Advisory Inc, Marshall Wace, Llp, BlackRock, Inc., Avala Global LP, and Arrowstreet Capital, Limited Partnership .
Amer Sports, Inc. (NYSE:AS) Institutionell ägarstruktur visar institutioners och fonders nuvarande positioner i företaget, samt de senaste förändringarna i positionernas storlek. Större aktieägare kan vara enskilda investerare, fonder, hedgefonder eller institutioner. Bilaga 13D visar att investeraren äger (eller ägde) mer än 5% av företaget och avser (eller avsåg) att aktivt eftersträva en förändring av affärsstrategin. Schedule 13G indikerar en passiv investering på över 5%.
The share price as of September 8, 2025 is 36,64 / share. Previously, on September 9, 2024, the share price was 14,40 / share. This represents an increase of 154,44% over that period.

Fondsentimentets poäng
Fondsentimentet poängen(fka Ägarackumulation-poäng) visar vilka aktier som är mest köpta av fonder. Det är resultatet av en sofistikerad kvantitativ flerfaktormodell som identifierar företag med de högsta nivåerna av institutionell ackumulering. Poängsättningsmodellen använder en kombination av den totala ökningen av redovisade ägare, förändringarna i portföljallokeringarna för dessa ägare och andra mått. Siffran sträcker sig från 0 till 100, där högre siffror indikerar en högre nivå av ackumulering i förhållande till sina konkurrenter, och 50 är genomsnittet.
Uppdateringsfrekvens: Dagligen
Se Ownership Explorer, som innehåller en lista över de högst rankade företagen.
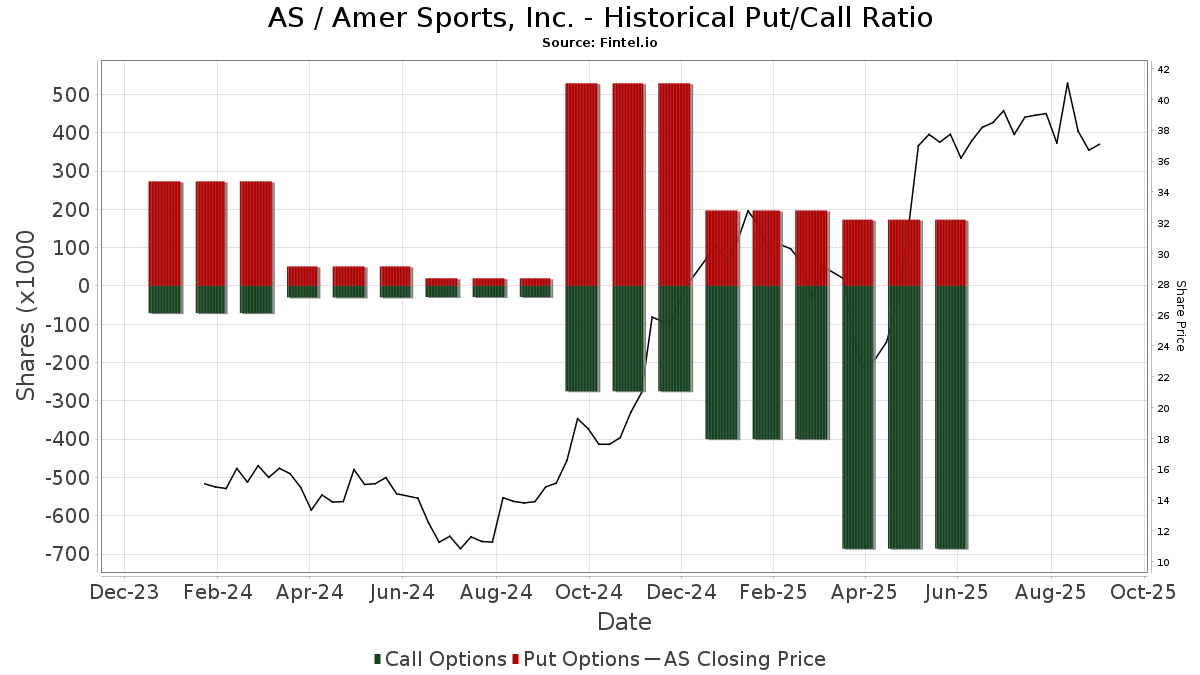
Institutionell sälj/köp-kvot
Förutom att rapportera vanliga eget kapital- och skuldemissioner måste institutioner med mer än 100MM tillgångar under förvaltning också avslöja sina innehav av sälj- och köpoptioner. Eftersom säljoptioner i allmänhet indikerar ett negativt sentiment och köpoptioner indikerar ett positivt sentiment, kan vi få en uppfattning om det övergripande institutionella sentimentet genom att plotta förhållandet mellan säljoptioner och köpoptioner. Diagrammet till höger visar det historiska förhållandet mellan sälj- och köpoptioner för detta instrument.
Genom att använda sälj/köp-kvoten som en indikator på aktieägarnas sentiment undviker man en av de största bristerna med att använda det totala institutionella ägandet, nämligen att en betydande del av de förvaltade tillgångarna investeras passivt för att följa index. Passivt förvaltade fonder köper vanligtvis inte optioner, så indikatorn för sälj/köp-kvoten ger en bättre bild av stämningen i aktivt förvaltade fonder.
13D/G-Arkiveringar
Vi presenterar 13D/G-arkiveringar separat från 13F-arkiveringar på grund av att de behandlas olika av SEC. 13D/G-arkiveringar kan lämnas in av grupper av investerare (med en ledare), medan 13F-arkiveringar inte kan det. Detta leder till situationer där en investerare kan lämna in en 13D/G-ansökan med ett värde för de totala aktierna (vilket motsvarar alla aktier som ägs av investerargruppen), men sedan lämna in en 13F-ansökan med ett annat värde för de totala aktierna (vilket motsvarar enbart deras eget ägande). Detta innebär att aktieägandet i 13D/G-arkiveringar och 13F-arkiveringar ofta inte är direkt jämförbara, så vi presenterar dem separat.
Notera: Från och med den 16 maj 2021 visar vi inte längre ägare som inte har lämnat in en 13D/G under det senaste året. Tidigare visade vi hela historiken för 13D/G-arkiveringar. I allmänhet måste enheter som är skyldiga att lämna in 13D/G-arkiveringar lämna in minst en gång per år innan de lämnar in en stängningsarkivering. Fonder avslutar dock ibland positioner utan att lämna in en avslutande arkivering (dvs. de avvecklar), så att visa hela historiken resulterade ibland i förvirring om det nuvarande ägandet. För att förhindra förvirring visar vi nu endast "nuvarande" ägare - det vill säga ägare som har lämnat in en ansökan under det senaste året.
Upgrade to unlock premium data.
| Fil Datum | Formulär | Investerare | Föregående aktier |
Senaste aktier |
Δ Aktier (Procent) |
Ägande (Procent) |
Δ Ägande (Procent) |
|
|---|---|---|---|---|---|---|---|---|
| 2025-08-26 | Wilson Dennis J. | 104,017,032 | 99,962,978 | -3.90 | 18.00 | -4.26 | ||
| 2025-06-02 | Baseball Investment Limited | 69,099,348 | 34,099,348 | -50.65 | 6.10 | -51.59 | ||
| 2025-05-14 | HSBC HOLDINGS PLC | 235,108,143 | 232,365,782 | -1.17 | 42.00 | -2.33 | ||
| 2024-12-10 | ANLLIAN Sports Products Ltd | 232,328,780 | 232,328,780 | 0.00 | 42.50 | -7.61 |
13F- och NPORT-arkiveringar
Detaljer om 13F-arkiveringar är gratis. Detaljer om NP-arkiveringar kräver ett premiummedlemskap. Gröna rader indikerar nya positioner. Röda rader indikerar stängda positioner. Klicka på länk symbolen för att se hela transaktionshistoriken.
Uppgradera
för att låsa upp premiumdata och exportera till Excel ![]() .
.
| Fil Datum | Källa | Investerare | Typ | Genomsnittligt pris (beräknat) |
Aktier | Δ Aktier (%) |
Rapporterat värde (1000 USD) |
Δ Värde (%) |
Portföljallokering (%) |
|
|---|---|---|---|---|---|---|---|---|---|---|
| 2025-08-07 | 13F | Acadian Asset Management Llc | 50 048 | 2 | ||||||
| 2025-08-14 | 13F | Peak6 Llc | Call | 0 | −100,00 | 0 | ||||
| 2025-08-04 | 13F | GAM Holding AG | 349 700 | −22,80 | 13 554 | 11,94 | ||||
| 2025-07-29 | NP | ESGV - Vanguard ESG U.S. Stock ETF ETF Shares | 18 436 | 52,65 | 671 | 86,11 | ||||
| 2025-08-14 | 13F | GWM Advisors LLC | 19 777 | 767 | ||||||
| 2025-07-24 | 13F | IFP Advisors, Inc | 0 | −100,00 | 6 | |||||
| 2025-08-14 | 13F | Voya Investment Management Llc | 16 667 | 112,16 | 646 | 209,09 | ||||
| 2025-05-15 | 13F | Quantessence Capital LLC | 0 | −100,00 | 0 | |||||
| 2025-08-14 | 13F | Treasurer of the State of North Carolina | 69 687 | 142,05 | 3 | |||||
| 2025-08-14 | 13F | Utah Retirement Systems | 7 886 | 306 | ||||||
| 2025-08-12 | 13F | Eisler Capital Management Ltd. | 45 691 | 1 771 | ||||||
| 2025-08-05 | 13F | Bank Of Montreal /can/ | 240 305 | −1,08 | 9 314 | 43,45 | ||||
| 2025-08-08 | 13F | Mv Capital Management, Inc. | 44 | 7,32 | 2 | 0,00 | ||||
| 2025-08-14 | 13F | D. E. Shaw & Co., Inc. | Call | 0 | −100,00 | 0 | ||||
| 2025-08-08 | 13F | Geode Capital Management, Llc | 747 218 | 136,08 | 28 962 | 242,34 | ||||
| 2025-08-15 | 13F | Morgan Stanley | 2 734 505 | 18,05 | 105 989 | 71,18 | ||||
| 2025-08-14 | 13F | California State Teachers Retirement System | 9 410 | 135,07 | 365 | 240,19 | ||||
| 2025-06-27 | NP | BIVIX - Invenomic Fund Institutional Class shares | Short | −528 295 | 54,97 | −12 811 | 17,55 | |||
| 2025-06-26 | NP | JHMM - John Hancock Multifactor Mid Cap ETF | 20 432 | 495 | ||||||
| 2025-06-23 | NP | PMPRX - MidCap Value Fund I R-3 | 2 008 | 6,30 | 49 | −20,00 | ||||
| 2025-08-12 | 13F | EAM Investors, LLC | 91 471 | −18,07 | 3 545 | 18,80 | ||||
| 2025-08-14 | 13F | Fortress Investment Group LLC | 248 562 | 9 634 | ||||||
| 2025-08-21 | NP | LIONX - Issachar Fund Class N Shares | 7 300 | 283 | ||||||
| 2025-08-06 | 13F | Ing Groep Nv | 1 279 700 | 1 566,28 | 49 601 | 2 317,20 | ||||
| 2025-07-16 | 13F | Arlington Capital Management, Inc. | 78 808 | 3 055 | ||||||
| 2025-08-14 | 13F | UBS Group AG | 1 046 911 | −46,06 | 40 578 | −21,78 | ||||
| 2025-08-12 | 13F | Dynamic Technology Lab Private Ltd | 50 992 | 1 976 | ||||||
| 2025-07-25 | 13F | Stonehage Fleming Financial Services Holdings Ltd | 34 022 | 0,00 | 1 319 | 44,99 | ||||
| 2025-08-14 | 13F | Sei Investments Co | 78 630 | 29,12 | 3 048 | 87,28 | ||||
| 2025-08-13 | 13F | Norges Bank | 1 570 059 | 60 855 | ||||||
| 2025-08-14 | 13F | Jane Street Group, Llc | Call | 12 400 | 481 | |||||
| 2025-08-14 | 13F | Jane Street Group, Llc | 351 296 | 152,70 | 13 616 | 266,51 | ||||
| 2025-08-14 | 13F | CIBC World Markets Inc. | 15 410 | −2,10 | 597 | 42,14 | ||||
| 2025-09-05 | 13F | FountainVest China Capital Partners GP3 Ltd. | 34 099 348 | −50,65 | 1 322 | −29,51 | ||||
| 2025-08-06 | 13F | Golden State Wealth Management, LLC | 0 | −100,00 | 0 | |||||
| 2025-04-25 | 13F | Kieckhefer Group Llc | 0 | −100,00 | 0 | |||||
| 2025-08-14 | 13F | Tudor Investment Corp Et Al | Call | 6 200 | 240 | |||||
| 2025-06-23 | NP | IYC - iShares U.S. Consumer Services ETF | 14 268 | −10,93 | 346 | −32,62 | ||||
| 2025-08-14 | 13F | Tudor Investment Corp Et Al | 861 758 | 763,25 | 33 402 | 1 151,91 | ||||
| 2025-08-14 | 13F | Algert Global Llc | 14 822 | 1 | ||||||
| 2025-08-14 | 13F | Ubs Oconnor Llc | 80 000 | 0,00 | 3 101 | 45,00 | ||||
| 2025-08-14 | 13F | Banque Transatlantique SA | 0 | −100,00 | 0 | |||||
| 2025-08-14 | 13F | Verition Fund Management LLC | 418 112 | −27,65 | 16 206 | 4,92 | ||||
| 2025-08-14 | 13F | Dymon Asia Capital (singapore) Pte. Ltd. | 6 000 | 233 | ||||||
| 2025-08-05 | 13F | Bank of New York Mellon Corp | 364 156 | 60,16 | 14 115 | 132,25 | ||||
| 2025-08-13 | 13F | Brown Advisory Inc | 3 803 764 | −8,20 | 147 434 | 33,12 | ||||
| 2025-08-18 | 13F | Wolverine Trading, Llc | Call | 26 800 | 41,80 | 1 055 | 110,38 | |||
| 2025-08-18 | 13F | Wolverine Trading, Llc | Put | 12 700 | −56,80 | 500 | −36,03 | |||
| 2025-08-13 | 13F | Colonial Trust Advisors | 17 461 | 401,03 | 677 | 626,88 | ||||
| 2025-08-18 | 13F | Wolverine Trading, Llc | 11 359 | 447 | ||||||
| 2025-08-14 | 13F | Avala Global LP | 3 197 049 | −8,16 | 123 918 | 33,17 | ||||
| 2025-05-13 | 13F | Element Capital Management Llc | 0 | −100,00 | 0 | |||||
| 2025-08-05 | 13F | Corton Capital Inc. | 5 282 | 205 | ||||||
| 2025-08-08 | 13F | SG Americas Securities, LLC | 6 793 | −99,52 | 0 | −100,00 | ||||
| 2025-08-27 | NP | VQNPX - Vanguard Growth and Income Fund Investor Shares This fund is a listed as child fund of Vanguard Group Inc and if that institution has disclosed ownership in this security, then these positions will not be double counted when calculating total shares and total value | 85 100 | 3 298 | ||||||
| 2025-08-07 | 13F | Allworth Financial LP | 76 | 16,92 | 3 | 100,00 | ||||
| 2025-08-14 | 13F | Wellington Management Group Llp | 164 112 | 200,87 | 6 361 | 336,21 | ||||
| 2025-08-14 | 13F | Junto Capital Management LP | 2 499 571 | 31,24 | 96 883 | 90,30 | ||||
| 2025-08-08 | 13F | Hartland & Co., LLC | 0 | −100,00 | 0 | |||||
| 2025-08-12 | 13F | Magnetar Financial LLC | 27 324 | 1 059 | ||||||
| 2025-07-11 | 13F | Annex Advisory Services, LLC | 380 989 | 19,94 | 14 767 | 73,93 | ||||
| 2025-08-14 | 13F | Jain Global LLC | 324 840 | 1 443,26 | 12 591 | 2 140,21 | ||||
| 2025-08-12 | 13F | Aigen Investment Management, Lp | 8 962 | 347 | ||||||
| 2025-08-27 | NP | OHIO NATIONAL FUND INC - ON Janus Henderson Enterprise Portfolio | 1 990 | 0,00 | 77 | 45,28 | ||||
| 2025-08-13 | 13F | Healthcare Of Ontario Pension Plan Trust Fund | 55 600 | 2 155 | ||||||
| 2025-08-26 | NP | DSMDX - Driehaus Small/Mid Cap Growth Fund | 7 912 | 307 | ||||||
| 2025-08-26 | NP | GVIZX - Value Equity Index Fund Investor | 684 | 605,15 | 27 | 1 200,00 | ||||
| 2025-05-15 | 13F | Caption Management, LLC | Put | 0 | −100,00 | 0 | −100,00 | |||
| 2025-08-27 | NP | BBVSX - Bridge Builder Small/Mid Cap Value Fund | 4 155 | 137,70 | 161 | 250,00 | ||||
| 2025-08-13 | 13F | Jackson Creek Investment Advisors LLC | 33 690 | 1 | ||||||
| 2025-08-06 | 13F | SOUTH STATE Corp | 0 | −100,00 | 0 | |||||
| 2025-08-11 | 13F | BRILLIANCE ASSET MANAGEMENT Ltd | 805 842 | −77,32 | 31 234 | −67,12 | ||||
| 2025-08-14 | 13F | Tiger Pacific Capital LP | 787 495 | 153,12 | 30 523 | 267,08 | ||||
| 2025-06-26 | NP | TIEIX - TIAA-CREF Equity Index Fund Institutional Class | 54 314 | 0,00 | 1 317 | −24,14 | ||||
| 2025-08-14 | 13F | Perseverance Asset Management International | 615 197 | 549,33 | 23 845 | 841,75 | ||||
| 2025-07-29 | NP | VRTTX - Vanguard Russell 3000 Index Fund Institutional Shares | 6 360 | 34,95 | 231 | 65,00 | ||||
| 2025-08-26 | NP | TLSTX - Stock Index Fund | 2 031 | 853,52 | 79 | 1 460,00 | ||||
| 2025-08-14 | 13F | Farringdon Capital, Ltd. | 6 211 | 241 | ||||||
| 2025-08-28 | NP | SPWIX - Simt Small Cap Growth Fund Class I | 11 304 | −29,38 | 438 | 2,58 | ||||
| 2025-08-04 | 13F | Pinnacle Associates Ltd | 37 180 | −33,48 | 1 441 | −3,55 | ||||
| 2025-08-14 | 13F | Point72 Hong Kong Ltd | 1 564 283 | 60 632 | ||||||
| 2025-07-29 | NP | VFMO - Vanguard U.S. Momentum Factor ETF ETF Shares | 70 481 | 0,00 | 2 564 | 21,75 | ||||
| 2025-07-28 | 13F | BRYN MAWR TRUST Co | 3 180 | 123 | ||||||
| 2025-08-04 | 13F | Strs Ohio | 31 551 | −14,03 | 1 223 | 24,69 | ||||
| 2025-08-11 | 13F | Monashee Investment Management LLC | 0 | −100,00 | 0 | |||||
| 2025-08-08 | 13F | Pnc Financial Services Group, Inc. | 351 | 23,16 | 14 | 85,71 | ||||
| 2025-08-14 | 13F | Cubist Systematic Strategies, LLC | 624 772 | 24 216 | ||||||
| 2025-08-14 | 13F | Fred Alger Management, Llc | 0 | −100,00 | 0 | |||||
| 2025-07-25 | 13F | Cwm, Llc | 4 935 | −16,11 | 0 | |||||
| 2025-07-10 | 13F | Exchange Traded Concepts, Llc | 155 633 | 6 032 | ||||||
| 2025-08-13 | 13F | Jump Financial, LLC | 335 120 | 12 989 | ||||||
| 2025-08-04 | 13F | Amalgamated Bank | 7 651 | 135,34 | 0 | |||||
| 2025-08-13 | 13F | State Board Of Administration Of Florida Retirement System | 52 802 | 2 047 | ||||||
| 2025-08-14 | 13F | Interval Partners, LP | 1 087 599 | 463,10 | 42 155 | 716,64 | ||||
| 2025-04-23 | 13F | Sabal Trust CO | 62 708 | −19,68 | 1 676 | −23,19 | ||||
| 2025-08-13 | 13F | Northern Trust Corp | 291 073 | 145,36 | 11 282 | 255,87 | ||||
| 2025-07-28 | 13F | Harbour Investments, Inc. | 25 | 1 | ||||||
| 2025-08-14 | 13F | Aqr Capital Management Llc | 48 329 | 128,78 | 1 873 | 232,09 | ||||
| 2025-08-14 | 13F | Polymer Capital Management (HK) LTD | 934 324 | 217,81 | 36 214 | 360,86 | ||||
| 2025-06-26 | NP | TSMOX - TIAA-CREF Quant Small/Mid-Cap Equity Fund Retirement Class | 108 810 | 5,03 | 2 639 | −20,35 | ||||
| 2025-07-28 | NP | AVUS - Avantis U.S. Equity ETF This fund is a listed as child fund of American Century Companies Inc and if that institution has disclosed ownership in this security, then these positions will not be double counted when calculating total shares and total value | 6 157 | 0,00 | 224 | 21,20 | ||||
| 2025-08-14 | 13F | Point72 Asset Management, L.P. | 2 361 582 | 91 535 | ||||||
| 2025-08-13 | 13F | Kayne Anderson Rudnick Investment Management Llc | 71 | 3 | ||||||
| 2025-08-05 | 13F | GPS Wealth Strategies Group, LLC | 6 | 500,00 | 0 | |||||
| 2025-08-14 | 13F | Wells Fargo & Company/mn | 2 717 | 290,37 | 105 | 483,33 | ||||
| 2025-08-27 | NP | ALLIANZ VARIABLE INSURANCE PRODUCTS TRUST - AZL Russell 1000 Value Index Fund Class 2 | 3 331 | 112,44 | 129 | 214,63 | ||||
| 2025-08-01 | 13F | Oversea-Chinese Banking CORP Ltd | 270 948 | 12,69 | 10 497 | 63,44 | ||||
| 2025-08-05 | 13F | Sigma Planning Corp | 20 000 | 0,00 | 775 | 45,13 | ||||
| 2025-05-14 | 13F | Susquehanna International Group, Llp | 0 | −100,00 | 0 | −100,00 | ||||
| 2025-08-04 | 13F | Hantz Financial Services, Inc. | 28 | −42,86 | 0 | |||||
| 2025-08-12 | 13F | Trexquant Investment LP | 204 143 | −74,48 | 7 913 | −63,00 | ||||
| 2025-08-07 | 13F | Illinois Municipal Retirement Fund | 58 104 | 139,45 | 2 252 | 247,53 | ||||
| 2025-08-12 | 13F | Global Retirement Partners, LLC | 28 | 40,00 | 1 | |||||
| 2025-08-06 | 13F | Penserra Capital Management LLC | 7 601 | 63 241,67 | 0 | |||||
| 2025-07-28 | 13F | Copia Wealth Management | 50 | 0,00 | 2 | 0,00 | ||||
| 2025-08-14 | 13F | Balyasny Asset Management Llc | 2 251 982 | 87 287 | ||||||
| 2025-08-27 | NP | BBVLX - Bridge Builder Large Cap Value Fund | 4 880 | 84,22 | 189 | 170,00 | ||||
| 2025-08-27 | 13F/A | Squarepoint Ops LLC | 15 026 | −36,38 | 582 | −7,77 | ||||
| 2025-08-14 | 13F | Manufacturers Life Insurance Company, The | 52 925 | −40,18 | 2 051 | −13,24 | ||||
| 2025-08-11 | 13F | EntryPoint Capital, LLC | 0 | −100,00 | 0 | |||||
| 2025-08-15 | 13F/A | Rakuten Securities, Inc. | 3 128 | 3 375,56 | 121 | 5 950,00 | ||||
| 2025-08-12 | 13F | Proequities, Inc. | 0 | 0 | ||||||
| 2025-08-12 | 13F | Entropy Technologies, LP | 25 218 | −32,28 | 977 | −1,81 | ||||
| 2025-08-01 | 13F | Y-Intercept (Hong Kong) Ltd | 117 585 | 4 558 | ||||||
| 2025-08-14 | 13F | Ieq Capital, Llc | 5 200 | 202 | ||||||
| 2025-08-14 | 13F | Sherbrooke Park Advisers Llc | 24 502 | 46,01 | 950 | 111,83 | ||||
| 2025-08-01 | 13F | Bessemer Group Inc | 0 | −100,00 | 0 | |||||
| 2025-08-14 | 13F | Boston Private Wealth Llc | 0 | −100,00 | 0 | |||||
| 2025-08-14 | 13F | Temasek Holdings (Private) Ltd | 0 | −100,00 | 0 | |||||
| 2025-07-21 | 13F | WT Asset Management Ltd | 1 088 201 | −54,98 | 42 179 | −34,71 | ||||
| 2025-08-13 | 13F | Jones Financial Companies Lllp | 988 | 223,93 | 39 | 375,00 | ||||
| 2025-07-23 | 13F | Vontobel Holding Ltd. | 9 148 | 0,00 | 355 | 45,08 | ||||
| 2025-05-28 | NP | QCEQRX - Equity Index Account Class R1 | 13 448 | 0,00 | 359 | −4,52 | ||||
| 2025-08-05 | 13F | Eleva Capital SAS | 101 694 | 3 942 | ||||||
| 2025-06-26 | NP | TILVX - TIAA-CREF Large-Cap Value Index Fund Institutional Class | 25 233 | 0,00 | 612 | −24,19 | ||||
| 2025-08-11 | 13F | Hexagon Capital Partners LLC | 0 | −100,00 | 0 | |||||
| 2025-08-26 | NP | WCFOX - WCM Focused International Opportunities Fund Investor Class Shares | 17 540 | −25,36 | 680 | 8,12 | ||||
| 2025-05-15 | 13F | Symmetry Investments LP | 0 | −100,00 | 0 | |||||
| 2025-04-23 | 13F | E Fund Management (Hong Kong) Co., Ltd. | 0 | −100,00 | 0 | |||||
| 2025-07-30 | 13F | Ethic Inc. | 6 837 | 269 | ||||||
| 2025-08-14 | 13F | Hook Mill Capital Partners, LP | 887 153 | −23,29 | 34 386 | 11,23 | ||||
| 2025-07-24 | 13F | Us Bancorp \de\ | 2 031 | 17,06 | 79 | 69,57 | ||||
| 2025-08-11 | 13F | Rothschild Investment Llc | 60 | 0,00 | 2 | 100,00 | ||||
| 2025-08-14 | 13F | Price T Rowe Associates Inc /md/ | 56 720 | 137,93 | 2 | |||||
| 2025-07-07 | 13F | Versant Capital Management, Inc | 349 | 14 | ||||||
| 2025-08-05 | 13F | NewSquare Capital LLC | 49 | 96,00 | 2 | |||||
| 2025-08-08 | 13F | Pinnbrook Capital Management Lp | 232 743 | 9 021 | ||||||
| 2025-08-14 | 13F | FIL Ltd | 1 355 000 | −33,90 | 52 520 | −4,16 | ||||
| 2025-08-22 | NP | Columbia Funds Variable Series Trust II - Columbia Variable Portfolio - Emerging Markets Fund Class 3 | 90 886 | 3 523 | ||||||
| 2025-08-12 | 13F | Rhumbline Advisers | 123 568 | 150,86 | 4 789 | 263,91 | ||||
| 2025-08-14 | 13F | Monolith Management Ltd | 0 | −100,00 | 0 | |||||
| 2025-08-14 | 13F | Canada Pension Plan Investment Board | 738 038 | 218,86 | 28 606 | 362,43 | ||||
| 2025-08-14 | 13F | Occudo Quantitative Strategies Lp | 124 062 | 433,42 | 4 809 | 679,25 | ||||
| 2025-08-14 | 13F | Point72 (DIFC) Ltd | 44 744 | 1 734 | ||||||
| 2025-08-28 | NP | SLGFX - SIMT Large Cap Index Fund Class F | 2 945 | 157,21 | 114 | 280,00 | ||||
| 2025-08-18 | 13F/A | National Bank Of Canada /fi/ | 76 139 | 52 409,66 | 2 951 | 98 266,67 | ||||
| 2025-07-28 | NP | AVLC - Avantis U.S. Large Cap Equity ETF | 1 231 | 52,54 | 45 | 83,33 | ||||
| 2025-08-14 | 13F | Bridgefront Capital, LLC | 8 531 | 331 | ||||||
| 2025-08-13 | 13F | ExodusPoint Capital Management, LP | 0 | −100,00 | 0 | |||||
| 2025-08-14 | 13F | Samlyn Capital, Llc | 1 549 346 | −5,21 | 60 053 | 37,46 | ||||
| 2025-07-22 | 13F | Net Worth Advisory Group | 8 385 | 325 | ||||||
| 2025-08-27 | NP | VMNFX - Vanguard Market Neutral Fund Investor Shares This fund is a listed as child fund of Vanguard Group Inc and if that institution has disclosed ownership in this security, then these positions will not be double counted when calculating total shares and total value | Short | −16 750 | −27,18 | −649 | 5,70 | |||
| 2025-05-14 | 13F | Greenwoods Asset Management Hong Kong Ltd. | 0 | −100,00 | 0 | −100,00 | ||||
| 2025-08-14 | 13F | Seldon Capital Lp | 274 156 | 10 626 | ||||||
| 2025-08-13 | 13F | BCJ Capital Management, LLC | 98 573 | 3 821 | ||||||
| 2025-07-29 | NP | CAVAX - Catholic Values Equity Fund Class F, effective 1-31-2017 (formerly Class A) | 3 653 | 0,00 | 133 | 21,10 | ||||
| 2025-07-16 | 13F | ORG Partners LLC | 40 | 2 | ||||||
| 2025-08-14 | 13F | Sandia Investment Management LP | 10 000 | 300,00 | 388 | 486,36 | ||||
| 2025-08-29 | 13F | Infini Capital Management Ltd | 135 000 | 5 233 | ||||||
| 2025-07-31 | 13F | Nisa Investment Advisors, Llc | 37 025 | −11,48 | 1 435 | 28,35 | ||||
| 2025-08-13 | 13F | EverSource Wealth Advisors, LLC | 492 | 57,19 | 19 | 137,50 | ||||
| 2025-08-14 | 13F | Macquarie Group Ltd | 3 000 | 116 | ||||||
| 2025-08-14 | 13F | Jane Street Group, Llc | Put | 0 | −100,00 | 0 | −100,00 | |||
| 2025-07-29 | 13F | Wcm Investment Management, Llc | 140 555 | −24,24 | 5 532 | 12,32 | ||||
| 2025-05-15 | 13F | Davidson Kempner Capital Management Lp | 0 | −100,00 | 0 | −100,00 | ||||
| 2025-08-14 | 13F | Caption Management, LLC | 25 000 | 969 | ||||||
| 2025-08-14 | 13F | Hudson Bay Capital Management LP | 0 | −100,00 | 0 | |||||
| 2025-08-14 | 13F | Qube Research & Technologies Ltd | 3 887 480 | 139,91 | 150 679 | 247,88 | ||||
| 2025-08-14 | 13F | Toroso Investments, LLC | 8 479 | 329 | ||||||
| 2025-08-11 | 13F | Citigroup Inc | 99 098 | −77,56 | 3 841 | −67,46 | ||||
| 2025-08-13 | 13F | Renaissance Technologies Llc | 1 027 700 | 62,45 | 39 834 | 135,56 | ||||
| 2025-08-13 | 13F | Colonial Trust Co / SC | 7 070 | 283,82 | 274 | 459,18 | ||||
| 2025-04-24 | NP | NGCAX - Columbia Greater China Fund Class A | 6 936 | −43,66 | 207 | −36,11 | ||||
| 2025-07-29 | NP | SLPAX - Siit Small Cap Fund - Class A | 4 223 | −58,67 | 154 | −49,84 | ||||
| 2025-05-30 | NP | SLLAX - SIMT Small Cap Fund Class F | 11 138 | −33,79 | 298 | −36,81 | ||||
| 2025-08-14 | 13F | Bayesian Capital Management, LP | 36 863 | 1 429 | ||||||
| 2025-08-14 | 13F | Voloridge Investment Management, Llc | 2 017 660 | 84,69 | 78 205 | 167,81 | ||||
| 2025-08-14 | 13F | Oxbow Capital Management (HK) Ltd | 1 456 902 | −1,82 | 56 470 | 42,36 | ||||
| 2025-08-13 | 13F | Pinpoint Asset Management (Singapore) Pte. Ltd. | 489 240 | 18 963 | ||||||
| 2025-07-08 | 13F | Parallel Advisors, LLC | 2 118 | −14,18 | 82 | 26,15 | ||||
| 2025-08-14 | 13F | Armistice Capital, Llc | 101 309 | −7,05 | 3 927 | 34,78 | ||||
| 2025-08-27 | NP | HCIGX - The Institutional Growth Equity Portfolio HC Strategic Shares | 758 | 68,44 | 29 | 141,67 | ||||
| 2025-06-30 | NP | VT - Vanguard Total World Stock Index Fund ETF Shares | 42 639 | 21,21 | 1 034 | −8,10 | ||||
| 2025-08-07 | 13F | Los Angeles Capital Management Llc | 47 260 | 1 832 | ||||||
| 2025-08-14 | 13F | Hancock Whitney Corp | 62 159 | 2 409 | ||||||
| 2025-08-14 | 13F | Engineers Gate Manager LP | 445 824 | 278,08 | 17 280 | 448,40 | ||||
| 2025-08-12 | 13F | EAM Global Investors LLC | 157 766 | −0,04 | 6 115 | 44,97 | ||||
| 2025-08-13 | 13F | Federated Hermes, Inc. | 9 295 | 1 399,19 | 360 | 2 150,00 | ||||
| 2025-07-18 | 13F | Renaissance Capital LLC | 123 958 | −1,08 | 4 805 | 43,45 | ||||
| 2025-08-01 | 13F | Envestnet Asset Management Inc | 22 301 | −10,96 | 864 | 29,15 | ||||
| 2025-07-18 | 13F | CHURCHILL MANAGEMENT Corp | 16 698 | 647 | ||||||
| 2025-05-12 | 13F | Pinpoint Asset Management Ltd | 114 940 | −74,84 | 3 072 | −75,95 | ||||
| 2025-07-15 | 13F | Mather Group, Llc. | 0 | −100,00 | 0 | |||||
| 2025-08-14 | 13F | Man Group plc | 1 334 310 | 12,81 | 51 718 | 63,58 | ||||
| 2025-08-14 | 13F | Nicholas Investment Partners, LP | 19 852 | 769 | ||||||
| 2025-07-29 | NP | SMXAX - SIIT Extended Market Index Fund - Class A | 9 100 | 0,00 | 331 | 22,14 | ||||
| 2025-08-13 | 13F | Blueshift Asset Management, LLC | 15 137 | 587 | ||||||
| 2025-08-13 | 13F | New York State Common Retirement Fund | 66 700 | 134,86 | 3 | |||||
| 2025-07-09 | 13F | Bruce G. Allen Investments, LLC | 112 | 0,00 | 4 | 100,00 | ||||
| 2025-07-09 | 13F | Massmutual Trust Co Fsb/adv | 57 | −73,49 | 2 | −60,00 | ||||
| 2025-07-24 | 13F | Ronald Blue Trust, Inc. | 43 | 2 | ||||||
| 2025-08-12 | 13F | Axq Capital, Lp | 21 808 | −31,95 | 845 | −1,29 | ||||
| 2025-08-13 | 13F | Marshall Wace, Llp | 3 747 775 | 32,46 | 145 264 | 92,07 | ||||
| 2025-07-14 | 13F | Pacifica Partners Inc. | 100 | 0,00 | 4 | 50,00 | ||||
| 2025-07-15 | 13F | Public Employees Retirement System Of Ohio | 46 315 | 139,06 | 1 795 | 247,20 | ||||
| 2025-07-30 | 13F | Cookson Peirce & Co Inc | 53 625 | 2 079 | ||||||
| 2025-08-08 | 13F | Compass Financial Services Inc | 97 | 0,00 | 4 | 50,00 | ||||
| 2025-08-11 | 13F | WPG Advisers, LLC | 172 | 7 | ||||||
| 2025-08-08 | 13F | Police & Firemen's Retirement System of New Jersey | 56 877 | 148,91 | 2 205 | 261,31 | ||||
| 2025-08-15 | 13F | Tower Research Capital LLC (TRC) | 1 436 | −76,06 | 56 | −65,62 | ||||
| 2025-07-29 | 13F | Activest Wealth Management | 0 | −100,00 | 0 | |||||
| 2025-08-12 | 13F | Charles Schwab Investment Management Inc | 30 938 | 149,78 | 1 199 | 262,24 | ||||
| 2025-06-26 | NP | JHML - John Hancock Multifactor Large Cap ETF | 642 | 16 | ||||||
| 2025-08-11 | 13F | Qsemble Capital Management, LP | 39 020 | 1 512 | ||||||
| 2025-08-13 | 13F | Arrowstreet Capital, Limited Partnership | 3 121 218 | −9,36 | 120 978 | 31,43 | ||||
| 2025-08-12 | 13F | Handelsbanken Fonder AB | 34 600 | 27,68 | 1 | |||||
| 2025-07-28 | NP | MSSM - Morgan Stanley Pathway Small-Mid Cap Equity ETF | 2 788 | 26,55 | 101 | 55,38 | ||||
| 2025-05-15 | 13F | Oasis Management Co Ltd. | 0 | −100,00 | 0 | |||||
| 2025-08-14 | 13F | Soros Fund Management Llc | 625 890 | 13,74 | 24 259 | 64,94 | ||||
| 2025-05-13 | 13F | Clear Street Markets Llc | 0 | −100,00 | 0 | −100,00 | ||||
| 2025-07-22 | 13F | Gsa Capital Partners Llp | 41 216 | 348,19 | 2 | |||||
| 2025-08-12 | 13F | DnB Asset Management AS | 17 405 | 0,00 | 674 | 44,95 | ||||
| 2025-08-14 | 13F | Prelude Capital Management, Llc | 0 | −100,00 | 0 | |||||
| 2025-08-15 | 13F | Keel Point, LLC | 6 651 | 258 | ||||||
| 2025-05-15 | 13F | Rakuten Investment Management, Inc. | 1 100 | 29 | ||||||
| 2025-08-12 | 13F | Nuveen, LLC | 481 694 | 40,42 | 18 670 | 103,62 | ||||
| 2025-08-13 | 13F | Quadrature Capital Ltd | 67 360 | 70,44 | 2 610 | 147,39 | ||||
| 2025-08-01 | 13F | Jennison Associates Llc | 0 | −100,00 | 0 | −100,00 | ||||
| 2025-07-16 | 13F | Signaturefd, Llc | 4 455 | −9,54 | 173 | 31,30 | ||||
| 2025-08-14 | 13F | Lord, Abbett & Co. Llc | 137 622 | 5 | ||||||
| 2025-07-29 | NP | SLCAX - Siit Large Cap Fund - Class A | 2 245 | −75,26 | 82 | −70,11 | ||||
| 2025-08-14 | 13F | Hrt Financial Lp | 177 833 | 229,60 | 7 | 500,00 | ||||
| 2025-08-13 | 13F | PharVision Advisers, LLC | 6 443 | 250 | ||||||
| 2025-08-14 | 13F | LMR Partners LLP | 18 430 | −25,54 | 714 | 8,02 | ||||
| 2025-08-28 | NP | SEMCX - Simt Mid Cap Fund Class F | 3 810 | 148 | ||||||
| 2025-08-11 | 13F | Artemis Investment Management LLP | 18 603 | −13,39 | 721 | 25,61 | ||||
| 2025-08-12 | 13F | BlackRock, Inc. | 3 216 077 | 122,03 | 124 655 | 221,96 | ||||
| 2025-08-13 | 13F | MetLife Investment Management, LLC | 2 485 | 119,72 | 96 | 220,00 | ||||
| 2025-08-14 | 13F | Two Sigma Advisers, Lp | 847 400 | 127,00 | 32 845 | 229,17 | ||||
| 2025-08-14 | 13F | Graham Capital Management, L.P. | 110 948 | 4 300 | ||||||
| 2025-05-14 | 13F | Dnca Finance | 0 | −100,00 | 0 | |||||
| 2025-08-13 | 13F | Hsbc Holdings Plc | 37 560 | 1 482 | ||||||
| 2025-08-14 | 13F | Candlestick Capital Management LP | 2 866 290 | −14,64 | 111 097 | 23,78 | ||||
| 2025-03-31 | NP | DAACX - Diversified Equity Fund | 708 | 0,00 | 23 | 83,33 | ||||
| 2025-07-15 | 13F | Mainstream Capital Management LLC | 16 850 | 0,00 | 653 | 45,11 | ||||
| 2025-08-14 | 13F | Woodline Partners LP | 0 | −100,00 | 0 | −100,00 | ||||
| 2025-08-28 | 13F | China Universal Asset Management Co., Ltd. | 84 140 | −25,08 | 3 261 | 8,66 | ||||
| 2025-07-28 | 13F | Virtus Wealth Solutions LLC | 375 391 | 14 550 | ||||||
| 2025-08-13 | 13F | Northwestern Mutual Wealth Management Co | 3 364 | 276,29 | 130 | 465,22 | ||||
| 2025-08-14 | 13F | Numerai GP LLC | 32 217 | −34,31 | 1 249 | −4,73 | ||||
| 2025-08-13 | 13F | First Trust Advisors Lp | 65 915 | 63,31 | 2 555 | 136,92 | ||||
| 2025-08-13 | 13F | Northwest & Ethical Investments L.P. | 31 053 | 1 204 | ||||||
| 2025-07-29 | NP | VRVIX - Vanguard Russell 1000 Value Index Fund Institutional Shares | 45 823 | 59,42 | 1 667 | 94,06 | ||||
| 2025-08-14 | 13F | Citadel Advisors Llc | Put | 102 400 | 70,10 | 3 969 | 146,67 | |||
| 2025-05-06 | 13F | Proficio Capital Partners LLC | 0 | −100,00 | 0 | −100,00 | ||||
| 2025-08-14 | 13F | Ameriprise Financial Inc | 1 387 213 | 15 325,48 | 53 768 | 22 303,33 | ||||
| 2025-08-14 | 13F | Anomaly Capital Management, LP | 2 221 607 | 19,79 | 86 109 | 73,70 | ||||
| 2025-08-14 | 13F | Citadel Advisors Llc | Call | 32 600 | 191,07 | 1 264 | 322,41 | |||
| 2025-08-14 | 13F | Petrus Trust Company, LTA | 10 330 | −23,42 | 400 | 11,11 | ||||
| 2025-08-14 | 13F | Citadel Advisors Llc | 645 170 | 1 964,54 | 25 007 | 2 894,73 | ||||
| 2025-08-14 | 13F | Driehaus Capital Management Llc | 319 969 | 12 402 | ||||||
| 2025-08-12 | 13F | Corebridge Financial, Inc. | 0 | −100,00 | 0 | |||||
| 2025-08-14 | 13F | Bank Of America Corp /de/ | 1 546 319 | 9,21 | 59 935 | 58,36 | ||||
| 2025-08-14 | 13F | Hood River Capital Management LLC | 227 850 | −17,98 | 8 831 | 18,94 | ||||
| 2025-08-12 | 13F | Dimensional Fund Advisors Lp | 22 244 | 1,87 | 862 | 47,86 | ||||
| 2025-08-05 | 13F | Simplex Trading, Llc | 7 474 | 0 | ||||||
| 2025-07-29 | NP | VRNIX - Vanguard Russell 1000 Index Fund Institutional Shares | 12 873 | 43,50 | 468 | 74,63 | ||||
| 2025-08-13 | 13F | OPTIMAS CAPITAL Ltd | 55 000 | 2 132 | ||||||
| 2025-08-14 | 13F | SummitTX Capital, L.P. | 13 322 | −44,66 | 516 | −19,75 | ||||
| 2025-08-19 | 13F | State of Wyoming | 10 336 | −0,91 | 401 | 43,88 | ||||
| 2025-08-11 | 13F | Covestor Ltd | 4 331 | 813,71 | 0 | |||||
| 2025-08-13 | 13F | Centiva Capital, LP | 385 122 | 2 253,61 | 14 927 | 3 315,79 | ||||
| 2025-08-13 | 13F | Walleye Capital LLC | Call | 13 400 | −82,18 | 519 | −74,18 | |||
| 2025-08-13 | 13F | Walleye Capital LLC | 736 740 | 212,27 | 28 556 | 352,84 | ||||
| 2025-08-13 | 13F | Walleye Capital LLC | Put | 5 400 | 54,29 | 209 | 124,73 | |||
| 2025-07-16 | 13F | Highline Wealth Partners Llc | 6 | 0,00 | 0 | |||||
| 2025-08-14 | 13F | Mane Global Capital Management Lp | 1 480 433 | 13 826,93 | 57 382 | 20 104,58 | ||||
| 2025-08-14 | 13F | State Street Corp | 1 297 491 | 112,68 | 50 291 | 208,41 | ||||
| 2025-08-11 | 13F | Keystone Investors Pte Ltd | 433 170 | 220,64 | 16 790 | 364,94 | ||||
| 2025-08-28 | NP | TIAA SEPARATE ACCOUNT VA 1 - Stock Index Account Teachers Personal Annuity Individual Deferred Variable Annuity | 3 260 | 522,14 | 126 | 800,00 | ||||
| 2025-08-14 | 13F | PDT Partners, LLC | 193 531 | 34,86 | 7 501 | 95,59 | ||||
| 2025-04-29 | NP | SEIAX - SIIT Multi-Asset Real Return Fund - Class A | 0 | −100,00 | 0 | −100,00 | ||||
| 2025-08-12 | 13F | Tairen Capital Ltd | 551 630 | 26,52 | 21 381 | 83,46 | ||||
| 2025-08-12 | 13F | LPL Financial LLC | 22 963 | 36,02 | 890 | 97,34 | ||||
| 2025-07-21 | 13F | Platinum Investment Management Ltd | 190 000 | −5,00 | 7 364 | 37,75 | ||||
| 2025-08-06 | 13F | Trivest Advisors Ltd | 2 070 000 | −1,94 | 80 233 | 42,19 | ||||
| 2025-08-11 | 13F | Principal Securities, Inc. | 732 | 11,25 | 28 | 55,56 | ||||
| 2025-08-18 | 13F | Hollencrest Capital Management | 2 635 | 102 | ||||||
| 2025-08-14 | 13F | Burkehill Global Management, LP | 400 000 | 15 504 | ||||||
| 2025-08-13 | 13F | 1832 Asset Management L.P. | 84 300 | 3 267 | ||||||
| 2025-08-14 | 13F | Weiss Asset Management LP | 35 950 | 1 393 | ||||||
| 2025-07-11 | 13F | Farther Finance Advisors, LLC | 114 | 0,00 | 4 | 33,33 | ||||
| 2025-08-12 | 13F | Jpmorgan Chase & Co | 626 433 | 11 946,79 | 24 281 | 17 494,20 | ||||
| 2025-08-12 | 13F | Ci Investments Inc. | 167 | −5,11 | 0 | |||||
| 2025-08-14 | 13F | Gotham Asset Management, LLC | 915 306 | 24,45 | 35 477 | 80,46 | ||||
| 2025-08-14 | 13F | Smartleaf Asset Management LLC | 1 591 | 174,31 | 63 | 313,33 | ||||
| 2025-08-27 | NP | BBGSX - Bridge Builder Small/Mid Cap Growth Fund | 243 002 | 9 419 | ||||||
| 2025-08-13 | 13F | Natixis Advisors, L.p. | 11 800 | 0 | ||||||
| 2025-07-14 | 13F | GAMMA Investing LLC | 2 614 | 17,38 | 101 | 71,19 | ||||
| 2025-07-22 | 13F | Capricorn Fund Managers Ltd | 134 602 | 22,37 | 5 217 | 77,45 | ||||
| 2025-08-13 | 13F | Rsm Us Wealth Management Llc | 9 854 | 21,44 | 382 | 76,39 | ||||
| 2025-07-15 | 13F | Fifth Third Bancorp | 92 | 4 | ||||||
| 2025-08-13 | 13F | Mount Yale Investment Advisors, LLC | 130 | 5 | ||||||
| 2025-07-23 | 13F | Friedenthal Financial | 0 | −100,00 | 0 | |||||
| 2025-08-06 | 13F | Fox Run Management, L.l.c. | 41 842 | 299,52 | 1 622 | 481,00 | ||||
| 2025-06-26 | NP | KCEVX - Knights of Columbus Long/Short Equity Fund Investor Shares | Short | −94 019 | −2 280 | |||||
| 2025-08-14 | 13F | Royal Bank Of Canada | 1 636 283 | 8 823,88 | 63 422 | 12 843,27 | ||||
| 2025-07-16 | 13F | Dakota Wealth Management | 0 | −100,00 | 0 | |||||
| 2025-08-14 | 13F | DZ BANK AG Deutsche Zentral Genossenschafts Bank, Frankfurt am Main | 206 175 | −37,53 | 7 991 | −9,42 | ||||
| 2025-08-27 | NP | VTCLX - Vanguard Tax-Managed Capital Appreciation Fund Admiral Shares This fund is a listed as child fund of Vanguard Group Inc and if that institution has disclosed ownership in this security, then these positions will not be double counted when calculating total shares and total value | 24 274 | 34,95 | 941 | 95,83 | ||||
| 2025-07-29 | 13F | Private Wealth Management Group, LLC | 187 | 0,00 | 7 | 75,00 | ||||
| 2025-08-13 | 13F | Quantbot Technologies LP | 386 867 | 77,56 | 14 995 | 157,50 | ||||
| 2025-08-14 | 13F/A | Skopos Labs, Inc. | 153 | 206,00 | 6 | 400,00 | ||||
| 2025-07-28 | NP | EQAL - Invesco Russell 1000 Equal Weight ETF This fund is a listed as child fund of Invesco Ltd. and if that institution has disclosed ownership in this security, then these positions will not be double counted when calculating total shares and total value | 12 436 | −5,41 | 452 | 15,31 | ||||
| 2025-08-08 | 13F | SBI Securities Co., Ltd. | 897 | 146,43 | 35 | 277,78 | ||||
| 2025-08-12 | 13F | American Century Companies Inc | 12 188 | 472 | ||||||
| 2025-07-28 | NP | MSLC - Morgan Stanley Pathway Large Cap Equity ETF | 1 897 | 0,00 | 69 | 23,21 | ||||
| 2025-05-30 | NP | SIFAX - SIMT MULTI-ASSET INFLATION MANAGED FUND Class F | 0 | −100,00 | 0 | −100,00 | ||||
| 2025-08-05 | 13F | Huntington National Bank | 428 | 0,00 | 17 | 45,45 | ||||
| 2025-08-14 | 13F | Fmr Llc | 22 646 048 | −13,56 | 877 761 | 25,35 | ||||
| 2025-08-14 | 13F | Headlands Technologies LLC | 55 078 | 9 512,22 | 2 135 | 14 126,67 | ||||
| 2025-08-13 | 13F | Mackenzie Financial Corp | 48 205 | 0,00 | 1 868 | 45,03 | ||||
| 2025-07-23 | 13F | GGM Financials LLC | 375 391 | 14 550 | ||||||
| 2025-08-14 | 13F | Susquehanna International Group, Llp | Put | 28 200 | −5,05 | 1 093 | 37,83 | |||
| 2025-08-12 | 13F | Legal & General Group Plc | 16 404 | 103,17 | 636 | 195,35 | ||||
| 2025-08-14 | 13F | Susquehanna International Group, Llp | Call | 196 000 | 713,28 | 7 597 | 1 079,50 | |||
| 2025-08-13 | 13F | Seven Grand Managers, Llc | 300 000 | 0,00 | 11 628 | 45,01 | ||||
| 2025-08-27 | NP | BBTSX - Bridge Builder Tax Managed Small/Mid Cap Fund | 131 862 | 0,00 | 5 111 | 45,01 | ||||
| 2025-08-14 | 13F | Woodson Capital Management, LP | 842 100 | −14,34 | 32 640 | 24,21 | ||||
| 2025-08-14 | 13F | Group One Trading, L.p. | 3 961 | −57,22 | 154 | −38,06 | ||||
| 2025-05-16 | 13F | Sciencast Management LP | 0 | −100,00 | 0 | |||||
| 2025-08-14 | 13F | Freestone Grove Partners LP | 96 839 | 3 753 | ||||||
| 2025-08-13 | 13F | Thornburg Investment Management Inc | 66 478 | −77,03 | 2 577 | −96,67 | ||||
| 2025-08-14 | 13F | Millennium Management Llc | 658 317 | 319,49 | 25 516 | 508,39 | ||||
| 2025-08-14 | 13F | Mariner, LLC | 6 453 | 250 | ||||||
| 2025-05-05 | 13F | Lindbrook Capital, Llc | 643 | 2,55 | 17 | 0,00 | ||||
| 2025-08-13 | 13F | Russell Investments Group, Ltd. | 29 750 | −92,53 | 1 153 | −89,18 | ||||
| 2025-08-12 | 13F | Jefferies Financial Group Inc. | 140 522 | 5 447 | ||||||
| 2025-07-23 | 13F | Maryland State Retirement & Pension System | 7 250 | 281 | ||||||
| 2025-08-14 | 13F | Hudson Bay Capital Management LP | Put | 0 | −100,00 | 0 | ||||
| 2025-07-31 | 13F | West Michigan Advisors, Llc | 6 911 | −59,05 | 268 | −40,80 | ||||
| 2025-08-14 | 13F | Two Sigma Investments, Lp | 505 418 | 61,42 | 19 590 | 134,08 | ||||
| 2025-08-26 | NP | IWB - iShares Russell 1000 ETF | 107 744 | 156,43 | 4 176 | 271,86 | ||||
| 2025-08-13 | 13F | Walleye Trading LLC | Call | 99 300 | 333,62 | 3 849 | 528,76 | |||
| 2025-08-14 | 13F | Goldman Sachs Group Inc | 1 233 736 | 5,12 | 47 820 | 52,43 | ||||
| 2025-07-21 | 13F | 111 Capital | 7 044 | 273 | ||||||
| 2025-08-13 | 13F | Walleye Trading LLC | Put | 25 100 | 50,30 | 973 | 117,94 | |||
| 2025-08-14 | 13F | Shellback Capital, LP | 787 000 | −9,54 | 30 504 | 31,17 | ||||
| 2025-06-30 | NP | IDMO - Invesco S&P International Developed Momentum ETF This fund is a listed as child fund of Invesco Ltd. and if that institution has disclosed ownership in this security, then these positions will not be double counted when calculating total shares and total value | 12 511 | 303 | ||||||
| 2025-07-25 | 13F | JustInvest LLC | 10 232 | 397 | ||||||
| 2025-07-17 | 13F | Halbert Hargrove Global Advisors, Llc | 0 | −100,00 | 0 | |||||
| 2025-07-30 | 13F | FNY Investment Advisers, LLC | 42 030 | 2 | ||||||
| 2025-08-11 | 13F | TD Waterhouse Canada Inc. | 12 119 | 474,91 | 456 | 714,29 | ||||
| 2025-08-14 | 13F | Schonfeld Strategic Advisors LLC | 347 028 | 385,76 | 13 451 | 604,56 | ||||
| 2025-08-07 | 13F | Parkside Financial Bank & Trust | 473 | 0,00 | 18 | 50,00 | ||||
| 2025-08-14 | 13F | Twinbeech Capital Lp | 74 566 | −84,90 | 2 890 | −78,11 | ||||
| 2025-08-14 | 13F | Lazard Asset Management Llc | 142 876 | 9,90 | 6 | 66,67 | ||||
| 2025-08-14 | 13F | Ghisallo Capital Management LLC | 1 000 000 | 2,56 | 38 760 | 48,73 | ||||
| 2025-08-12 | 13F | MAI Capital Management | 198 | 382,93 | 8 | 600,00 | ||||
| 2025-06-23 | NP | PPSFX - LargeCap Value Fund III R-3 | 1 307 | 0,00 | 32 | −24,39 | ||||
| 2025-08-14 | 13F | Ubs Asset Management Americas Inc | 66 635 | 2 583 | ||||||
| 2025-08-13 | 13F | Walleye Trading LLC | 0 | −100,00 | 0 | −100,00 | ||||
| 2025-09-04 | 13F/A | Advisor Group Holdings, Inc. | 74 793 | 2 898 | ||||||
| 2025-05-09 | 13F | Pamalican Asset Management Ltd | 0 | −100,00 | 0 | |||||
| 2025-08-29 | NP | BAFE - Brown Advisory Flexible Equity ETF | 712 911 | 14,19 | 27 632 | 65,59 | ||||
| 2025-08-14 | 13F | Aster Capital Management (DIFC) Ltd | 986 | −98,13 | 38 | −97,59 | ||||
| 2025-08-14 | 13F | Alliancebernstein L.p. | 84 696 | −62,95 | 3 283 | −46,28 | ||||
| 2025-05-07 | 13F | MRP Capital Investments, LLC | 0 | −100,00 | 0 | |||||
| 2025-08-14 | 13F | Boothbay Fund Management, Llc | 228 845 | −12,57 | 8 870 | 26,79 | ||||
| 2025-07-25 | 13F | Mitchell Capital Management Co | 59 389 | 2 285 | ||||||
| 2025-08-13 | 13F | Invesco Ltd. | 121 623 | 102,11 | 4 714 | 193,16 | ||||
| 2025-07-31 | 13F | Caitong International Asset Management Co., Ltd | 145 | 752,94 | 6 | |||||
| 2025-08-11 | 13F | Bell Investment Advisors, Inc | 126 | 250,00 | 5 | |||||
| 2025-08-06 | 13F | Tabor Asset Management, LP | 132 365 | 21,27 | 5 130 | 75,87 | ||||
| 2025-08-08 | 13F | Larson Financial Group LLC | 22 | 1 | ||||||
| 2025-08-01 | 13F | First Command Advisory Services, Inc. | 18 | 0,00 | 1 | |||||
| 2025-08-06 | 13F | True Wealth Design, LLC | 48 | 1 500,00 | 2 | |||||
| 2025-08-11 | 13F | Traub Capital Management LLC | 69 | 3 | ||||||
| 2025-08-12 | 13F | WealthTrak Capital Management LLC | 35 | −12,50 | 1 | 0,00 | ||||
| 2025-08-26 | NP | IWD - iShares Russell 1000 Value ETF | 331 711 | 129,92 | 12 857 | 233,43 | ||||
| 2025-08-14 | 13F | D. E. Shaw & Co., Inc. | 7 602 695 | 96,23 | 294 680 | 184,54 | ||||
| 2025-08-14 | 13F | Divisadero Street Capital Management, LP | 300 000 | 11 628 | ||||||
| 2025-08-14 | 13F | Nebula Research & Development LLC | 29 373 | 1 138 | ||||||
| 2025-07-21 | 13F | Lecap Asset Management Ltd | 0 | −100,00 | 0 | −100,00 | ||||
| 2025-08-12 | 13F | Coldstream Capital Management Inc | 0 | −100,00 | 0 | |||||
| 2025-08-11 | 13F | O'Neil Global Advisors, Inc. | 662 424 | 26 | ||||||
| 2025-08-14 | 13F | Xponance, Inc. | 7 508 | 291 | ||||||
| 2025-08-12 | 13F | Prudential Financial Inc | 113 780 | 546,66 | 4 410 | 838,30 | ||||
| 2025-08-28 | NP | QCSTRX - Stock Account Class R1 | 154 068 | 10,63 | 5 972 | 60,42 | ||||
| 2025-08-14 | 13F | Longaeva Partners L.P. | 540 000 | 20 930 | ||||||
| 2025-08-13 | 13F | Panagora Asset Management Inc | 0 | −100,00 | 0 | |||||
| 2025-07-22 | NP | DSMFX - Destinations Small-Mid Cap Equity Fund Class I | 473 | 0,00 | 17 | 21,43 | ||||
| 2025-05-14 | 13F | OMERS ADMINISTRATION Corp | 0 | −100,00 | 0 | |||||
| 2025-05-15 | 13F | Crestline Management, LP | 0 | −100,00 | 0 | |||||
| 2025-08-14 | 13F | Bnp Paribas Arbitrage, Sa | 2 533 612 | 244,50 | 98 203 | 399,55 | ||||
| 2025-08-14 | 13F/A | Barclays Plc | Call | 300 000 | 12 | |||||
| 2025-08-14 | 13F/A | Barclays Plc | 199 885 | 984,09 | 8 | |||||
| 2025-08-14 | 13F | Raymond James Financial Inc | 6 615 | 256 | ||||||
| 2025-08-12 | 13F | Deutsche Bank Ag\ | 1 438 386 | 23,95 | 55 752 | 79,73 | ||||
| 2025-05-15 | 13F | Polymer Capital Management (HK) LTD | Put | 0 | −100,00 | 0 | −100,00 | |||
| 2025-07-16 | 13F | West Branch Capital LLC | 1 007 | 0,00 | 39 | 50,00 | ||||
| 2025-08-13 | 13F | Scotia Capital Inc. | 50 440 | −0,79 | 1 955 | 43,96 | ||||
| 2025-08-13 | 13F | Twin Peaks Wealth Advisors, LLC | 3 | 0 | ||||||
| 2025-08-15 | 13F | Harvest Fund Management Co., Ltd | 2 818 | −77,01 | 0 | |||||
| 2025-08-11 | 13F | Vanguard Group Inc | 393 062 | 87,16 | 15 235 | 171,42 | ||||
| 2025-07-15 | 13F | Td Private Client Wealth Llc | 56 | −28,21 | 2 | 0,00 | ||||
| 2025-05-15 | 13F | Federation des caisses Desjardins du Quebec | 0 | −100,00 | 0 | |||||
| 2025-08-12 | 13F | Picton Mahoney Asset Management | 20 728 | 1 | ||||||
| 2025-08-18 | 13F | Geneos Wealth Management Inc. | 48 | −4,00 | 2 | 0,00 | ||||
| 2025-08-08 | 13F | Principal Financial Group Inc | 6 227 | 241 | ||||||
| 2025-08-14 | 13F | Quarry LP | 2 128 | 65,35 | 82 | 141,18 | ||||
| 2025-08-14 | 13F | Fosun International Ltd | 15 500 | 601 | ||||||
| 2025-08-08 | 13F/A | Sterling Capital Management LLC | 9 930 | 178,46 | 385 | 304,21 | ||||
| 2025-07-29 | NP | SECAX - SIIT Small Cap II Fund - Class A | 6 909 | −60,72 | 251 | −52,19 | ||||
| 2025-08-14 | 13F | Lighthouse Investment Partners, LLC | 61 002 | 2 364 | ||||||
| 2025-07-21 | 13F | Mirae Asset Global Investments Co., Ltd. | 4 864 | 189 | ||||||
| 2025-08-14 | 13F | KADENSA CAPITAL Ltd | 0 | −100,00 | 0 | |||||
| 2025-08-14 | 13F | Vident Advisory, LLC | 713 740 | 14,02 | 27 665 | 65,35 | ||||
| 2025-08-14 | 13F | Quantinno Capital Management LP | 29 496 | 64,02 | 1 143 | 138,13 | ||||
| 2025-08-13 | 13F | Quadrant Capital Group Llc | 0 | −100,00 | 0 | |||||
| 2025-08-14 | 13F | Viking Global Investors Lp | 3 880 649 | 64,83 | 150 414 | 139,01 | ||||
| 2025-08-06 | 13F | Agf Management Ltd | 176 030 | 141,25 | 6 823 | 249,85 | ||||
| 2025-08-08 | 13F | Creative Planning | 74 782 | 45,68 | 2 899 | 111,22 | ||||
| 2025-06-26 | NP | SMNCX - Steward Equity Market Neutral Fund Class C | Short | −34 000 | −0,00 | −824 | −24,13 | |||
| 2025-08-05 | 13F | Machina Capital S.a.s. | 68 403 | 386,23 | 2 651 | 605,05 | ||||
| 2025-08-13 | 13F | Amundi | 1 099 377 | 1 284,50 | 41 985 | 2 051,97 |
Other Listings
| DE:483 |