Grundläggande statistik
| Chef | Andreas Halvorsen, David Ott |
| Insiderprofil | VIKING GLOBAL INVESTORS LP |
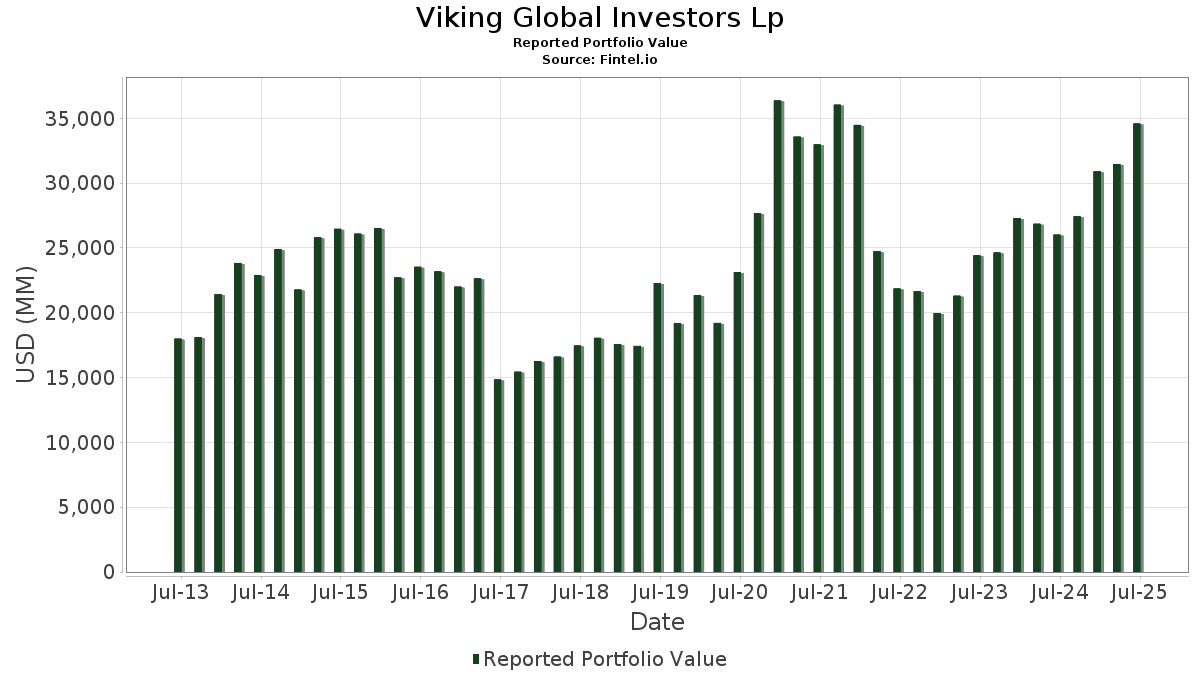
| Portföljvärde | $ 34 589 864 590 |
| Aktuella positioner | 83 |
Senaste innehav, resultat, förvaltat kapital (från 13F, 13D)
Viking Global Investors Lp har redovisat 83 totala innehav i sina senaste SEC-arkiveringar. Portföljförvaltare anges som Andreas Halvorsen, David Ott. Det senaste portföljvärdet beräknas vara $ 34 589 864 590 USD. Faktiskt förvaltade tillgångar (AUM) är detta värde plus likvida medel (som inte redovisas). Viking Global Investors Lps största innehav är Bank of America Corporation (US:BAC) , The Charles Schwab Corporation (US:SCHW) , Capital One Financial Corporation (US:COF) , JPMorgan Chase & Co. (US:JPM) , and U.S. Bancorp (US:USB) . Viking Global Investors Lps nya positioner inkluderar The PNC Financial Services Group, Inc. (US:PNC) , Ralliant Corporation (US:RAL) , Saia, Inc. (US:SAIA) , BlackRock, Inc. (US:BLK) , and The Trade Desk, Inc. (US:TTD) . Viking Global Investors Lps främsta industrier är "Agricultural Services" (sic 07) , "Coal Mining" (sic 12) , and "Food And Kindred Products" (sic 20) .
Största ökningarna detta kvartal
Vi använder förändringen i portföljallokeringen eftersom det är det mest meningsfulla måttet. Förändringar kan bero på transaktioner eller förändringar i aktiekurser.
| Värdepapper | Aktier (MM) |
Värde (MM$) |
Portfölj % av | ΔPortfölj % av |
|---|---|---|---|---|
| 5,85 | 725,22 | 2,0966 | 2,0966 | |
| 2,15 | 607,60 | 1,7566 | 1,7566 | |
| 4,04 | 1 171,83 | 3,3878 | 1,6954 | |
| 3,13 | 913,16 | 2,6400 | 1,4983 | |
| 2,91 | 574,35 | 1,6605 | 1,3664 | |
| 2,38 | 442,87 | 1,2803 | 1,2803 | |
| 2,80 | 618,22 | 1,7873 | 1,2074 | |
| 19,60 | 580,61 | 1,6786 | 1,1122 | |
| 5,42 | 368,21 | 1,0645 | 1,0645 | |
| 0,42 | 325,00 | 0,9396 | 0,9396 |
Största minskningarna detta kvartal
Vi använder förändringen i portföljallokeringen eftersom det är det mest meningsfulla måttet. Förändringar kan bero på transaktioner eller förändringar i aktiepriser.
| Värdepapper | Aktier (MM) |
Värde (MM$) |
Portfölj % av | ΔPortfölj % av |
|---|---|---|---|---|
| 0,27 | 195,96 | 0,5665 | −2,1184 | |
| 24,09 | 1 090,05 | 3,1513 | −1,5250 | |
| 2,60 | 93,59 | 0,2706 | −0,7742 | |
| 11,54 | 588,99 | 1,7028 | −0,7441 | |
| 1,62 | 575,44 | 1,6636 | −0,7025 | |
| 1,08 | 363,23 | 1,0501 | −0,6463 | |
| 15,91 | 829,53 | 2,3982 | −0,6127 | |
| 3,68 | 581,71 | 1,6817 | −0,5712 | |
| 12,29 | 675,50 | 1,9529 | −0,4726 | |
| 34,24 | 385,86 | 1,1155 | −0,3595 |
13D/G-arkiveringar
Detta är en lista över 13D- och 13G-arkiveringar som gjorts under det senaste året (om några). Klicka på länken för att se hela transaktionshistoriken. Gröna rader indikerar nya positioner. Röda rader indikerar stängda positioner.
| Fil Datum | Formulär | Värdepapper | Föregående aktier |
Aktuella aktier |
ΔAktier % | % Ägande |
% ΔÄgande | |
|---|---|---|---|---|---|---|---|---|
| 2025-08-14 | APG / APi Group Corporation | 21 537 518 | 11 537 518 | −46,43 | 2,80 | −64,10 | ||
| 2025-08-14 | RRX / Regal Rexnord Corporation | 3 546 112 | 3 430 128 | −3,27 | 5,20 | −1,89 | ||
| 2025-08-14 | ROIV / Roivant Sciences Ltd. | 46 013 752 | 34 237 779 | −25,59 | 5,02 | −21,56 | ||
| 2025-08-14 | BMRN / BioMarin Pharmaceutical Inc. | 9 753 293 | 12 288 611 | 25,99 | 6,40 | 25,49 | ||
| 2025-08-14 | ORIC / ORIC Pharmaceuticals, Inc. | 6 572 700 | 8 729 345 | 32,81 | 9,99 | 8,59 | ||
| 2025-08-14 | TRVI / Trevi Therapeutics, Inc. | 9 190 486 | 7 505 694 | −18,33 | 5,90 | −32,18 | ||
| 2025-08-14 | BBIO / BridgeBio Pharma, Inc. | 18 602 920 | 18 602 920 | 0,00 | 9,70 | −1,02 | ||
| 2025-07-24 | FTV / Fortive Corporation | 17 049 178 | 5,02 | |||||
| 2025-06-18 | PRMB / Primo Brands Corporation | 19 602 116 | 5,30 | |||||
| 2025-05-15 | / (G0093S109) | 34 360 000 | 28,30 | |||||
| 2025-03-12 | CZOOF / Cazoo Group Ltd | 2 142 728 | 2 142 728 | 0,00 | 43,80 | 0,00 | ||
| 2025-02-14 | NAMS / NewAmsterdam Pharma Company N.V. | 8 024 565 | 6 978 534 | −13,04 | 6,50 | −32,99 | ||
| 2025-02-14 | LBPH / Longboard Pharmaceuticals, Inc. | 1 752 656 | 0 | −100,00 | 0,00 | −100,00 | ||
| 2025-02-14 | SION / Sionna Therapeutics, Inc. | 2 952 754 | 6,70 | |||||
| 2024-11-14 | DNA / Ginkgo Bioworks Holdings, Inc. | 143 085 126 | 3 577 128 | −97,50 | 8,30 | −5,68 | ||
| 2024-11-14 | EWTX / Edgewise Therapeutics, Inc. | 6 159 146 | 1 481 146 | −75,95 | 1,60 | −83,51 | ||
| 2024-11-14 | VKTX / Viking Therapeutics, Inc. | 5 145 112 | 721 926 | −85,97 | 0,60 | −88,24 | ||
| 2024-11-14 | FDMT / 4D Molecular Therapeutics, Inc. | 4 247 914 | 0 | −100,00 | 0,00 | −100,00 | ||
| 2024-11-14 | VSTM / Verastem, Inc. | 2 531 829 | 0 | −100,00 | 0,00 | −100,00 | ||
| 2024-11-14 | PEPG / PepGen Inc. | 1 482 434 | 1 482 434 | 0,00 | 4,50 | −27,42 | ||
| 2024-11-14 | TRML / Tourmaline Bio, Inc. | 0 | 0,00 |
13F- och fond arkiveringar
Denna blankett lämnades in den 2025-08-14 för rapporteringsperioden 2025-06-30. Klicka på länksymbolen för att se hela transaktionshistoriken.
Uppgradera för att låsa upp premiumdata och exportera till Excel![]() .
.
| Värdepapper | Typ | Genomsnittligt aktiepris | Aktier (MM) |
ΔAktier (%) |
ΔAktier (%) |
Värde ($MM) |
Portfölj (%) |
ΔPortfölj (%) |
|
|---|---|---|---|---|---|---|---|---|---|
| BAC / Bank of America Corporation | 31,25 | −2,96 | 1 478,61 | 10,04 | 4,2747 | 0,0058 | |||
| SCHW / The Charles Schwab Corporation | 15,77 | −10,97 | 1 439,15 | 3,77 | 4,1606 | −0,2455 | |||
| COF / Capital One Financial Corporation | 5,67 | 23,53 | 1 206,64 | 46,58 | 3,4884 | 0,8731 | |||
| JPM / JPMorgan Chase & Co. | 4,04 | 86,13 | 1 171,83 | 119,98 | 3,3878 | 1,6954 | |||
| USB / U.S. Bancorp | 24,09 | −30,90 | 1 090,05 | −25,94 | 3,1513 | −1,5250 | |||
| TSM / Taiwan Semiconductor Manufacturing Company Limited - Depositary Receipt (Common Stock) | 4,33 | −11,45 | 980,54 | 20,81 | 2,8348 | 0,2562 | |||
| MCD / McDonald's Corporation | 3,13 | 171,67 | 913,16 | 154,11 | 2,6400 | 1,4983 | |||
| AMZN / Amazon.com, Inc. | 3,90 | 43,19 | 854,98 | 65,11 | 2,4718 | 0,8266 | |||
| FTV / Fortive Corporation | 15,91 | 22,88 | 829,53 | −12,47 | 2,3982 | −0,6127 | |||
| BBIO / BridgeBio Pharma, Inc. | 18,56 | −15,87 | 801,22 | 5,08 | 2,3163 | −0,1060 | |||
| DIS / The Walt Disney Company | 5,85 | 725,22 | 2,0966 | 2,0966 | |||||
| HCA / HCA Healthcare, Inc. | 1,87 | 58,47 | 717,21 | 75,69 | 2,0735 | 0,7766 | |||
| TMUS / T-Mobile US, Inc. | 2,85 | 81,71 | 677,92 | 62,32 | 1,9599 | 0,6330 | |||
| BMRN / BioMarin Pharmaceutical Inc. | 12,29 | 13,78 | 675,50 | −11,52 | 1,9529 | −0,4726 | |||
| SHW / The Sherwin-Williams Company | 1,96 | 101,37 | 672,21 | 98,01 | 1,9434 | 0,8648 | |||
| FLUT / Flutter Entertainment plc | 2,28 | −10,54 | 652,93 | 15,38 | 1,8876 | 0,0898 | |||
| GM / General Motors Company | 13,02 | 81,10 | 640,66 | 89,49 | 1,8522 | 0,7780 | |||
| PM / Philip Morris International Inc. | 3,45 | 7,49 | 629,11 | 23,34 | 1,8188 | 0,1983 | |||
| COR / Cencora, Inc. | 2,08 | 94,95 | 624,21 | 110,21 | 1,8046 | 0,8612 | |||
| AMT / American Tower Corporation | 2,80 | 233,47 | 618,22 | 238,71 | 1,7873 | 1,2074 | |||
| CSX / CSX Corporation | 18,87 | 10,56 | 615,79 | 22,59 | 1,7803 | 0,1843 | |||
| APD / Air Products and Chemicals, Inc. | 2,15 | 607,60 | 1,7566 | 1,7566 | |||||
| ROST / Ross Stores, Inc. | 4,75 | 9,87 | 605,70 | 9,69 | 1,7511 | −0,0033 | |||
| BA / The Boeing Company | 2,84 | −12,26 | 594,03 | 7,79 | 1,7174 | −0,0335 | |||
| APG / APi Group Corporation | 11,54 | −46,43 | 588,99 | −23,53 | 1,7028 | −0,7441 | |||
| NVDA / NVIDIA Corporation | 3,68 | −43,73 | 581,71 | −17,97 | 1,6817 | −0,5712 | |||
| PRMB / Primo Brands Corporation | 19,60 | 290,21 | 580,61 | 225,67 | 1,6786 | 1,1122 | |||
| V / Visa Inc. | 1,62 | −23,73 | 575,44 | −22,74 | 1,6636 | −0,7025 | |||
| DHR / Danaher Corporation | 2,91 | 543,94 | 574,35 | 520,51 | 1,6605 | 1,3664 | |||
| SE / Sea Limited - Depositary Receipt (Common Stock) | 3,54 | −14,98 | 565,71 | 4,21 | 1,6355 | −0,0892 | |||
| QCOM / QUALCOMM Incorporated | 3,15 | 120,12 | 502,13 | 128,22 | 1,4517 | 0,7526 | |||
| RRX / Regal Rexnord Corporation | 3,43 | 25,69 | 497,23 | 60,04 | 1,4375 | 0,4504 | |||
| NKE / NIKE, Inc. | 6,97 | 25,61 | 494,95 | 40,57 | 1,4309 | 0,3123 | |||
| PNC / The PNC Financial Services Group, Inc. | 2,38 | 442,87 | 1,2803 | 1,2803 | |||||
| ROIV / Roivant Sciences Ltd. | 34,24 | −25,59 | 385,86 | −16,89 | 1,1155 | −0,3595 | |||
| TIC / Acuren Corporation | 34,36 | 0,00 | 379,33 | −0,72 | 1,0967 | −0,1172 | |||
| FSLR / First Solar, Inc. | 2,27 | 60,58 | 375,12 | 110,26 | 1,0845 | 0,5177 | |||
| CCL / Carnival Corporation & plc | 13,21 | 6,43 | 371,39 | 53,25 | 1,0737 | 0,3038 | |||
| XYZ / Block, Inc. | 5,42 | 368,21 | 1,0645 | 1,0645 | |||||
| DHI / D.R. Horton, Inc. | 2,83 | 108,32 | 364,46 | 111,25 | 1,0537 | 0,5056 | |||
| CVNA / Carvana Co. | 1,08 | −57,79 | 363,23 | −31,97 | 1,0501 | −0,6463 | |||
| RACE / Ferrari N.V. | 0,72 | 432,71 | 353,53 | 515,70 | 1,0221 | 0,8396 | |||
| TSLA / Tesla, Inc. | 1,10 | 214,30 | 349,53 | 285,26 | 1,0105 | 0,7223 | |||
| ADPT / Adaptive Biotechnologies Corporation | 29,99 | 0,00 | 349,43 | 56,80 | 1,0102 | 0,3022 | |||
| BSX / Boston Scientific Corporation | 3,05 | 28,15 | 327,15 | 36,44 | 0,9458 | 0,1840 | |||
| LLY / Eli Lilly and Company | 0,42 | 325,00 | 0,9396 | 0,9396 | |||||
| CMG / Chipotle Mexican Grill, Inc. | 5,69 | −5,30 | 319,41 | 5,91 | 0,9234 | −0,0347 | |||
| CPT / Camden Property Trust | 2,72 | −2,61 | 306,07 | −10,26 | 0,8849 | −0,1987 | |||
| LEN / Lennar Corporation | 2,52 | 86,72 | 279,13 | 79,94 | 0,8070 | 0,3141 | |||
| AMD / Advanced Micro Devices, Inc. | 1,91 | 271,11 | 0,7838 | 0,7838 | |||||
| CSGP / CoStar Group, Inc. | 3,22 | 258,77 | 0,7481 | 0,7481 | |||||
| RAL / Ralliant Corporation | 5,30 | 257,20 | 0,7436 | 0,7436 | |||||
| AJG / Arthur J. Gallagher & Co. | 0,73 | 8,89 | 232,34 | 0,97 | 0,6717 | −0,0594 | |||
| SAIA / Saia, Inc. | 0,83 | 226,77 | 0,6556 | 0,6556 | |||||
| BLK / BlackRock, Inc. | 0,20 | 204,71 | 0,5918 | 0,5918 | |||||
| META / Meta Platforms, Inc. | 0,27 | −81,89 | 195,96 | −76,81 | 0,5665 | −2,1184 | |||
| TEVA / Teva Pharmaceutical Industries Limited - Depositary Receipt (Common Stock) | 11,68 | 15,37 | 195,78 | 25,80 | 0,5660 | 0,0716 | |||
| TTD / The Trade Desk, Inc. | 2,67 | 192,52 | 0,5566 | 0,5566 | |||||
| CART / Maplebear Inc. | 3,75 | 169,78 | 0,4908 | 0,4908 | |||||
| CME / CME Group Inc. | 0,60 | 164,65 | 0,4760 | 0,4760 | |||||
| ITGR / Integer Holdings Corporation | 1,28 | 9,06 | 157,89 | 13,65 | 0,4565 | 0,0151 | |||
| AIG / American International Group, Inc. | 1,82 | 155,41 | 0,4493 | 0,4493 | |||||
| JCI / Johnson Controls International plc | 1,45 | 153,23 | 0,4430 | 0,4430 | |||||
| AS / Amer Sports, Inc. | 3,88 | 64,83 | 150,41 | 139,01 | 0,4348 | 0,2349 | |||
| APP / AppLovin Corporation | 0,37 | 172,06 | 130,57 | 259,45 | 0,3775 | 0,2621 | |||
| MASI / Masimo Corporation | 0,77 | 129,10 | 0,3732 | 0,3732 | |||||
| NAMS / NewAmsterdam Pharma Company N.V. | 6,98 | 0,00 | 126,38 | −11,53 | 0,3654 | −0,0885 | |||
| RYAN / Ryan Specialty Holdings, Inc. | 1,41 | 47,80 | 96,05 | 36,03 | 0,2777 | 0,0534 | |||
| RPRX / Royalty Pharma plc | 2,60 | −75,41 | 93,59 | −71,54 | 0,2706 | −0,7742 | |||
| UBS / UBS Group AG | 2,58 | 87,32 | 0,2524 | 0,2524 | |||||
| MOH / Molina Healthcare, Inc. | 0,27 | 79,66 | 0,2303 | 0,2303 | |||||
| LAB / Standard BioTools Inc. | 58,65 | 0,00 | 70,38 | 11,11 | 0,2035 | 0,0022 | |||
| ORIC / ORIC Pharmaceuticals, Inc. | 6,57 | 0,00 | 66,71 | 81,90 | 0,1929 | 0,0763 | |||
| PHVS / Pharvaris N.V. | 3,65 | 0,00 | 64,30 | 12,10 | 0,1859 | 0,0037 | |||
| SION / Sionna Therapeutics, Inc. | 3,20 | 8,21 | 55,44 | 79,49 | 0,1603 | 0,0621 | |||
| MTSR / Metsera, Inc. | 1,62 | 0,00 | 45,99 | 4,52 | 0,1330 | −0,0068 | |||
| DNA / Ginkgo Bioworks Holdings, Inc. | 3,58 | 0,00 | 40,24 | 97,37 | 0,1163 | 0,0516 | |||
| INBX / Inhibrx Biosciences, Inc. | 1,79 | 0,00 | 25,51 | 2,00 | 0,0738 | −0,0057 | |||
| HQY / HealthEquity, Inc. | 0,22 | 23,02 | 0,0666 | 0,0666 | |||||
| ESTA / Establishment Labs Holdings Inc. | 0,34 | 14,67 | 0,0424 | 0,0424 | |||||
| TRVI / Trevi Therapeutics, Inc. | 1,54 | −52,20 | 8,44 | −58,43 | 0,0244 | −0,0401 | |||
| PEPG / PepGen Inc. | 1,48 | 0,00 | 1,65 | −20,99 | 0,0048 | −0,0019 | |||
| RLYB / Rallybio Corporation | 4,19 | 0,00 | 1,42 | −48,38 | 0,0041 | −0,0046 | |||
| NFLX / Netflix, Inc. | 0,00 | −100,00 | 0,00 | 0,0000 | |||||
| SNPS / Synopsys, Inc. | 0,00 | −100,00 | 0,00 | 0,0000 | |||||
| ICE / Intercontinental Exchange, Inc. | 0,00 | −100,00 | 0,00 | 0,0000 | |||||
| SPOT / Spotify Technology S.A. | 0,00 | −100,00 | 0,00 | 0,0000 | |||||
| SAIL / SailPoint, Inc. | 0,00 | −100,00 | 0,00 | 0,0000 | |||||
| DB / Deutsche Bank Aktiengesellschaft | 0,00 | −100,00 | 0,00 | 0,0000 | |||||
| EQH / Equitable Holdings, Inc. | 0,00 | −100,00 | 0,00 | 0,0000 | |||||
| IMVT / Immunovant, Inc. | 0,00 | −100,00 | 0,00 | 0,0000 | |||||
| MAA / Mid-America Apartment Communities, Inc. | 0,00 | −100,00 | 0,00 | 0,0000 | |||||
| MTB / M&T Bank Corporation | 0,00 | −100,00 | 0,00 | 0,0000 | |||||
| ADSK / Autodesk, Inc. | 0,00 | −100,00 | 0,00 | 0,0000 | |||||
| MNST / Monster Beverage Corporation | 0,00 | −100,00 | 0,00 | 0,0000 | |||||
| DASH / DoorDash, Inc. | 0,00 | −100,00 | 0,00 | 0,0000 | |||||
| MET / MetLife, Inc. | 0,00 | −100,00 | 0,00 | 0,0000 | |||||
| EWTX / Edgewise Therapeutics, Inc. | 0,00 | −100,00 | 0,00 | 0,0000 | |||||
| INTU / Intuit Inc. | 0,00 | −100,00 | 0,00 | 0,0000 | |||||
| TWLO / Twilio Inc. | 0,00 | −100,00 | 0,00 | 0,0000 | |||||
| BNTX / BioNTech SE - Depositary Receipt (Common Stock) | 0,00 | −100,00 | 0,00 | 0,0000 | |||||
| TVTX / Travere Therapeutics, Inc. | 0,00 | −100,00 | 0,00 | −100,00 | −0,1481 | ||||
| ALL / The Allstate Corporation | 0,00 | −100,00 | 0,00 | 0,0000 | |||||
| PGR / The Progressive Corporation | 0,00 | −100,00 | 0,00 | 0,0000 | |||||
| SKX / Skechers U.S.A., Inc. | 0,00 | −100,00 | 0,00 | 0,0000 | |||||
| LI / Li Auto Inc. - Depositary Receipt (Common Stock) | 0,00 | −100,00 | 0,00 | −100,00 | −0,0077 | ||||
| TRU / TransUnion | 0,00 | −100,00 | 0,00 | 0,0000 | |||||
| REGN / Regeneron Pharmaceuticals, Inc. | 0,00 | −100,00 | 0,00 | 0,0000 | |||||
| UNH / UnitedHealth Group Incorporated | 0,00 | −100,00 | 0,00 | 0,0000 | |||||
| CB / Chubb Limited | 0,00 | −100,00 | 0,00 | 0,0000 | |||||
| MSFT / Microsoft Corporation | 0,00 | −100,00 | 0,00 | 0,0000 |