Grundläggande statistik
| Institutionella ägare | 154 total, 154 long only, 0 short only, 0 long/short - change of 35,09% MRQ |
| Genomsnittlig portföljallokering | 0.4828 % - change of 44,17% MRQ |
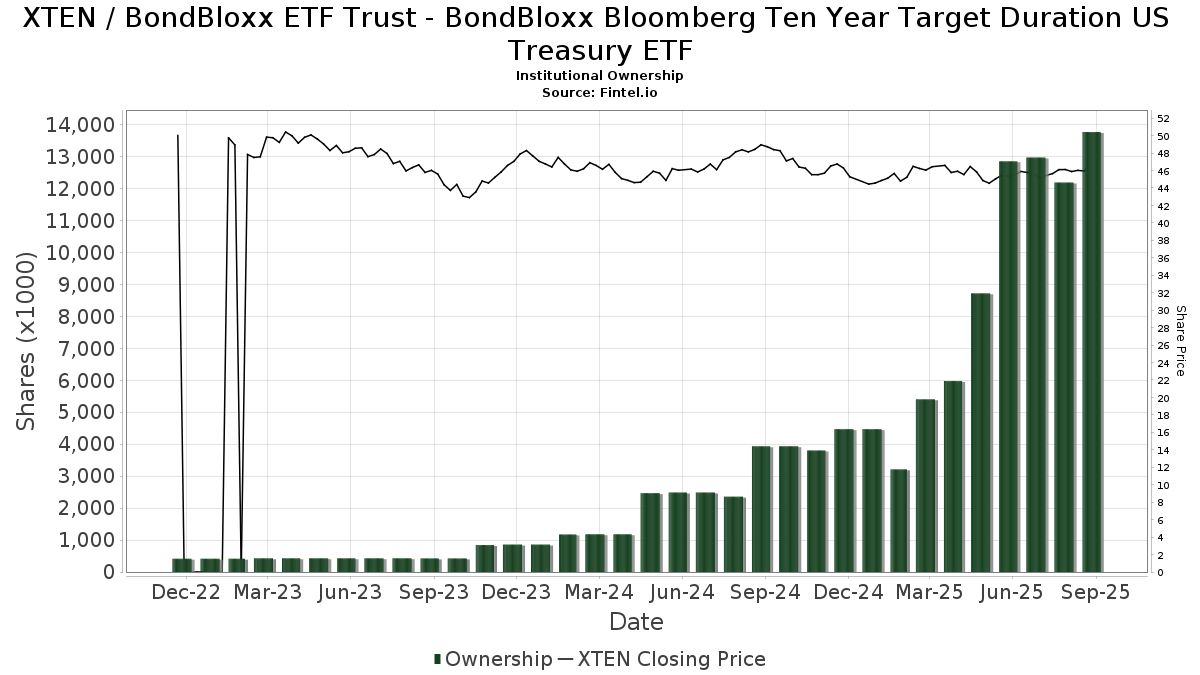
| Institutionella aktier (lång) | 13 768 103 (ex 13D/G) - change of 0,92MM shares 7,13% MRQ |
| Institutionellt värde (lång) | $ 605 360 USD ($1000) |
Institutionellt ägande och aktieägare
BondBloxx ETF Trust - BondBloxx Bloomberg Ten Year Target Duration US Treasury ETF (US:XTEN) har 154 Institutionella ägare och aktieägare som har lämnat in 13D/G- eller 13F-formulär till Securities Exchange Commission (SEC). Dessa institut innehar totalt 13,768,103 aktier. Största aktieägare inkluderar Resources Investment Advisors, LLC., Prime Capital Investment Advisors, LLC, Jpmorgan Chase & Co, Bank Of America Corp /de/, Envestnet Asset Management Inc, Austin Private Wealth, LLC, MSTRX - Morningstar Total Return Bond Fund, GWM Advisors LLC, Gradient Investments LLC, and Municipal Employees' Retirement System of Michigan .
BondBloxx ETF Trust - BondBloxx Bloomberg Ten Year Target Duration US Treasury ETF (ARCA:XTEN) Institutionell ägarstruktur visar institutioners och fonders nuvarande positioner i företaget, samt de senaste förändringarna i positionernas storlek. Större aktieägare kan vara enskilda investerare, fonder, hedgefonder eller institutioner. Bilaga 13D visar att investeraren äger (eller ägde) mer än 5% av företaget och avser (eller avsåg) att aktivt eftersträva en förändring av affärsstrategin. Schedule 13G indikerar en passiv investering på över 5%.
The share price as of September 12, 2025 is 46,88 / share. Previously, on September 13, 2024, the share price was 48,96 / share. This represents a decline of 4,24% over that period.
Fondsentimentets poäng
Fondsentimentet poängen(fka Ägarackumulation-poäng) visar vilka aktier som är mest köpta av fonder. Det är resultatet av en sofistikerad kvantitativ flerfaktormodell som identifierar företag med de högsta nivåerna av institutionell ackumulering. Poängsättningsmodellen använder en kombination av den totala ökningen av redovisade ägare, förändringarna i portföljallokeringarna för dessa ägare och andra mått. Siffran sträcker sig från 0 till 100, där högre siffror indikerar en högre nivå av ackumulering i förhållande till sina konkurrenter, och 50 är genomsnittet.
Uppdateringsfrekvens: Dagligen
Se Ownership Explorer, som innehåller en lista över de högst rankade företagen.
Institutionell sälj/köp-kvot
Förutom att rapportera vanliga eget kapital- och skuldemissioner måste institutioner med mer än 100MM tillgångar under förvaltning också avslöja sina innehav av sälj- och köpoptioner. Eftersom säljoptioner i allmänhet indikerar ett negativt sentiment och köpoptioner indikerar ett positivt sentiment, kan vi få en uppfattning om det övergripande institutionella sentimentet genom att plotta förhållandet mellan säljoptioner och köpoptioner. Diagrammet till höger visar det historiska förhållandet mellan sälj- och köpoptioner för detta instrument.
Genom att använda sälj/köp-kvoten som en indikator på aktieägarnas sentiment undviker man en av de största bristerna med att använda det totala institutionella ägandet, nämligen att en betydande del av de förvaltade tillgångarna investeras passivt för att följa index. Passivt förvaltade fonder köper vanligtvis inte optioner, så indikatorn för sälj/köp-kvoten ger en bättre bild av stämningen i aktivt förvaltade fonder.
13F- och NPORT-arkiveringar
Detaljer om 13F-arkiveringar är gratis. Detaljer om NP-arkiveringar kräver ett premiummedlemskap. Gröna rader indikerar nya positioner. Röda rader indikerar stängda positioner. Klicka på länk symbolen för att se hela transaktionshistoriken.
Uppgradera
för att låsa upp premiumdata och exportera till Excel ![]() .
.
| Fil Datum | Källa | Investerare | Typ | Genomsnittligt pris (beräknat) |
Aktier | Δ Aktier (%) |
Rapporterat värde (1000 USD) |
Δ Värde (%) |
Portföljallokering (%) |
|
|---|---|---|---|---|---|---|---|---|---|---|
| 2025-07-23 | 13F | Heck Capital Advisors, LLC | 178 049 | 5,19 | 8 219 | 4,25 | ||||
| 2025-08-08 | 13F | Cetera Investment Advisers | 97 591 | 21,93 | 4 505 | 20,85 | ||||
| 2025-07-30 | NP | AGGA - Astoria Dynamic Core US Fixed Income ETF | 96 702 | 4 391 | ||||||
| 2025-08-01 | 13F | Brookwood Investment Group LLC | 14 779 | 31,53 | 682 | 30,40 | ||||
| 2025-04-16 | 13F | New Century Financial Group, LLC | 0 | −100,00 | 0 | −100,00 | ||||
| 2025-07-10 | 13F | Focus Financial Network, Inc. | 111 758 | 114,31 | 5 159 | 112,44 | ||||
| 2025-08-11 | 13F | CFS Investment Advisory Services, LLC | 90 083 | 140,57 | 4 | 300,00 | ||||
| 2025-08-13 | 13F | Elios Financial Group Inc. | 27 362 | 1 263 | ||||||
| 2025-08-11 | 13F | Pineridge Advisors LLC | 5 490 | 253 | ||||||
| 2025-08-12 | 13F | SRS Capital Advisors, Inc. | 284 | 13 | ||||||
| 2025-08-04 | 13F | Spire Wealth Management | 1 895 | 99,89 | 87 | 97,73 | ||||
| 2025-08-05 | 13F | Fullcircle Wealth Llc | 23 801 | 92,16 | 1 099 | 91,80 | ||||
| 2025-08-07 | 13F | PFG Advisors | 105 666 | 99,81 | 4 878 | 98,09 | ||||
| 2025-08-13 | 13F | Vertex Planning Partners, LLC | 33 012 | 125,80 | 1 524 | 123,97 | ||||
| 2025-08-11 | 13F | Cornerstone Planning Group LLC | 25 | 316,67 | 1 | |||||
| 2025-08-14 | 13F | Smartleaf Asset Management LLC | 22 202 | 1 944,38 | 1 019 | 1 936,00 | ||||
| 2025-08-04 | 13F | Merkkuri Wealth Advisors LLC | 24 472 | 186,36 | 1 130 | 184,38 | ||||
| 2025-08-13 | 13F | M Holdings Securities, Inc. | 13 901 | 1 | ||||||
| 2025-07-29 | 13F | Horst & Graben Wealth Management LLC | 385 027 | 96,95 | 17 773 | 95,21 | ||||
| 2025-07-23 | 13F | WESPAC Advisors, LLC | 4 636 | 214 | ||||||
| 2025-07-30 | 13F | Caliber Wealth Management, LLC / KS | 7 835 | 362 | ||||||
| 2025-07-11 | 13F | Farther Finance Advisors, LLC | 2 275 | 34,93 | 105 | 34,62 | ||||
| 2025-08-06 | 13F | AE Wealth Management LLC | 265 723 | 126,01 | 12 266 | 124,02 | ||||
| 2025-08-08 | 13F | Gts Securities Llc | 9 401 | 434 | ||||||
| 2025-08-14 | 13F | Ausdal Financial Partners, Inc. | 6 828 | 315 | ||||||
| 2025-08-13 | 13F | Transce3nd, LLC | 1 503 | 38,91 | 69 | 38,00 | ||||
| 2025-05-12 | 13F | C2P Capital Advisory Group, LLC d.b.a. Prosperity Capital Advisors | 0 | −100,00 | 0 | −100,00 | ||||
| 2025-07-22 | 13F | Firethorn Wealth Partners, Llc | 23 236 | 105,28 | 1 073 | 103,42 | ||||
| 2025-08-14 | 13F | Comerica Bank | 103 429 | −86,32 | 4 774 | −86,45 | ||||
| 2025-08-14 | 13F | Jane Street Group, Llc | 107 764 | 322,32 | 4 974 | 318,69 | ||||
| 2025-07-10 | 13F | Oliver Lagore Vanvalin Investment Group | 47 | 2 | ||||||
| 2025-08-14 | 13F | Arete Wealth Advisors, LLC | 6 816 | 0 | ||||||
| 2025-08-13 | 13F | Twin Peaks Wealth Advisors, LLC | 467 | 21 | ||||||
| 2025-08-14 | 13F | Mariner, LLC | 5 829 | 269 | ||||||
| 2025-08-12 | 13F | Investor's Fiduciary Advisor Network, LLC | 21 713 | 1 | ||||||
| 2025-07-30 | 13F | Eqis Capital Management, Inc. | 0 | −100,00 | 0 | |||||
| 2025-09-04 | 13F/A | Advisor Group Holdings, Inc. | 7 141 | 90,17 | 330 | 89,08 | ||||
| 2025-07-15 | 13F | Spectrum Planning & Advisory Services Inc. | 13 156 | −25,85 | 607 | −26,51 | ||||
| 2025-07-07 | 13F | OMNI 360 Wealth, Inc. | 11 136 | 514 | ||||||
| 2025-08-14 | 13F | Redwood Investment Management, Llc | 53 746 | 2 | ||||||
| 2025-08-06 | 13F | Golden State Wealth Management, LLC | 84 | 4 | ||||||
| 2025-08-13 | 13F | Maia Wealth LLC | 60 518 | 115,82 | 2 793 | 118,89 | ||||
| 2025-08-11 | 13F | Empowered Funds, LLC | 53 253 | 2 450 | ||||||
| 2025-07-14 | 13F | Legacy Capital Group California, Inc. | 8 638 | 10,35 | 399 | 9,34 | ||||
| 2025-08-14 | 13F | Citadel Advisors Llc | 9 890 | −40,37 | 457 | −40,93 | ||||
| 2025-07-01 | 13F | Bush Investment Group, Llc | 39 682 | 107,92 | 1 832 | 106,19 | ||||
| 2025-07-23 | 13F | Clear Creek Financial Management, LLC | 10 017 | −34,35 | 462 | −34,93 | ||||
| 2025-08-14 | 13F | Gen-Wealth Partners Inc | 32 852 | 93,45 | 1 516 | 91,90 | ||||
| 2025-07-08 | 13F | Nbc Securities, Inc. | 58 | 0 | ||||||
| 2025-07-10 | 13F | Wealth Enhancement Advisory Services, Llc | 18 512 | 4,10 | 844 | 1,93 | ||||
| 2025-08-01 | 13F | Transcend Wealth Collective, Llc | 10 993 | 41,08 | 507 | 40,06 | ||||
| 2025-08-12 | 13F | BlackRock, Inc. | 6 427 | 14,08 | 297 | 12,98 | ||||
| 2025-08-13 | 13F | GeoWealth Management, LLC | 293 | 3 562,50 | 14 | |||||
| 2025-08-06 | 13F | Tradewinds, LLC. | 24 472 | 1 130 | ||||||
| 2025-07-17 | 13F | Tempus Wealth Planning, LLC | 30 251 | 140,72 | 1 396 | 138,63 | ||||
| 2025-08-01 | 13F | Envestnet Asset Management Inc | 733 740 | 48,29 | 33 869 | 46,98 | ||||
| 2025-08-14 | 13F | Royal Bank Of Canada | 3 273 | 197,28 | 151 | 196,08 | ||||
| 2025-07-29 | 13F | Clearview Wealth Advisors LLC | 40 944 | 107,02 | 1 890 | 105,10 | ||||
| 2025-08-01 | 13F | Ashton Thomas Private Wealth, LLC | 66 554 | 180,61 | 3 072 | 178,26 | ||||
| 2025-07-10 | 13F | Signal Advisors Wealth, LLC | 15 983 | 738 | ||||||
| 2025-08-04 | 13F | Municipal Employees' Retirement System of Michigan | 403 452 | 0,00 | 19 | 0,00 | ||||
| 2025-08-05 | 13F | Scarborough Advisors, LLC | 222 | 10 | ||||||
| 2025-08-18 | 13F | Geneos Wealth Management Inc. | 5 760 | 42,89 | 266 | 41,71 | ||||
| 2025-07-25 | 13F | Northwest Capital Management Inc | 31 637 | −15,81 | 1 460 | −16,57 | ||||
| 2025-07-28 | 13F | WealthPlan Investment Management, LLC | 44 893 | 2 072 | ||||||
| 2025-08-12 | 13F | Global Retirement Partners, LLC | 17 551 | 810 | ||||||
| 2025-07-30 | 13F | WESPAC Advisors SoCal, LLC | 180 202 | 199,59 | 8 318 | 196,97 | ||||
| 2025-08-04 | 13F | Creative Financial Designs Inc /adv | 18 482 | 105,31 | 853 | 103,58 | ||||
| 2025-06-30 | NP | ASTIX - Astor Dynamic Allocation Fund Class I shares | 98 409 | 4 571 | ||||||
| 2025-07-21 | 13F | Catalina Capital Group, LLC | 16 664 | 122,66 | 769 | 120,98 | ||||
| 2025-08-12 | 13F | LPL Financial LLC | 46 950 | 49,78 | 2 167 | 48,53 | ||||
| 2025-07-22 | 13F | Beacon Financial Advisory LLC | 19 956 | 137,18 | 921 | 135,55 | ||||
| 2025-06-26 | NP | MSTRX - Morningstar Total Return Bond Fund | 572 996 | 0,00 | 26 616 | 2,95 | ||||
| 2025-07-24 | 13F | MSH Capital Advisors LLC | 16 080 | 742 | ||||||
| 2025-07-18 | 13F | Cooper Financial Group | 0 | −100,00 | 0 | |||||
| 2025-07-25 | 13F | We Are One Seven, LLC | 15 867 | 43,70 | 732 | 42,41 | ||||
| 2025-08-12 | 13F | Jpmorgan Chase & Co | 1 345 190 | 86,94 | 62 094 | 85,30 | ||||
| 2025-07-11 | 13F | My Legacy Advisors, LLC | 60 744 | 121,48 | 2 770 | 116,84 | ||||
| 2025-07-07 | 13F | RDA Financial Network | 29 723 | 111,46 | 1 372 | 109,79 | ||||
| 2025-08-05 | 13F | Hutchens & Kramer Investment Management Group, LLC | 0 | −100,00 | 0 | |||||
| 2025-07-23 | 13F | Nbt Bank N A /ny | 88 | 4 | ||||||
| 2025-07-09 | 13F | Beacon Financial Group | 4 991 | 230 | ||||||
| 2025-08-14 | 13F | CoreCap Advisors, LLC | 659 | 309,32 | 30 | 328,57 | ||||
| 2025-07-21 | 13F | Ameritas Advisory Services, LLC | 197 | 9 | ||||||
| 2025-08-01 | 13F | Austin Private Wealth, LLC | 577 059 | 109,52 | 26 637 | 107,68 | ||||
| 2025-08-13 | 13F | Hobbs Wealth Management, LLC | 26 434 | 104,12 | 1 220 | 102,32 | ||||
| 2025-07-21 | 13F | Patriot Financial Group Insurance Agency, LLC | 34 727 | 78,66 | 1 603 | 77,02 | ||||
| 2025-07-08 | 13F | Ehrlich Financial Group | 77 348 | 213,78 | 3 570 | 211,25 | ||||
| 2025-08-12 | 13F | Tradition Wealth Management, LLC | 94 644 | 121,44 | 4 369 | 119,50 | ||||
| 2025-08-15 | 13F | Kestra Advisory Services, LLC | 24 483 | 130,60 | 1 130 | 128,74 | ||||
| 2025-07-08 | 13F | Range Financial Group LLC | 26 794 | 60,60 | 1 237 | 59,28 | ||||
| 2025-07-18 | 13F | B.O.S.S. Retirement Advisors, LLC | 4 891 | 226 | ||||||
| 2025-07-10 | 13F | Sovran Advisors, LLC | 10 891 | 106,78 | 493 | 105,42 | ||||
| 2025-08-07 | 13F | Resources Investment Advisors, LLC. | 1 738 891 | 22,59 | 80 267 | 21,51 | ||||
| 2025-07-14 | 13F | Sowell Financial Services LLC | 9 798 | 452 | ||||||
| 2025-07-08 | 13F | Paladin Wealth, LLC | 15 292 | 15,39 | 706 | 14,26 | ||||
| 2025-08-14 | 13F | IHT Wealth Management, LLC | 13 621 | 629 | ||||||
| 2025-08-07 | 13F | Allworth Financial LP | 391 | 18 | ||||||
| 2025-08-12 | 13F | PSI Advisors, LLC | 0 | −100,00 | 0 | |||||
| 2025-08-13 | 13F | Argyle Capital Partners, LLC | 6 714 | 2,68 | 310 | 1,64 | ||||
| 2025-08-14 | 13F | Pinnacle Family Advisors, LLC | 10 817 | 101,40 | 499 | 99,60 | ||||
| 2025-08-07 | 13F | Verus Capital Partners, Llc | 26 723 | 1 234 | ||||||
| 2025-07-28 | 13F | WealthPLAN Partners, LLC | 49 455 | 114,34 | 2 283 | 112,48 | ||||
| 2025-08-06 | 13F | First Horizon Advisors, Inc. | 0 | −100,00 | 0 | |||||
| 2025-05-01 | 13F | Quest 10 Wealth Builders, Inc. | 294 | 14 | ||||||
| 2025-08-07 | 13F | Apeiron RIA LLC | 85 209 | 254,92 | 3 933 | 251,79 | ||||
| 2025-08-14 | 13F | Goldman Sachs Group Inc | 0 | −100,00 | 0 | |||||
| 2025-07-31 | 13F | Cambridge Investment Research Advisors, Inc. | 6 438 | 0 | ||||||
| 2025-07-09 | 13F | Lifelong Wealth Advisors, Inc. | 49 264 | 134,20 | 2 274 | 132,28 | ||||
| 2025-08-04 | 13F | Family Wealth Group, LLC | 4 444 | 205 | ||||||
| 2025-08-12 | 13F | WealthTrak Capital Management LLC | 17 289 | 159,36 | 798 | 157,42 | ||||
| 2025-08-14 | 13F | Fmr Llc | 139 | 0,72 | 6 | 0,00 | ||||
| 2025-08-12 | 13F | Maripau Wealth Management Llc | 14 656 | 677 | ||||||
| 2025-05-20 | 13F | Belpointe Asset Management LLC | 0 | −100,00 | 0 | |||||
| 2025-07-18 | 13F | Astor Investment Management LLC | 72 | 3 | ||||||
| 2025-08-12 | 13F | Proequities, Inc. | 0 | 0 | ||||||
| 2025-08-14 | 13F | Bank Of America Corp /de/ | 928 641 | 47,94 | 42 866 | 46,64 | ||||
| 2025-07-08 | 13F | Gradient Investments LLC | 434 151 | 6,29 | 20 040 | 5,35 | ||||
| 2025-07-22 | 13F | Ffg Retirement Advisors Llc | 150 211 | 23,78 | 6 934 | 22,69 | ||||
| 2025-07-30 | 13F | Syntegra Private Wealth Group, LLC | 20 934 | 966 | ||||||
| 2025-07-30 | 13F | LGT Financial Advisors LLC | 218 | 113,73 | 10 | 150,00 | ||||
| 2025-08-11 | 13F | Resurgent Financial Advisors LLC | 13 391 | 109,76 | 618 | 108,08 | ||||
| 2025-08-13 | 13F | EverSource Wealth Advisors, LLC | 763 | 44,78 | 35 | 45,83 | ||||
| 2025-08-11 | 13F | Theory Financial Llc | 80 538 | 116,59 | 3 681 | 112,59 | ||||
| 2025-07-28 | 13F | Morningstar Investment Management LLC | 0 | −100,00 | 0 | |||||
| 2025-07-22 | 13F | Duncan Williams Asset Management, LLC | 15 936 | 736 | ||||||
| 2025-08-04 | 13F | Integrity Alliance, Llc. | 0 | −100,00 | 0 | |||||
| 2025-07-29 | 13F | Mattson Financial Services, LLC | 49 706 | 6,53 | 2 294 | 5,62 | ||||
| 2025-05-02 | 13F | Capital A Wealth Management, LLC | 145 | 7 | ||||||
| 2025-05-13 | 13F | UBS Group AG | 0 | −100,00 | 0 | |||||
| 2025-08-11 | 13F | Wealthgarden F.s. Llc | 6 739 | 308 | ||||||
| 2025-08-05 | 13F | Plante Moran Financial Advisors, LLC | 0 | −100,00 | 0 | |||||
| 2025-07-17 | 13F | Western Financial Corp/CA | 10 335 | 67,10 | 477 | 65,63 | ||||
| 2025-08-12 | 13F | Nemes Rush Group LLC | 11 841 | 33,30 | 547 | 32,20 | ||||
| 2025-08-14 | 13F | Susquehanna International Group, Llp | 35 001 | −32,89 | 1 616 | −33,48 | ||||
| 2025-07-28 | 13F | Harbour Investments, Inc. | 32 624 | 111,30 | 1 506 | 109,32 | ||||
| 2025-07-28 | 13F | Cypress Wealth Services, LLC | 38 462 | 23,94 | 1 775 | 22,84 | ||||
| 2025-07-14 | 13F | U.S. Capital Wealth Advisors, LLC | 4 394 | 203 | ||||||
| 2025-07-22 | 13F | Kickstand Ventures, Llc. | 15 936 | −3,90 | 736 | −4,79 | ||||
| 2025-07-30 | 13F | Strategic Blueprint, LLC | 27 592 | 100,48 | 1 274 | 98,91 | ||||
| 2025-08-15 | 13F | Morgan Stanley | 27 | 1 | ||||||
| 2025-05-15 | 13F | Two Sigma Securities, Llc | 0 | −100,00 | 0 | −100,00 | ||||
| 2025-07-24 | 13F | M1 Capital Management LLC | 57 786 | 123,82 | 2 667 | 121,88 | ||||
| 2025-07-17 | 13F | LexAurum Advisors, LLC | 9 418 | 28,70 | 435 | 27,65 | ||||
| 2025-08-25 | 13F | Fulcrum Equity Management | 12 082 | 116,68 | 558 | 115,06 | ||||
| 2025-08-11 | 13F | HighTower Advisors, LLC | 23 940 | −2,79 | 1 105 | −3,58 | ||||
| 2025-07-29 | 13F | Empirical Asset Management, LLC | 12 998 | 600 | ||||||
| 2025-08-11 | 13F | Private Advisor Group, LLC | 14 156 | 82,28 | 653 | 80,89 | ||||
| 2025-07-31 | 13F | MN Wealth Advisors, LLC | 6 115 | 282 | ||||||
| 2025-08-14 | 13F | GWM Advisors LLC | 448 021 | 27,67 | 20 681 | 26,55 | ||||
| 2025-05-14 | 13F | Flow Traders U.s. Llc | 0 | −100,00 | 0 | |||||
| 2025-07-30 | 13F | Avidian Wealth Solutions, LLC | 32 771 | 113,42 | 1 513 | 111,47 | ||||
| 2025-08-15 | 13F | Semmax Financial Advisors Inc. | 19 333 | 120,65 | 888 | 122,86 | ||||
| 2025-07-18 | 13F | Tanager Wealth Management LLP | 48 290 | −50,82 | 2 229 | −51,25 | ||||
| 2025-07-23 | 13F | Prime Capital Investment Advisors, LLC | 1 373 413 | −60,30 | 63 397 | −60,65 | ||||
| 2025-07-31 | 13F | Strait & Sound Wealth Management LLC | 7 032 | −0,54 | 325 | −1,52 | ||||
| 2025-08-14 | 13F | Mml Investors Services, Llc | 12 693 | 99,80 | 1 | |||||
| 2025-05-15 | 13F | Hrt Financial Lp | 0 | −100,00 | 0 | |||||
| 2025-08-04 | 13F | Mayflower Financial Advisors, LLC | 109 684 | 100,33 | 5 063 | 98,63 | ||||
| 2025-07-17 | 13F | One Wealth Advisors, LLC | 306 163 | 101,72 | 14 132 | 99,94 | ||||
| 2025-07-08 | 13F | Richard P Slaughter Associates Inc | 96 970 | 4 476 | ||||||
| 2025-07-31 | 13F | TSA Wealth Managment LLC | 144 503 | 3,15 | 6 670 | 2,25 | ||||
| 2025-08-07 | 13F | Nwam Llc | 19 466 | 94,87 | 889 | 90,97 | ||||
| 2025-07-22 | 13F | Sutton Place Investors Llc | 26 173 | 93,07 | 1 208 | 91,44 | ||||
| 2025-07-25 | 13F | Cwm, Llc | 43 546 | 14,70 | 2 | 100,00 | ||||
| 2025-07-28 | 13F | Mutual Advisors, LLC | 18 535 | 844 | ||||||
| 2025-08-19 | 13F | Advisory Services Network, LLC | 11 955 | 110,03 | 546 | 106,04 | ||||
| 2025-08-13 | 13F | StoneX Group Inc. | 6 806 | 314 | ||||||
| 2025-08-13 | 13F | West Wealth Group, LLC | 85 571 | 22,51 | 3 944 | 21,09 | ||||
| 2025-07-25 | 13F | Envestnet Portfolio Solutions, Inc. | 4 953 | −34,21 | 229 | −34,86 | ||||
| 2025-08-15 | 13F | Brown Financial Advisors | 29 440 | −3,50 | 1 359 | −4,37 |