Grundläggande statistik
| Institutionella ägare | 248 total, 248 long only, 0 short only, 0 long/short - change of 1,21% MRQ |
| Genomsnittlig portföljallokering | 0.5223 % - change of −0,96% MRQ |
| Institutionella aktier (lång) | 29 705 921 (ex 13D/G) - change of 1,51MM shares 5,35% MRQ |
| Institutionellt värde (lång) | $ 1 367 220 USD ($1000) |
Institutionellt ägande och aktieägare
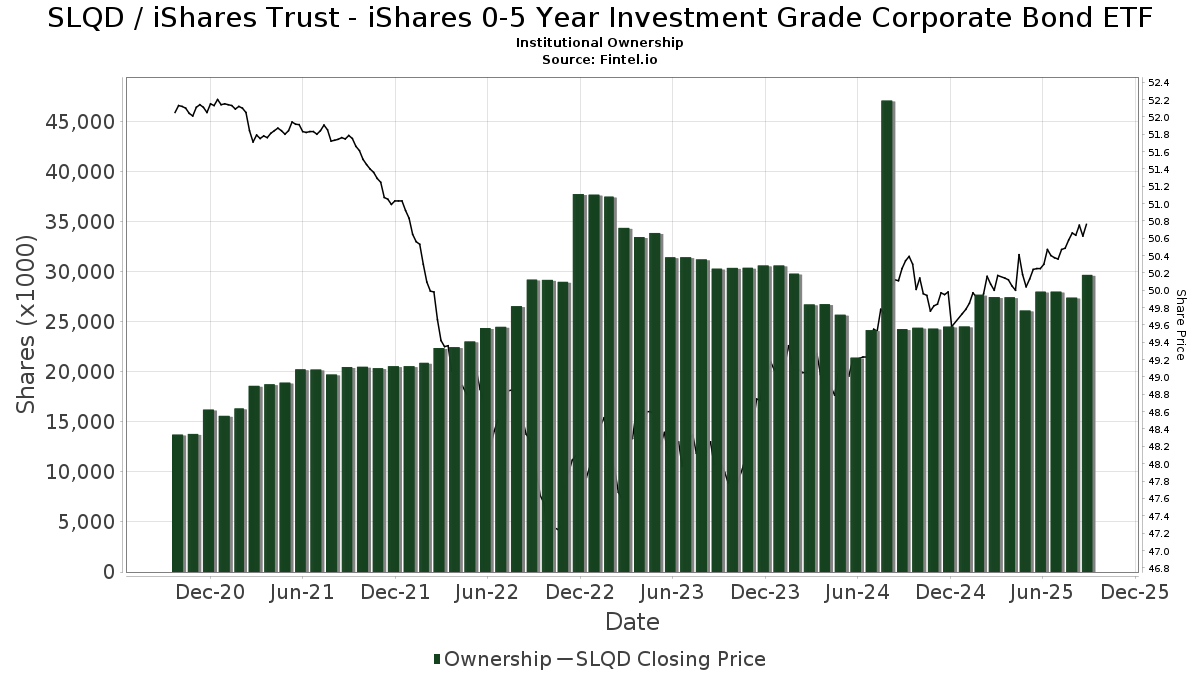
iShares Trust - iShares 0-5 Year Investment Grade Corporate Bond ETF (US:SLQD) har 248 Institutionella ägare och aktieägare som har lämnat in 13D/G- eller 13F-formulär till Securities Exchange Commission (SEC). Dessa institut innehar totalt 29,705,921 aktier. Största aktieägare inkluderar Morgan Stanley, Laurel Wealth Advisors LLC, LPL Financial LLC, LJI Wealth Management, LLC, UBS Group AG, Raymond James Financial Inc, Farmers & Merchants Investments Inc, Bramshill Investments, LLC, Pensionmark Financial Group, Llc, and Ameriprise Financial Inc .
iShares Trust - iShares 0-5 Year Investment Grade Corporate Bond ETF (NasdaqGM:SLQD) Institutionell ägarstruktur visar institutioners och fonders nuvarande positioner i företaget, samt de senaste förändringarna i positionernas storlek. Större aktieägare kan vara enskilda investerare, fonder, hedgefonder eller institutioner. Bilaga 13D visar att investeraren äger (eller ägde) mer än 5% av företaget och avser (eller avsåg) att aktivt eftersträva en förändring av affärsstrategin. Schedule 13G indikerar en passiv investering på över 5%.
The share price as of September 19, 2025 is 50,84 / share. Previously, on September 23, 2024, the share price was 50,43 / share. This represents an increase of 0,80% over that period.
Fondsentimentets poäng
Fondsentimentet poängen(fka Ägarackumulation-poäng) visar vilka aktier som är mest köpta av fonder. Det är resultatet av en sofistikerad kvantitativ flerfaktormodell som identifierar företag med de högsta nivåerna av institutionell ackumulering. Poängsättningsmodellen använder en kombination av den totala ökningen av redovisade ägare, förändringarna i portföljallokeringarna för dessa ägare och andra mått. Siffran sträcker sig från 0 till 100, där högre siffror indikerar en högre nivå av ackumulering i förhållande till sina konkurrenter, och 50 är genomsnittet.
Uppdateringsfrekvens: Dagligen
Se Ownership Explorer, som innehåller en lista över de högst rankade företagen.
AI+ Ask Fintel’s AI assistant about iShares Trust - iShares 0-5 Year Investment Grade Corporate Bond ETF.
Thinking of good questions…
Institutionell sälj/köp-kvot
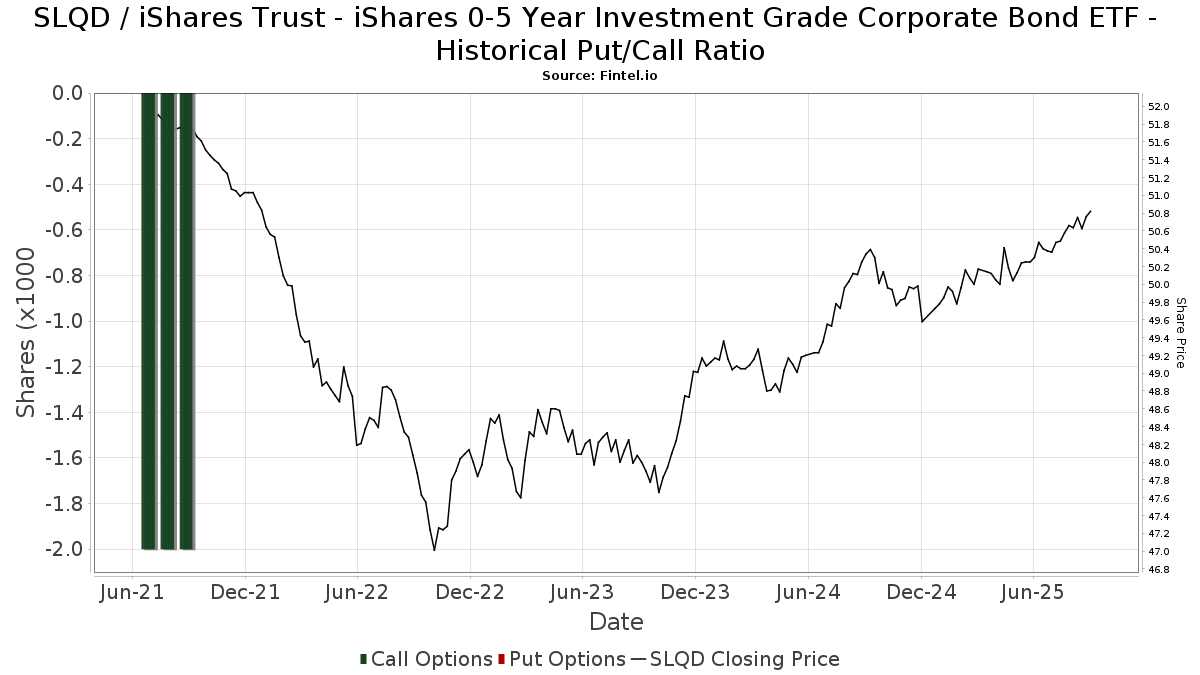
Förutom att rapportera vanliga eget kapital- och skuldemissioner måste institutioner med mer än 100MM tillgångar under förvaltning också avslöja sina innehav av sälj- och köpoptioner. Eftersom säljoptioner i allmänhet indikerar ett negativt sentiment och köpoptioner indikerar ett positivt sentiment, kan vi få en uppfattning om det övergripande institutionella sentimentet genom att plotta förhållandet mellan säljoptioner och köpoptioner. Diagrammet till höger visar det historiska förhållandet mellan sälj- och köpoptioner för detta instrument.
Genom att använda sälj/köp-kvoten som en indikator på aktieägarnas sentiment undviker man en av de största bristerna med att använda det totala institutionella ägandet, nämligen att en betydande del av de förvaltade tillgångarna investeras passivt för att följa index. Passivt förvaltade fonder köper vanligtvis inte optioner, så indikatorn för sälj/köp-kvoten ger en bättre bild av stämningen i aktivt förvaltade fonder.
13F- och NPORT-arkiveringar
Detaljer om 13F-arkiveringar är gratis. Detaljer om NP-arkiveringar kräver ett premiummedlemskap. Gröna rader indikerar nya positioner. Röda rader indikerar stängda positioner. Klicka på länk symbolen för att se hela transaktionshistoriken.
Uppgradera
för att låsa upp premiumdata och exportera till Excel ![]() .
.
| Fil Datum | Källa | Investerare | Typ | Genomsnittligt pris (beräknat) |
Aktier | Δ Aktier (%) |
Rapporterat värde (1000 USD) |
Δ Värde (%) |
Portföljallokering (%) |
|
|---|---|---|---|---|---|---|---|---|---|---|
| 2025-08-01 | 13F | Envestnet Asset Management Inc | 200 080 | −2,71 | 10 122 | −2,10 | ||||
| 2025-07-09 | 13F | Chesley Taft & Associates LLC | 5 700 | 0,00 | 288 | 0,70 | ||||
| 2025-08-13 | 13F | River Wealth Advisors LLC | 121 016 | −11,81 | 6 122 | −11,26 | ||||
| 2025-08-12 | 13F | Calton & Associates, Inc. | 0 | −100,00 | 0 | |||||
| 2025-07-25 | 13F | Alpha Financial Partners, LLC | 22 694 | 1 148 | ||||||
| 2025-08-12 | 13F | Archer Investment Corp | 3 058 | 0,00 | 155 | 0,65 | ||||
| 2025-08-06 | 13F | Rialto Wealth Management, LLC | 11 613 | 0,00 | 588 | 0,69 | ||||
| 2025-07-30 | 13F | Eqis Capital Management, Inc. | 12 019 | −22,96 | 608 | −22,45 | ||||
| 2025-07-17 | 13F | LexAurum Advisors, LLC | 6 013 | 7,34 | 304 | 8,19 | ||||
| 2025-07-25 | 13F | Envestnet Portfolio Solutions, Inc. | 13 444 | −35,67 | 680 | −35,24 | ||||
| 2025-08-14 | 13F | Bramshill Investments, LLC | 954 338 | 2,96 | 48 280 | 3,60 | ||||
| 2025-08-12 | 13F | Weaver Consulting Group | 4 924 | −7,72 | 249 | −7,09 | ||||
| 2025-07-22 | 13F | Bank Hapoalim Bm | 0 | |||||||
| 2025-07-10 | 13F | Security National Bank | 627 | −23,54 | 32 | −24,39 | ||||
| 2025-08-14 | 13F | Macquarie Group Ltd | 4 111 | 0,00 | 208 | 0,49 | ||||
| 2025-05-15 | 13F | Creative Planning | 0 | −100,00 | 0 | |||||
| 2025-07-29 | 13F | Disciplined Investments, LLC | 11 259 | 0,18 | 570 | 0,71 | ||||
| 2025-08-14 | 13F | Garden State Investment Advisory Services LLC | 24 020 | −0,68 | 1 216 | 0,00 | ||||
| 2025-07-07 | 13F | Investors Research Corp | 92 | 0,00 | 5 | 0,00 | ||||
| 2025-07-29 | 13F | Harbor Asset Planning, Inc. | 222 | 11 | ||||||
| 2025-05-15 | 13F | Beaird Harris Wealth Management, LLC | 0 | −100,00 | 0 | |||||
| 2025-08-14 | 13F | Raymond James Financial Inc | 1 082 542 | −1,83 | 54 766 | −1,22 | ||||
| 2025-08-04 | 13F | Buckhead Capital Management Llc | 8 931 | 20,74 | 452 | 21,56 | ||||
| 2025-08-13 | 13F | Saiph Capital, LLC | 151 198 | 5,04 | 7 649 | 5,69 | ||||
| 2025-07-31 | 13F | Buckingham Strategic Partners | 47 541 | −5,17 | 2 405 | −4,56 | ||||
| 2025-08-04 | 13F | 4J Wealth Management LLC | 14 156 | −1,78 | 716 | −1,10 | ||||
| 2025-07-14 | 13F | Seed Wealth Management, Inc. | 12 050 | 0,00 | 610 | 0,66 | ||||
| 2025-07-22 | 13F | Siligmueller & Norvid Wealth Advisors LLC | 32 584 | −38,26 | 1 641 | −37,83 | ||||
| 2025-08-08 | 13F | Biondo Investment Advisors, LLC | 29 725 | 2,75 | 1 504 | 3,37 | ||||
| 2025-08-08 | 13F | Good Life Advisors, LLC | 7 466 | 378 | ||||||
| 2025-08-13 | 13F | Northwestern Mutual Wealth Management Co | 160 747 | 271,09 | 8 132 | 273,37 | ||||
| 2025-08-14 | 13F | Bnp Paribas Arbitrage, Sa | 0 | −100,00 | 0 | |||||
| 2025-08-14 | 13F | Vista Investment Management | 37 493 | −1,96 | 1 897 | −1,35 | ||||
| 2025-07-09 | 13F | Wolff Financial Management Llc | 11 824 | 0,90 | 1 | |||||
| 2025-04-29 | 13F | Hm Payson & Co | 531 | 6,20 | 27 | 8,33 | ||||
| 2025-07-23 | 13F | Valmark Advisers, Inc. | 6 543 | 0,18 | 331 | 0,61 | ||||
| 2025-08-14 | 13F | Mariner, LLC | 140 238 | 253,90 | 7 095 | 256,12 | ||||
| 2025-08-14 | 13F/A | Bank Julius Baer & Co. Ltd, Zurich | 21 540 | 0,00 | 1 090 | 0,55 | ||||
| 2025-08-29 | NP | BHILX - BHILL Fund Managed Account Completion Shares | 55 773 | 2 822 | ||||||
| 2025-07-24 | 13F | Jfs Wealth Advisors, Llc | 2 656 | 1,03 | 134 | 1,52 | ||||
| 2025-08-01 | 13F | Advisory Alpha, LLC | 13 044 | 0,00 | 660 | 0,61 | ||||
| 2025-08-06 | 13F | Prospera Financial Services Inc | 46 084 | 133,50 | 2 332 | 135,08 | ||||
| 2025-08-14 | 13F | CIBC World Markets Inc. | 12 802 | 5,53 | 648 | 6,24 | ||||
| 2025-08-12 | 13F | SRS Capital Advisors, Inc. | 60 | 0,00 | 3 | 0,00 | ||||
| 2025-05-15 | 13F | Pathstone Holdings, LLC | 0 | −100,00 | 0 | |||||
| 2025-07-17 | 13F | Montis Financial, LLC | 29 249 | −23,12 | 1 480 | −22,65 | ||||
| 2025-08-19 | 13F | Advisory Services Network, LLC | 5 226 | 14,28 | 264 | 14,85 | ||||
| 2025-08-13 | 13F | Ofc Financial Planning, Llc | 33 053 | −3,37 | 1 672 | −2,73 | ||||
| 2025-08-12 | 13F | Atlas Capital Advisors Llc | 148 | 0,00 | 7 | 0,00 | ||||
| 2025-08-13 | 13F | Providence Capital Advisors, LLC | 88 | 4 | ||||||
| 2025-05-14 | 13F | REAP Financial Group, LLC | 0 | −100,00 | 0 | |||||
| 2025-08-14 | 13F | Royal Bank Of Canada | 602 006 | 10,06 | 30 455 | 10,74 | ||||
| 2025-05-15 | 13F | State Of Wisconsin Investment Board | 0 | −100,00 | 0 | |||||
| 2025-08-14 | 13F | Jane Street Group, Llc | 229 013 | 186,96 | 11 586 | 188,76 | ||||
| 2025-07-23 | 13F | Meitav Dash Investments Ltd | 5 055 | −59,57 | 255 | −59,49 | ||||
| 2025-08-13 | 13F | Colonial Trust Co / SC | 163 903 | 3,01 | 8 292 | 3,64 | ||||
| 2025-07-25 | 13F | Investment Advisory Group, LLC | 9 876 | 0,00 | 500 | 0,60 | ||||
| 2025-08-12 | 13F | Waterloo Capital, L.P. | 341 102 | 44,12 | 17 256 | 45,02 | ||||
| 2025-08-14 | 13F | Susquehanna International Group, Llp | 39 362 | 46,99 | 1 991 | 47,92 | ||||
| 2025-07-10 | 13F | Voisard Asset Management Group, Inc. | 739 636 | 10,14 | 37 418 | 10,82 | ||||
| 2025-08-05 | 13F | MidAtlantic Capital Management, Inc. | 6 907 | 0,00 | 349 | 0,58 | ||||
| 2025-05-15 | 13F | Old Mission Capital Llc | 0 | −100,00 | 0 | −100,00 | ||||
| 2025-08-14 | 13F | Atomi Financial Group, Inc. | 16 456 | −1,43 | 833 | −0,83 | ||||
| 2025-08-12 | 13F | Pettyjohn, Wood & White, Inc | 8 090 | 0,00 | 409 | 0,74 | ||||
| 2025-08-14 | 13F | Mml Investors Services, Llc | 139 537 | 5,65 | 7 | 16,67 | ||||
| 2025-08-08 | 13F | Citizens Financial Group Inc/ri | 5 729 | 290 | ||||||
| 2025-07-25 | 13F | Cwm, Llc | 111 | 0,00 | 0 | |||||
| 2025-08-06 | 13F | Hoxton Planning & Management, LLC | 10 269 | −4,07 | 520 | −3,53 | ||||
| 2025-08-12 | 13F | Steward Partners Investment Advisory, Llc | 818 | 0,00 | 41 | 0,00 | ||||
| 2025-08-12 | 13F | MAI Capital Management | 879 957 | 3,03 | 44 517 | 3,67 | ||||
| 2025-07-17 | 13F | One Wealth Advisors, LLC | 15 948 | −5,79 | 807 | −5,29 | ||||
| 2025-07-24 | 13F | Blair William & Co/il | 0 | −100,00 | 0 | |||||
| 2025-08-28 | NP | GPICX - GuidePath(R) Conservative Income Fund | 109 367 | 3 270,32 | 5 533 | 3 293,87 | ||||
| 2025-04-17 | 13F | Cornell Pochily Investment Advisors, Inc. | 0 | −100,00 | 0 | |||||
| 2025-07-25 | 13F | NorthRock Partners, LLC | 1 591 | −2,57 | 81 | −2,44 | ||||
| 2025-05-07 | 13F | Foundations Investment Advisors, LLC | 0 | −100,00 | 0 | |||||
| 2025-05-15 | 13F/A | Orion Portfolio Solutions, LLC | 6 320 | −70,48 | 318 | −70,21 | ||||
| 2025-08-07 | 13F | Argent Advisors, Inc. | 35 240 | −9,39 | 1 783 | −8,85 | ||||
| 2025-08-14 | 13F | Prelude Capital Management, Llc | 0 | −100,00 | 0 | |||||
| 2025-07-03 | 13F | City Center Advisors, LLC | 23 852 | −6,74 | 1 207 | −6,15 | ||||
| 2025-08-14 | 13F | Obsido Oy | 66 942 | −0,70 | 3 387 | −0,09 | ||||
| 2025-08-14 | 13F | Fmr Llc | 344 | 112,35 | 17 | 112,50 | ||||
| 2025-07-30 | 13F | Greenup Street Wealth Management Llc | 717 259 | −5,56 | 36 286 | −4,98 | ||||
| 2025-08-04 | 13F | Atria Investments Llc | 76 940 | −0,78 | 3 892 | −0,15 | ||||
| 2025-07-23 | 13F | Prime Capital Investment Advisors, LLC | 5 315 | −12,15 | 269 | −11,84 | ||||
| 2025-08-12 | 13F | Franklin Resources Inc | 3 600 | −12,20 | 182 | −11,65 | ||||
| 2025-08-13 | 13F | Cary Street Partner Investment Advisory Llc | 68 | −2,86 | 3 | 0,00 | ||||
| 2025-08-14 | 13F | Ameriprise Financial Inc | 887 637 | 3,67 | 44 894 | 4,10 | ||||
| 2025-07-29 | 13F | Ifrah Financial Services, Inc. | 149 062 | −0,00 | 7 541 | 0,61 | ||||
| 2025-08-05 | 13F | Huntington National Bank | 2 | |||||||
| 2025-08-08 | 13F | Cetera Investment Advisers | 191 210 | 1,36 | 9 673 | 1,99 | ||||
| 2025-07-25 | 13F | Atria Wealth Solutions, Inc. | 4 895 | −97,62 | 247 | −97,62 | ||||
| 2025-07-21 | 13F | Ameriflex Group, Inc. | 5 782 | 19,27 | 292 | 20,16 | ||||
| 2025-08-12 | 13F | Barings Llc | 27 476 | 248,50 | 1 390 | 251,01 | ||||
| 2025-08-14 | 13F | Citadel Advisors Llc | 71 616 | −17,94 | 3 623 | −17,43 | ||||
| 2025-07-29 | 13F | Semitam Bonam Llc | 5 573 | 282 | ||||||
| 2025-08-05 | 13F | Bank Of Montreal /can/ | 37 440 | −11,60 | 1 894 | −11,04 | ||||
| 2025-08-14 | 13F | Two Sigma Securities, Llc | 7 464 | −12,77 | 378 | −12,33 | ||||
| 2025-08-08 | 13F | Larson Financial Group LLC | 192 | 0,00 | 10 | 0,00 | ||||
| 2025-07-31 | 13F | Cambridge Investment Research Advisors, Inc. | 42 763 | 297,28 | 2 | |||||
| 2025-08-15 | 13F | Kestra Advisory Services, LLC | 5 369 | −13,24 | 272 | −12,86 | ||||
| 2025-07-16 | 13F | Novem Group | 4 401 | 0,00 | 223 | 0,45 | ||||
| 2025-07-17 | 13F | Janney Montgomery Scott LLC | 19 943 | −4,41 | 1 | 0,00 | ||||
| 2025-07-15 | 13F | LVZ Advisors, Inc. | 5 062 | −32,86 | 256 | −32,45 | ||||
| 2025-04-22 | 13F | Castleview Partners, Llc | 0 | −100,00 | 0 | |||||
| 2025-07-28 | 13F | Allianz Asset Management GmbH | 627 827 | 5,46 | 31 762 | 6,11 | ||||
| 2025-08-12 | 13F | LPL Financial LLC | 1 227 737 | 7,44 | 62 111 | 8,11 | ||||
| 2025-07-29 | 13F | Fundamentun, Llc | 6 459 | 14,38 | 327 | 15,19 | ||||
| 2025-07-11 | 13F | Farther Finance Advisors, LLC | 117 | −22,00 | 6 | −28,57 | ||||
| 2025-04-23 | 13F | Williams Financial, LLC | 0 | −100,00 | 0 | |||||
| 2025-08-06 | 13F | Hallmark Capital Management Inc | 771 | 39 | ||||||
| 2025-08-12 | 13F | Camden National Bank | 305 682 | 2,64 | 15 464 | 3,27 | ||||
| 2025-08-14 | 13F | Federation des caisses Desjardins du Quebec | 117 666 | −4,99 | 5 953 | −4,42 | ||||
| 2025-08-13 | 13F | Summit Financial, LLC | 145 753 | 4,11 | 7 374 | 4,74 | ||||
| 2025-08-15 | 13F | CI Private Wealth, LLC | 22 192 | 33,65 | 1 123 | 34,53 | ||||
| 2025-08-12 | 13F | Fortis Capital Management LLC | 17 431 | 0,58 | 882 | 1,15 | ||||
| 2025-08-11 | 13F | HighTower Advisors, LLC | 212 366 | −3,55 | 10 744 | −2,96 | ||||
| 2025-08-11 | 13F | Wescott Financial Advisory Group, LLC | 22 597 | −3,17 | 1 143 | −2,56 | ||||
| 2025-04-14 | 13F | Bangor Savings Bank | 0 | −100,00 | 0 | |||||
| 2025-08-12 | 13F | Proequities, Inc. | 0 | 0 | ||||||
| 2025-08-13 | 13F | Baird Financial Group, Inc. | 61 815 | −18,81 | 3 127 | −18,31 | ||||
| 2025-07-17 | 13F | Nelson, Van Denburg & Campbell Wealth Management Group, LLC | 4 199 | 0,00 | 212 | 0,47 | ||||
| 2025-08-18 | 13F | Geneos Wealth Management Inc. | 100 | 0,00 | 5 | 0,00 | ||||
| 2025-07-15 | 13F | Kelly Financial Group Llc | 16 293 | −32,58 | 824 | −32,18 | ||||
| 2025-07-31 | 13F | CVA Family Office, LLC | 40 | 2 | ||||||
| 2025-07-28 | 13F | Harbour Investments, Inc. | 3 123 | −4,23 | 158 | −3,68 | ||||
| 2025-08-14 | 13F | Sunbelt Securities, Inc. | 3 354 | 0,00 | 167 | −1,19 | ||||
| 2025-07-18 | 13F | Truist Financial Corp | 0 | −100,00 | 0 | |||||
| 2025-08-11 | 13F | Aptus Capital Advisors, LLC | 272 | 0,00 | 14 | 0,00 | ||||
| 2025-08-12 | 13F | Insigneo Advisory Services, Llc | 14 337 | 2,57 | 725 | 3,28 | ||||
| 2025-07-30 | 13F | Clune & Associates, Ltd. | 21 691 | −1,28 | 1 097 | −0,63 | ||||
| 2025-08-18 | 13F/A | National Bank Of Canada /fi/ | 1 315 | 0,00 | 67 | 0,00 | ||||
| 2025-07-09 | 13F | Christopher J. Hasenberg, Inc | 632 | 0,00 | 32 | 0,00 | ||||
| 2025-07-25 | 13F | Concurrent Investment Advisors, LLC | 6 257 | −32,33 | 317 | −31,90 | ||||
| 2025-08-14 | 13F | EP Wealth Advisors, Inc. | 2 861 | 145 | ||||||
| 2025-07-10 | 13F | Charter Oak Capital Management, LLC | 82 446 | −8,46 | 4 171 | −7,91 | ||||
| 2025-08-06 | 13F | Stokes Family Office, LLC | 17 917 | 0,00 | 906 | 0,67 | ||||
| 2025-08-14 | 13F | Stifel Financial Corp | 225 505 | −2,22 | 11 408 | −1,62 | ||||
| 2025-08-14 | 13F | Comerica Bank | 42 493 | −1,23 | 2 150 | −0,65 | ||||
| 2025-07-14 | 13F | AdvisorNet Financial, Inc | 4 690 | 36,93 | 237 | 37,79 | ||||
| 2025-07-02 | 13F | Central Pacific Bank - Trust Division | 23 454 | 0,00 | 1 187 | 0,59 | ||||
| 2025-07-28 | 13F | RFG Advisory, LLC | 10 507 | 532 | ||||||
| 2025-08-12 | 13F | O'shaughnessy Asset Management, Llc | 12 | 0,00 | 1 | |||||
| 2025-05-15 | 13F | London & Capital Asset Management Ltd | 0 | −100,00 | 0 | |||||
| 2025-05-08 | 13F | Strategic Advocates LLC | 0 | −100,00 | 0 | |||||
| 2025-08-04 | 13F | Creative Financial Designs Inc /adv | 442 768 | 4,58 | 22 400 | 5,22 | ||||
| 2025-05-05 | 13F | Lindbrook Capital, Llc | 1 090 | 0,00 | 55 | 0,00 | ||||
| 2025-08-07 | 13F | Global Wealth Management Investment Advisory, Inc. | 228 698 | 0,96 | 11 570 | 1,58 | ||||
| 2025-04-16 | 13F | Fort Washington Investment Advisors Inc /oh/ | 0 | −100,00 | 0 | |||||
| 2025-07-21 | 13F | Life Planning Partners, Inc | 31 237 | 10,05 | 1 580 | 10,72 | ||||
| 2025-07-17 | 13F | Sound Income Strategies, LLC | 296 | 0,00 | 15 | 0,00 | ||||
| 2025-07-25 | 13F | PrairieView Partners, LLC | 20 994 | −5,95 | 1 | 0,00 | ||||
| 2025-08-12 | 13F | Laurel Wealth Advisors LLC | 2 045 208 | 4 902,59 | 40 | −98,05 | ||||
| 2025-08-13 | 13F | Scotia Capital Inc. | 130 585 | −48,08 | 6 606 | −47,76 | ||||
| 2025-07-10 | 13F | Secure Asset Management, LLC | 4 903 | 6,06 | 248 | 6,90 | ||||
| 2025-08-04 | 13F | Pensionmark Financial Group, Llc | 946 574 | 8,81 | 47 887 | 9,48 | ||||
| 2025-08-04 | 13F | L.m. Kohn & Company | 5 715 | 289 | ||||||
| 2025-07-30 | 13F | Rehmann Capital Advisory Group | 19 887 | −3,56 | 1 006 | −2,90 | ||||
| 2025-08-08 | 13F | Avantax Advisory Services, Inc. | 163 667 | 30,24 | 8 280 | 31,04 | ||||
| 2025-05-16 | 13F | Coppell Advisory Solutions LLC | 0 | −100,00 | 0 | |||||
| 2025-08-14 | 13F | Integrated Wealth Concepts LLC | 14 673 | 10,39 | 742 | 11,08 | ||||
| 2025-07-16 | 13F | Tru Independence Asset Management 2, Llc | 6 552 | 0,00 | 331 | 0,61 | ||||
| 2025-07-23 | 13F | TPG Financial Advisors, LLC | 0 | −100,00 | 0 | |||||
| 2025-08-01 | 13F | Integral Investment Advisors, Inc. | 224 388 | 4,24 | 11 352 | 4,88 | ||||
| 2025-08-04 | 13F | Bay Colony Advisory Group, Inc d/b/a Bay Colony Advisors | 5 352 | −73,60 | 271 | −73,48 | ||||
| 2025-07-22 | 13F | Private Wealth Group, LLC | 22 395 | −23,69 | 1 133 | −23,25 | ||||
| 2025-08-11 | 13F | Traub Capital Management LLC | 500 | 25 | ||||||
| 2025-08-14 | 13F | RMB Capital Management, LLC | 32 194 | −14,79 | 1 629 | −14,27 | ||||
| 2025-08-14 | 13F | GWM Advisors LLC | 283 086 | 157,22 | 14 321 | 158,83 | ||||
| 2025-08-14 | 13F | Headinvest, Llc | 4 859 | 0,00 | 246 | 0,41 | ||||
| 2025-07-15 | 13F | Alhambra Investment Partners LLC | 4 381 | 0,00 | 222 | 0,45 | ||||
| 2025-07-08 | 13F | Nbc Securities, Inc. | 455 | −28,46 | 0 | |||||
| 2025-04-28 | 13F | D.a. Davidson & Co. | 0 | −100,00 | 0 | |||||
| 2025-08-06 | 13F | Savant Capital, LLC | 4 727 | −6,19 | 239 | −5,53 | ||||
| 2025-08-14 | 13F | FC Advisory LLC | 19 612 | 0,55 | 992 | 1,22 | ||||
| 2025-07-11 | 13F | Caldwell Securities, Inc | 75 | 0,00 | 4 | 0,00 | ||||
| 2025-07-29 | 13F | Private Wealth Management Group, LLC | 16 648 | 4,10 | 842 | 4,73 | ||||
| 2025-04-15 | 13F | Redhawk Wealth Advisors, Inc. | 0 | −100,00 | 0 | |||||
| 2025-08-11 | 13F | Principal Securities, Inc. | 95 618 | 19,81 | 4 837 | 21,87 | ||||
| 2025-07-31 | 13F | Ndwm Llc | 29 038 | −1,25 | 1 469 | −0,61 | ||||
| 2025-08-14 | 13F | IPG Investment Advisors LLC | 19 907 | −25,77 | 1 007 | −25,30 | ||||
| 2025-08-11 | 13F | Rockbridge Investment Management, LCC | 61 988 | 0,03 | 3 136 | 0,64 | ||||
| 2025-08-11 | 13F | Citigroup Inc | 5 949 | 0,12 | 301 | 0,67 | ||||
| 2025-07-24 | 13F | Thompson Investment Management, Inc. | 354 | 0,00 | 18 | 0,00 | ||||
| 2025-08-04 | 13F | Assetmark, Inc | 125 289 | 920,93 | 6 338 | 927,23 | ||||
| 2025-08-11 | 13F | Hexagon Capital Partners LLC | 0 | −100,00 | 0 | |||||
| 2025-07-21 | 13F | Ameritas Advisory Services, LLC | 42 844 | 13,29 | 2 167 | 14,05 | ||||
| 2025-08-07 | 13F | Fonville Wealth Management LLC | 48 834 | −7,85 | 2 471 | −7,42 | ||||
| 2025-07-28 | 13F | Rosenberg Matthew Hamilton | 93 515 | −10,26 | 4 731 | −9,72 | ||||
| 2025-08-19 | 13F/A | Pitcairn Co | 11 680 | 0,00 | 591 | 0,51 | ||||
| 2025-07-24 | 13F | IFP Advisors, Inc | 48 600 | 173,08 | 2 459 | 174,94 | ||||
| 2025-07-28 | 13F | JGP Wealth Management, LLC | 29 511 | 52,88 | 1 493 | 53,81 | ||||
| 2025-08-11 | 13F | Actinver Wealth Management, Inc. | 119 006 | −27,83 | 6 021 | −27,38 | ||||
| 2025-08-13 | 13F | Hsbc Holdings Plc | 8 916 | 25,93 | 451 | 27,04 | ||||
| 2025-05-09 | 13F | Topel & Distasi Wealth Management, LLC | 0 | −100,00 | 0 | |||||
| 2025-08-11 | 13F | TD Waterhouse Canada Inc. | 51 755 | 31,43 | 2 607 | 31,95 | ||||
| 2025-08-08 | 13F | Tortoise Investment Management, LLC | 0 | −100,00 | 0 | |||||
| 2025-08-05 | 13F | Harel Insurance Investments & Financial Services Ltd. | 99 623 | −46,49 | 5 | −44,44 | ||||
| 2025-08-13 | 13F | Berkshire Asset Management Llc/pa | 24 954 | −3,83 | 1 262 | −2,85 | ||||
| 2025-08-13 | 13F | Colonial Trust Advisors | 270 227 | 5,40 | 13 671 | 6,04 | ||||
| 2025-05-13 | 13F | Thrivent Financial For Lutherans | 0 | −100,00 | 0 | |||||
| 2025-07-22 | 13F | Belpointe Asset Management LLC | 76 519 | 2,92 | 3 871 | 3,56 | ||||
| 2025-08-12 | 13F | Edmond De Rothschild Holding S.a. | 6 250 | 0,00 | 316 | 0,64 | ||||
| 2025-07-21 | 13F | Credential Qtrade Securities Inc. | 0 | −100,00 | 0 | −100,00 | ||||
| 2025-07-29 | 13F | Elevation Capital Advisory, LLC | 0 | −100,00 | 0 | |||||
| 2025-08-11 | 13F | Sierra Capital LLC | 142 078 | 6,54 | 7 | 16,67 | ||||
| 2025-08-07 | 13F | Addison Advisors LLC | 413 | 21 | ||||||
| 2025-08-29 | NP | BRMSX - Bramshill Income Performance Fund Institutional Class | 130 563 | 0,00 | 6 605 | 0,62 | ||||
| 2025-08-11 | 13F | Private Advisor Group, LLC | 102 258 | −0,28 | 5 173 | 0,33 | ||||
| 2025-07-15 | 13F | Armis Advisers, LLC | 8 741 | 0,59 | 440 | 0,92 | ||||
| 2025-08-15 | 13F | Sugar Maple Asset Management, LLC | 33 373 | 5,24 | 1 688 | 5,90 | ||||
| 2025-07-24 | 13F | Strengthening Families & Communities, LLC | 62 | 1,64 | 3 | 0,00 | ||||
| 2025-08-14 | 13F | Warren Averett Asset Management, LLC | 103 043 | −0,70 | 5 213 | −0,10 | ||||
| 2025-08-12 | 13F | Mmbg Investment Advisors Co. | 16 964 | 0,00 | 858 | 0,70 | ||||
| 2025-08-13 | 13F | Lido Advisors, LLC | 98 763 | −63,95 | 4 996 | −63,73 | ||||
| 2025-08-14 | 13F | Partners Capital Investment Group, Llp | 27 805 | −87,63 | 1 407 | −87,56 | ||||
| 2025-07-17 | 13F | Catalytic Wealth RIA, LLC | 17 596 | 10,48 | 890 | 11,25 | ||||
| 2025-08-01 | 13F | Ashton Thomas Private Wealth, LLC | 5 080 | 27,03 | 257 | 27,86 | ||||
| 2025-08-01 | 13F | Cedar Point Capital Partners, LLC | 10 881 | −52,26 | 550 | −51,97 | ||||
| 2025-08-04 | 13F | Arkadios Wealth Advisors | 14 897 | 23,55 | 754 | 24,26 | ||||
| 2025-08-08 | 13F | Capital Investment Advisory Services, LLC | 375 | 0,00 | 19 | 0,00 | ||||
| 2025-08-19 | 13F | National Asset Management, Inc. | 6 419 | −35,77 | 325 | −34,81 | ||||
| 2025-08-04 | 13F | Whalen Wealth Management Inc. | 90 771 | −7,70 | 4 592 | −7,12 | ||||
| 2025-08-19 | 13F | Newbridge Financial Services Group, Inc. | 3 835 | 194 | ||||||
| 2025-08-15 | 13F | Tower Research Capital LLC (TRC) | 5 074 | 257 | ||||||
| 2025-08-15 | 13F | Morgan Stanley | 2 258 111 | −1,77 | 114 238 | −1,17 | ||||
| 2025-05-09 | 13F | Pathway Financial Advisers, LLC | 0 | −100,00 | 0 | |||||
| 2025-07-10 | 13F | Wealth Enhancement Advisory Services, Llc | 65 546 | 28,03 | 3 301 | 28,25 | ||||
| 2025-07-11 | 13F/A | Financiere des Professionnels - Fonds d,investissement inc. | 255 700 | 0,00 | 12 936 | 0,61 | ||||
| 2025-08-19 | 13F | MRP Capital Investments, LLC | 915 | −22,46 | 46 | −22,03 | ||||
| 2025-05-06 | 13F | Kovack Advisors, Inc. | 0 | −100,00 | 0 | |||||
| 2025-08-08 | 13F | Turn8 Private Wealth Inc. | 49 526 | 7,72 | 2 506 | 8,39 | ||||
| 2025-08-13 | 13F | American Money Management, LLC | 29 748 | −20,19 | 1 505 | −19,74 | ||||
| 2025-08-14 | 13F | New England Asset Management Inc | 100 | 0,00 | 5 | 0,00 | ||||
| 2025-07-25 | 13F | Allspring Global Investments Holdings, LLC | 835 389 | 0,00 | 42 262 | 0,62 | ||||
| 2025-07-21 | 13F | Crews Bank & Trust | 651 171 | 2,23 | 32 943 | 2,86 | ||||
| 2025-07-31 | 13F | Oppenheimer & Co Inc | 11 801 | −1,42 | 597 | −0,67 | ||||
| 2025-08-12 | 13F | Jpmorgan Chase & Co | 244 298 | 37,09 | 12 359 | 37,94 | ||||
| 2025-08-06 | 13F | AE Wealth Management LLC | 1 579 | 3,27 | 80 | 3,95 | ||||
| 2025-08-14 | 13F | Wells Fargo & Company/mn | 205 327 | 117,67 | 10 387 | 119,04 | ||||
| 2025-05-14 | 13F | Flow Traders U.s. Llc | 0 | −100,00 | 0 | |||||
| 2025-07-18 | 13F | Wiser Wealth Management, Inc | 402 027 | 3,14 | 20 339 | 3,78 | ||||
| 2025-08-04 | 13F | Spire Wealth Management | 7 168 | 8,34 | 363 | 9,04 | ||||
| 2025-07-08 | 13F | Parallel Advisors, LLC | 4 635 | 69,47 | 234 | 70,80 | ||||
| 2025-07-17 | 13F | Hanson & Doremus Investment Management | 418 | 0,00 | 0 | |||||
| 2025-08-14 | 13F | Ancora Advisors, LLC | 418 | 0,00 | 21 | 0,00 | ||||
| 2025-07-14 | 13F | Farmers & Merchants Investments Inc | 1 008 095 | −2,24 | 51 000 | −1,64 | ||||
| 2025-08-13 | 13F | Level Four Advisory Services, Llc | 7 108 | −0,28 | 360 | 0,28 | ||||
| 2025-09-04 | 13F/A | Advisor Group Holdings, Inc. | 149 997 | −39,83 | 7 592 | −39,45 | ||||
| 2025-07-29 | 13F | Private Trust Co Na | 8 787 | 100,16 | 445 | 101,82 | ||||
| 2025-08-14 | 13F | Goldman Sachs Group Inc | 59 795 | −0,24 | 3 025 | 0,40 | ||||
| 2025-08-05 | 13F | EPG Wealth Management LLC | 37 | 0,00 | 2 | 0,00 | ||||
| 2025-07-30 | 13F | Atlantic Edge Private Wealth Management, LLC | 1 300 | 0,00 | 66 | 0,00 | ||||
| 2025-08-14 | 13F | Fairview Capital Investment Management, Llc | 80 276 | 0,00 | 4 061 | 0,62 | ||||
| 2025-08-05 | 13F | Trail Ridge Investment Advisors, LLC | 75 207 | −0,22 | 3 797 | 0,21 | ||||
| 2025-07-30 | 13F | Pittenger & Anderson Inc | 2 100 | 0,00 | 106 | 0,95 | ||||
| 2025-07-30 | 13F | Probity Advisors, Inc. | 12 695 | −7,67 | 642 | −7,09 | ||||
| 2025-08-06 | 13F | Vestmark Advisory Solutions, Inc. | 12 153 | 615 | ||||||
| 2025-08-14 | 13F | Mercer Global Advisors Inc /adv | 4 752 | −41,36 | 240 | −41,03 | ||||
| 2025-07-29 | 13F | Stratos Wealth Partners, LTD. | 39 965 | −5,59 | 2 022 | −5,03 | ||||
| 2025-08-14 | 13F | LaSalle St. Investment Advisors, LLC | 0 | −100,00 | 0 | |||||
| 2025-08-14 | 13F | Financial Engines Advisors L.L.C. | 114 701 | −5,81 | 5 803 | −5,23 | ||||
| 2025-08-14 | 13F | Bank Of America Corp /de/ | 675 535 | −2,20 | 34 175 | −1,60 | ||||
| 2025-07-31 | 13F | LJI Wealth Management, LLC | 1 120 845 | 1,49 | 56 704 | 2,12 | ||||
| 2025-08-14 | 13F | Hrt Financial Lp | 0 | −100,00 | 0 | |||||
| 2025-07-25 | 13F | Summa Corp. | 12 000 | 0,00 | 607 | 0,66 | ||||
| 2025-07-25 | 13F | LRI Investments, LLC | 1 960 | −2,15 | 99 | −1,00 | ||||
| 2025-07-31 | 13F | Cosner Financial Group, LLC | 34 744 | 0,00 | 1 758 | 0,63 | ||||
| 2025-08-05 | 13F | Sigma Planning Corp | 26 124 | 11,59 | 1 322 | 12,23 | ||||
| 2025-08-14 | 13F | UBS Group AG | 1 104 138 | 2,04 | 55 858 | 2,67 | ||||
| 2025-07-23 | 13F | Nbt Bank N A /ny | 1 145 | 0,00 | 58 | 0,00 | ||||
| 2025-08-07 | 13F | Allworth Financial LP | 5 019 | 148,59 | 254 | 150,50 | ||||
| 2025-08-13 | 13F | GeoWealth Management, LLC | 17 596 | 10,48 | 890 | 11,25 | ||||
| 2025-08-15 | 13F | Equitable Holdings, Inc. | 25 536 | 79,93 | 1 292 | 81,07 | ||||
| 2025-08-13 | 13F | Jones Financial Companies Lllp | 79 283 | 50,44 | 4 006 | 51,28 | ||||
| 2025-07-29 | 13F | International Assets Investment Management, Llc | 34 858 | −5,78 | 1 763 | −5,22 | ||||
| 2025-08-05 | 13F | Tiaa Trust, National Association | 284 941 | −43,64 | 14 415 | −43,29 | ||||
| 2025-08-13 | 13F | Renaissance Technologies Llc | 265 500 | −29,07 | 13 432 | −28,63 | ||||
| 2025-08-13 | 13F | Cary Street Partners Financial Llc | 24 373 | −0,42 | 1 233 | 0,24 | ||||
| 2025-08-13 | 13F | EverSource Wealth Advisors, LLC | 2 | 0,00 | 0 | |||||
| 2025-07-09 | 13F | Southern Style Financial, Inc. | 0 | −100,00 | 0 | |||||
| 2025-08-14 | 13F | DecisionPoint Financial, LLC | 102 445 | −2,59 | 5 161 | −2,38 | ||||
| 2025-08-12 | 13F | Bokf, Na | 0 | −100,00 | 0 | |||||
| 2025-08-14 | 13F | Snowden Capital Advisors LLC | 4 836 | 0,00 | 245 | 0,41 | ||||
| 2025-07-28 | 13F | Mutual Advisors, LLC | 19 809 | 20,37 | 1 000 | 20,80 | ||||
| 2025-08-14 | 13F | Brinker Capital Investments, LLC | 0 | −100,00 | 0 | |||||
| 2025-08-06 | 13F | Commonwealth Equity Services, Llc | 154 882 | −2,62 | 8 | 0,00 | ||||
| 2025-08-12 | 13F | Global Retirement Partners, LLC | 3 687 | 37,22 | 187 | 39,85 |
Other Listings
| MX:SLQD | |
| CL:SLQD | |
| CL:SLQD CL |