Grundläggande statistik
| Institutionella ägare | 169 total, 168 long only, 0 short only, 1 long/short - change of −3,41% MRQ |
| Genomsnittlig portföljallokering | 0.4584 % - change of −12,18% MRQ |
| Institutionella aktier (lång) | 4 930 300 (ex 13D/G) - change of −0,51MM shares −9,30% MRQ |
| Institutionellt värde (lång) | $ 384 539 USD ($1000) |
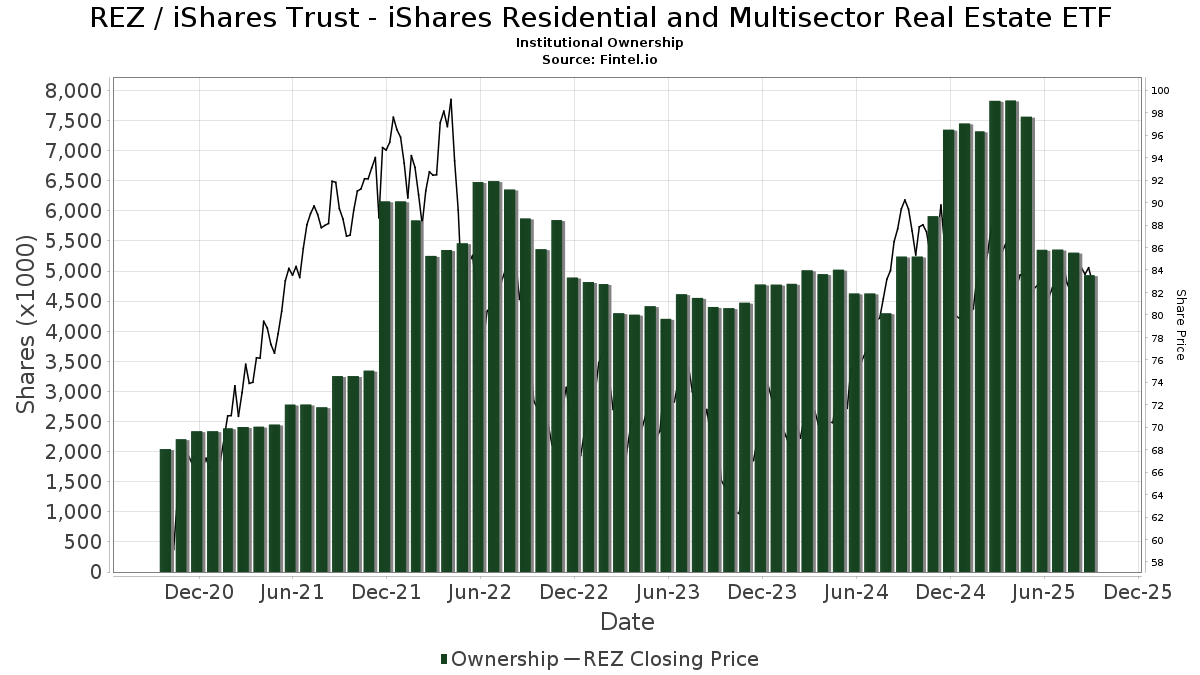
Institutionellt ägande och aktieägare
iShares Trust - iShares Residential and Multisector Real Estate ETF (US:REZ) har 169 Institutionella ägare och aktieägare som har lämnat in 13D/G- eller 13F-formulär till Securities Exchange Commission (SEC). Dessa institut innehar totalt 4,930,300 aktier. Största aktieägare inkluderar Morgan Stanley, Franklin, Parlapiano, Turner & Welch, LLC, Northwestern Mutual Wealth Management Co, Aprio Wealth Management, LLC, Tobias Financial Advisors, Inc., Cornerstone Planning Group LLC, Evergreen Capital Management Llc, Ameriprise Financial Inc, Royal Bank Of Canada, and Advisor Group Holdings, Inc. .
iShares Trust - iShares Residential and Multisector Real Estate ETF (ARCA:REZ) Institutionell ägarstruktur visar institutioners och fonders nuvarande positioner i företaget, samt de senaste förändringarna i positionernas storlek. Större aktieägare kan vara enskilda investerare, fonder, hedgefonder eller institutioner. Bilaga 13D visar att investeraren äger (eller ägde) mer än 5% av företaget och avser (eller avsåg) att aktivt eftersträva en förändring av affärsstrategin. Schedule 13G indikerar en passiv investering på över 5%.
The share price as of September 15, 2025 is 84,29 / share. Previously, on September 16, 2024, the share price was 91,05 / share. This represents a decline of 7,42% over that period.
Fondsentimentets poäng
Fondsentimentet poängen(fka Ägarackumulation-poäng) visar vilka aktier som är mest köpta av fonder. Det är resultatet av en sofistikerad kvantitativ flerfaktormodell som identifierar företag med de högsta nivåerna av institutionell ackumulering. Poängsättningsmodellen använder en kombination av den totala ökningen av redovisade ägare, förändringarna i portföljallokeringarna för dessa ägare och andra mått. Siffran sträcker sig från 0 till 100, där högre siffror indikerar en högre nivå av ackumulering i förhållande till sina konkurrenter, och 50 är genomsnittet.
Uppdateringsfrekvens: Dagligen
Se Ownership Explorer, som innehåller en lista över de högst rankade företagen.
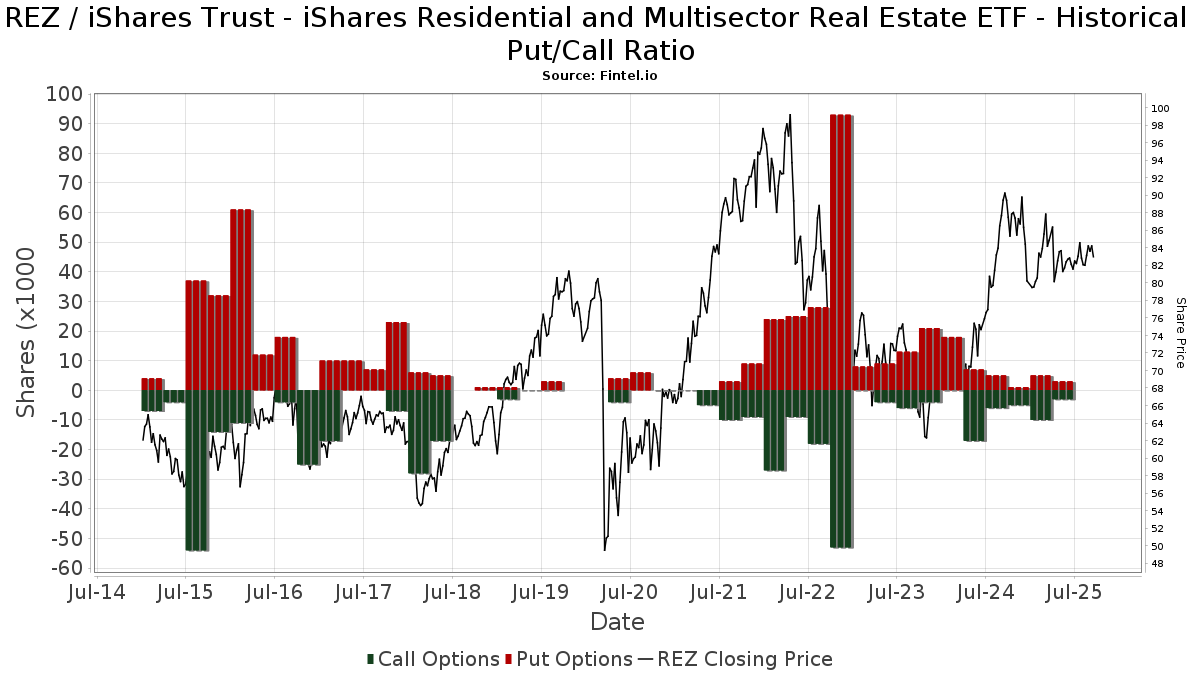
Institutionell sälj/köp-kvot
Förutom att rapportera vanliga eget kapital- och skuldemissioner måste institutioner med mer än 100MM tillgångar under förvaltning också avslöja sina innehav av sälj- och köpoptioner. Eftersom säljoptioner i allmänhet indikerar ett negativt sentiment och köpoptioner indikerar ett positivt sentiment, kan vi få en uppfattning om det övergripande institutionella sentimentet genom att plotta förhållandet mellan säljoptioner och köpoptioner. Diagrammet till höger visar det historiska förhållandet mellan sälj- och köpoptioner för detta instrument.
Genom att använda sälj/köp-kvoten som en indikator på aktieägarnas sentiment undviker man en av de största bristerna med att använda det totala institutionella ägandet, nämligen att en betydande del av de förvaltade tillgångarna investeras passivt för att följa index. Passivt förvaltade fonder köper vanligtvis inte optioner, så indikatorn för sälj/köp-kvoten ger en bättre bild av stämningen i aktivt förvaltade fonder.
13F- och NPORT-arkiveringar
Detaljer om 13F-arkiveringar är gratis. Detaljer om NP-arkiveringar kräver ett premiummedlemskap. Gröna rader indikerar nya positioner. Röda rader indikerar stängda positioner. Klicka på länk symbolen för att se hela transaktionshistoriken.
Uppgradera
för att låsa upp premiumdata och exportera till Excel ![]() .
.
| Fil Datum | Källa | Investerare | Typ | Genomsnittligt pris (beräknat) |
Aktier | Δ Aktier (%) |
Rapporterat värde (1000 USD) |
Δ Värde (%) |
Portföljallokering (%) |
|
|---|---|---|---|---|---|---|---|---|---|---|
| 2025-08-13 | 13F | Quadrature Capital Ltd | 10 176 | −54,92 | 837 | −57,03 | ||||
| 2025-08-04 | 13F | Spire Wealth Management | 135 | −66,75 | 11 | −68,57 | ||||
| 2025-07-25 | 13F | We Are One Seven, LLC | 0 | −100,00 | 0 | |||||
| 2025-07-29 | 13F | Disciplined Investments, LLC | 3 583 | 0,00 | 295 | −4,53 | ||||
| 2025-08-14 | 13F | Susquehanna International Group, Llp | Call | 0 | −100,00 | 0 | ||||
| 2025-07-31 | 13F | Cambridge Investment Research Advisors, Inc. | 15 374 | −3,65 | 1 | 0,00 | ||||
| 2025-08-14 | 13F | D. E. Shaw & Co., Inc. | 8 193 | 9,34 | 675 | 4,17 | ||||
| 2025-08-08 | 13F | Fortis Group Advisors, LLC | 0 | −100,00 | 0 | |||||
| 2025-08-13 | 13F | Dynamic Wealth Strategies, LLC | 2 832 | 16,54 | 233 | 10,95 | ||||
| 2025-07-16 | 13F | Castleview Partners, Llc | 4 201 | 35,78 | 346 | 29,21 | ||||
| 2025-08-13 | 13F | Ark & Tlk Investments, Llc | 3 397 | 0,00 | 280 | −4,78 | ||||
| 2025-08-14 | 13F | Royal Bank Of Canada | 147 266 | −3,15 | 12 125 | −7,74 | ||||
| 2025-07-15 | 13F | Burns Matteson Capital Management, LLC | 18 891 | 0,58 | 1 556 | −4,19 | ||||
| 2025-07-07 | 13F | RDA Financial Network | 3 035 | 0,30 | 250 | −4,60 | ||||
| 2025-05-16 | 13F | Ascent Group, LLC | 0 | −100,00 | 0 | |||||
| 2025-08-04 | 13F | Assetmark, Inc | 112 | −80,42 | 9 | −81,63 | ||||
| 2025-08-18 | 13F | Hollencrest Capital Management | 263 | 0,00 | 22 | −4,55 | ||||
| 2025-08-14 | 13F | Goldman Sachs Group Inc | 23 941 | 1 971 | ||||||
| 2025-08-12 | 13F | Prosperitas Financial LLC | 24 430 | 0,86 | 2 012 | −3,92 | ||||
| 2025-08-19 | 13F | National Asset Management, Inc. | 3 524 | 290 | ||||||
| 2025-08-14 | 13F | Sunbelt Securities, Inc. | 100 | 8 | ||||||
| 2025-08-14 | 13F | Hrt Financial Lp | 2 764 | 0 | ||||||
| 2025-08-06 | 13F | Legacy Wealth Managment, LLC/ID | 21 | 0,00 | 2 | 0,00 | ||||
| 2025-04-14 | 13F | Farther Finance Advisors, LLC | 0 | −100,00 | 0 | |||||
| 2025-08-14 | 13F | Evergreen Capital Management Llc | 162 276 | 8,47 | 13 362 | 3,35 | ||||
| 2025-07-31 | 13F | Buckingham Strategic Partners | 35 777 | 10,69 | 2 946 | 5,44 | ||||
| 2025-05-14 | 13F | Keeley-Teton Advisors, LLC | 55 359 | −1,79 | 4 784 | 4,75 | ||||
| 2025-07-08 | 13F | Parallel Advisors, LLC | 12 | 1 | ||||||
| 2025-08-06 | 13F | Golden State Wealth Management, LLC | 365 | −33,64 | 30 | −36,17 | ||||
| 2025-08-12 | 13F | Real Talk Capital, LLC | 6 658 | −6,16 | 548 | −10,60 | ||||
| 2025-08-05 | 13F | Huntington National Bank | 87 | 244,00 | ||||||
| 2025-07-23 | 13F | Valmark Advisers, Inc. | 3 908 | 0,51 | 322 | −4,46 | ||||
| 2025-08-11 | 13F | AXS Investments LLC | 68 290 | −36,19 | 5 623 | −39,22 | ||||
| 2025-07-28 | 13F | Axxcess Wealth Management, Llc | 4 124 | −60,78 | 340 | −62,67 | ||||
| 2025-08-05 | 13F | Bank Of Montreal /can/ | 1 200 | 0,00 | 99 | −4,85 | ||||
| 2025-08-11 | 13F | Strategic Wealth Partners, Ltd. | 267 | 22 | ||||||
| 2025-08-07 | 13F | Montag A & Associates Inc | 0 | −100,00 | 0 | |||||
| 2025-05-02 | 13F | James Investment Research Inc | 0 | −100,00 | 0 | |||||
| 2025-05-06 | 13F | Ignite Planners, LLC | 0 | −100,00 | 0 | −100,00 | ||||
| 2025-07-15 | 13F | Family Wealth Partners, Llc | 3 797 | 313 | ||||||
| 2025-08-14 | 13F | Van Eck Associates Corp | 110 453 | 33,62 | 9 | 28,57 | ||||
| 2025-08-12 | 13F | Founders Financial Alliance, LLC | 0 | −100,00 | 0 | |||||
| 2025-08-13 | 13F | Cresset Asset Management, LLC | 0 | −100,00 | 0 | |||||
| 2025-07-25 | 13F | Envestnet Portfolio Solutions, Inc. | 7 221 | 13,66 | 595 | 8,20 | ||||
| 2025-07-14 | 13F | UMA Financial Services, Inc. | 239 | 0,84 | 20 | −5,00 | ||||
| 2025-05-07 | 13F | Vista Private Wealth Partners. LLC | 0 | −100,00 | 0 | |||||
| 2025-08-13 | 13F | Russell Investments Group, Ltd. | 17 | 0,00 | 1 | 0,00 | ||||
| 2025-08-04 | 13F | JDM Financial Group LLC | 12 | 1 | ||||||
| 2025-08-15 | 13F | Kestra Advisory Services, LLC | 5 756 | 113,26 | 474 | 103,00 | ||||
| 2025-08-14 | 13F | Mariner, LLC | 44 769 | 7,57 | 3 686 | 2,50 | ||||
| 2025-08-11 | 13F | Beta Wealth Group, Inc. | 7 048 | 1,66 | 580 | −3,17 | ||||
| 2025-07-30 | 13F | Castle Wealth Management Llc | 55 730 | 5,22 | 4 589 | 0,24 | ||||
| 2025-07-24 | 13F | Ronald Blue Trust, Inc. | 0 | −100,00 | 0 | |||||
| 2025-08-13 | 13F | M Holdings Securities, Inc. | 0 | −100,00 | 0 | |||||
| 2025-08-25 | NP | OIOIX - AXS Income Opportunities Fund Class I | 68 290 | −36,19 | 5 623 | −39,22 | ||||
| 2025-07-15 | 13F | McAdam, LLC | 2 933 | −0,34 | 242 | −5,12 | ||||
| 2025-07-28 | 13F | Mission Hills Financial Advisory, LLC | 25 450 | −3,48 | 2 096 | −8,03 | ||||
| 2025-07-31 | 13F | Glass Jacobson Investment Advisors llc | 0 | −100,00 | 0 | |||||
| 2025-07-28 | 13F | Harbour Investments, Inc. | 1 047 | −52,21 | 86 | −54,50 | ||||
| 2025-08-14 | 13F | Jane Street Group, Llc | Call | 3 100 | −13,89 | 255 | −18,01 | |||
| 2025-07-25 | 13F | Sovereign Financial Group, Inc. | 49 216 | 2,21 | 4 052 | −2,62 | ||||
| 2025-08-14 | 13F | Mml Investors Services, Llc | 67 076 | 48,58 | 6 | 66,67 | ||||
| 2025-06-27 | NP | TRTY - Cambria Trinity ETF | 26 094 | −3,96 | 2 180 | −2,02 | ||||
| 2025-07-17 | 13F | Janney Montgomery Scott LLC | 4 912 | 0,06 | 0 | |||||
| 2025-08-14 | 13F | McIlrath & Eck, LLC | 84 | 0,00 | 7 | −14,29 | ||||
| 2025-08-13 | 13F | Navis Wealth Advisors, LLC | 4 587 | 0,61 | 378 | −4,07 | ||||
| 2025-04-22 | 13F | Synergy Financial Management, LLC | 0 | −100,00 | 0 | |||||
| 2025-08-13 | 13F | Gamco Investors, Inc. Et Al | 50 468 | 4 156 | ||||||
| 2025-08-21 | NP | RAAX - VanEck Vectors Real Asset Allocation ETF | 111 429 | 34,29 | 9 175 | 27,96 | ||||
| 2025-08-19 | 13F | Anchor Investment Management, LLC | 20 | 0,00 | 2 | 0,00 | ||||
| 2025-08-12 | 13F | O'shaughnessy Asset Management, Llc | 236 | 23 500,00 | 19 | |||||
| 2025-08-14 | 13F | Fmr Llc | 1 530 | −18,31 | 126 | −22,36 | ||||
| 2025-05-01 | 13F | Kesler, Norman & Wride, LLC | 0 | −100,00 | 0 | |||||
| 2025-08-07 | 13F | Ascension Capital Advisors, Inc. | 94 756 | 0,59 | 7 802 | −4,15 | ||||
| 2025-05-15 | 13F | Beaumont Capital Management, LLC | 0 | −100,00 | 0 | |||||
| 2025-08-13 | 13F | Everstar Asset Management, LLC | 7 458 | 614 | ||||||
| 2025-08-06 | 13F | Commonwealth Equity Services, Llc | 31 345 | −3,83 | 3 | 0,00 | ||||
| 2025-08-12 | 13F | Proequities, Inc. | 0 | 0 | ||||||
| 2025-07-25 | 13F | LRI Investments, LLC | 7 | 0,00 | 1 | |||||
| 2025-08-07 | 13F | Allworth Financial LP | 248 | 0,00 | 20 | 0,00 | ||||
| 2025-08-14 | 13F | Ausdal Financial Partners, Inc. | 2 545 | 210 | ||||||
| 2025-08-01 | 13F | Envestnet Asset Management Inc | 85 460 | 1,79 | 7 037 | −3,02 | ||||
| 2025-08-14 | 13F | TT Capital Management LLC | 8 968 | 738 | ||||||
| 2025-07-14 | 13F | Lederer & Associates Investment Counsel/ca | 2 375 | 0,00 | 0 | |||||
| 2025-08-14 | 13F | Citadel Advisors Llc | 47 286 | 85,13 | 3 894 | 76,39 | ||||
| 2025-08-14 | 13F | Citadel Advisors Llc | Put | 3 900 | −33,90 | 321 | −36,94 | |||
| 2025-08-14 | 13F | UBS Group AG | 33 824 | −3,97 | 2 785 | −8,48 | ||||
| 2025-05-12 | 13F | Aveo Capital Partners, LLC | 0 | −100,00 | 0 | |||||
| 2025-05-15 | 13F | Schonfeld Strategic Advisors LLC | 0 | −100,00 | 0 | |||||
| 2025-08-12 | 13F | Fairscale Capital, LLC | 339 | 0,00 | 27 | −6,90 | ||||
| 2025-08-06 | 13F | AE Wealth Management LLC | 14 740 | −5,72 | 1 214 | −10,21 | ||||
| 2025-08-14 | 13F | Wells Fargo & Company/mn | 40 556 | −36,63 | 3 339 | −39,62 | ||||
| 2025-08-14 | 13F | Menora Mivtachim Holdings Ltd. | 8 500 | 0,00 | 700 | −4,77 | ||||
| 2025-07-24 | 13F | Blair William & Co/il | 180 | 15 | ||||||
| 2025-08-14 | 13F | Ameriprise Financial Inc | 154 487 | −3,75 | 12 721 | −8,30 | ||||
| 2025-08-15 | 13F | Morgan Stanley | 529 067 | 12,97 | 43 563 | 7,64 | ||||
| 2025-07-02 | 13F | Central Pacific Bank - Trust Division | 29 | 0,00 | 2 | 0,00 | ||||
| 2025-07-31 | 13F | Oppenheimer & Co Inc | 0 | −100,00 | 0 | |||||
| 2025-05-16 | 13F | Prostatis Group LLC | 0 | −100,00 | 0 | −100,00 | ||||
| 2025-08-11 | 13F | Anderson Financial Strategies, LLC | 18 021 | −0,77 | 1 484 | −5,42 | ||||
| 2025-05-15 | 13F/A | Orion Portfolio Solutions, LLC | 6 903 | −2,13 | 597 | 4,38 | ||||
| 2025-08-12 | 13F | MAI Capital Management | 535 | 0,00 | 44 | −4,35 | ||||
| 2025-07-25 | 13F | Atria Wealth Solutions, Inc. | 7 173 | −39,59 | 595 | −42,01 | ||||
| 2025-09-04 | 13F/A | Advisor Group Holdings, Inc. | 121 617 | 30,55 | 10 018 | 24,39 | ||||
| 2025-07-21 | 13F | Ameritas Advisory Services, LLC | 2 943 | −7,57 | 242 | −12,00 | ||||
| 2025-07-21 | 13F | Ameriflex Group, Inc. | 111 | 0,91 | 9 | 0,00 | ||||
| 2025-07-22 | 13F | Inlight Wealth Management, LLC | 200 | 0,00 | 16 | −5,88 | ||||
| 2025-08-05 | 13F | Prosperity Wealth Management, Inc. | 2 715 | 4,87 | 224 | 0,00 | ||||
| 2025-08-08 | 13F | Pnc Financial Services Group, Inc. | 75 | 6 | ||||||
| 2025-05-05 | 13F | Transce3nd, LLC | 0 | −100,00 | 0 | |||||
| 2025-08-12 | 13F | CIBC Private Wealth Group, LLC | 66 | 0,00 | 5 | 0,00 | ||||
| 2025-07-17 | 13F | Sound Income Strategies, LLC | 2 489 | −12,67 | 205 | −17,07 | ||||
| 2025-08-13 | 13F/A | Claudia M.p. Batlle, Crp (r) Llc | 2 635 | −8,98 | 217 | −13,60 | ||||
| 2025-08-11 | 13F | HighTower Advisors, LLC | 8 023 | −73,55 | 661 | −74,82 | ||||
| 2025-08-13 | 13F | Tobias Financial Advisors, Inc. | 179 376 | −42,59 | 14 770 | −45,30 | ||||
| 2025-08-11 | 13F | Principal Securities, Inc. | 162 | −52,21 | 13 | −51,85 | ||||
| 2025-08-13 | 13F | Cambria Investment Management, L.P. | 0 | −100,00 | 0 | |||||
| 2025-08-14 | 13F | Comerica Bank | 1 518 | −2,82 | 125 | −7,46 | ||||
| 2025-08-07 | 13F | Proficio Capital Partners LLC | 2 670 | 0,00 | 220 | −4,78 | ||||
| 2025-08-05 | 13F | Dunhill Financial, LLC | 37 | 3 | ||||||
| 2025-08-14 | 13F | Peapack Gladstone Financial Corp | 5 000 | 0,00 | 0 | |||||
| 2025-07-09 | 13F | High Probability Advisors, LLC | 22 973 | 0,16 | 1 892 | −4,59 | ||||
| 2025-08-13 | 13F | Jones Financial Companies Lllp | 5 826 | 18,61 | 476 | 13,06 | ||||
| 2025-07-24 | 13F | IFP Advisors, Inc | 36 | 3 | ||||||
| 2025-07-21 | 13F | DHJJ Financial Advisors, Ltd. | 2 047 | 0,00 | 169 | −4,55 | ||||
| 2025-04-21 | 13F | Nelson, Van Denburg & Campbell Wealth Management Group, LLC | 0 | −100,00 | 0 | |||||
| 2025-08-13 | 13F | Continuum Advisory, LLC | 25 436 | 1,39 | 2 094 | −3,41 | ||||
| 2025-08-13 | 13F | Plan Group Financial, LLC | 66 102 | −5,79 | 5 443 | −10,24 | ||||
| 2025-08-05 | 13F | Key FInancial Inc | 0 | −100,00 | 0 | |||||
| 2025-07-16 | 13F | Arkansas Financial Group, Inc. | 31 310 | 8,39 | 2 577 | 13,37 | ||||
| 2025-08-27 | 13F/A | Brinker Capital Investments, LLC | 6 480 | −6,13 | 534 | −10,57 | ||||
| 2025-08-19 | 13F | Cape Investment Advisory, Inc. | 114 | 0,88 | 9 | 0,00 | ||||
| 2025-07-16 | 13F/A | CX Institutional | 8 019 | −45,85 | 1 | −100,00 | ||||
| 2025-07-28 | 13F | Copia Wealth Management | 0 | −100,00 | 0 | |||||
| 2025-08-14 | 13F | Wiley Bros.-aintree Capital, Llc | 3 453 | 0,12 | 284 | −4,05 | ||||
| 2025-08-04 | 13F | Beirne Wealth Consulting Services, LLC | 0 | −100,00 | 0 | |||||
| 2025-07-25 | 13F | Franklin, Parlapiano, Turner & Welch, LLC | 474 807 | 0,64 | 39 096 | −4,12 | ||||
| 2025-04-23 | 13F | Crewe Advisors LLC | 0 | −100,00 | 0 | |||||
| 2025-08-14 | 13F | Connecticut Wealth Management, LLC | 5 750 | 0,00 | 473 | −4,64 | ||||
| 2025-03-17 | 13F/A | Wealth Enhancement Advisory Services, Llc | 0 | −100,00 | 0 | |||||
| 2025-07-09 | 13F | Procyon Private Wealth Partners, LLC | 42 083 | −7,19 | 3 465 | −11,56 | ||||
| 2025-08-26 | 13F/A | Thrivent Financial For Lutherans | 12 658 | 0,97 | 1 | 0,00 | ||||
| 2025-08-13 | 13F | Northwestern Mutual Wealth Management Co | 293 202 | 22,89 | 24 142 | 17,09 | ||||
| 2025-08-14 | 13F | GWM Advisors LLC | 0 | −100,00 | 0 | |||||
| 2025-07-10 | 13F | American Financial Advisors, LLC | 6 724 | 0,24 | 554 | −4,49 | ||||
| 2025-07-25 | 13F | Courage Miller Partners, LLC | 6 383 | 0,00 | 526 | −4,72 | ||||
| 2025-07-16 | 13F | Kendall Capital Management | 10 683 | 3,82 | 880 | −1,12 | ||||
| 2025-07-29 | 13F | Interactive Financial Advisors | 7 839 | 1,67 | 646 | −3,15 | ||||
| 2025-08-14 | 13F | Jane Street Group, Llc | 0 | −100,00 | 0 | |||||
| 2025-05-13 | 13F | Hanlon Investment Management, Inc. | 0 | −100,00 | 0 | |||||
| 2025-08-12 | 13F | Landing Point Financial Group, LLC | 0 | −100,00 | 0 | |||||
| 2025-08-12 | 13F | Jpmorgan Chase & Co | 2 493 | −32,38 | 205 | −35,53 | ||||
| 2025-08-12 | 13F | Global Retirement Partners, LLC | 14 264 | −5,33 | 1 175 | −3,77 | ||||
| 2025-08-12 | 13F | LPL Financial LLC | 119 020 | 21,55 | 9 800 | 15,83 | ||||
| 2025-08-04 | 13F | Creative Financial Designs Inc /adv | 12 454 | 19,33 | 1 025 | 13,76 | ||||
| 2025-07-30 | 13F | Pacific Sun Financial Corp | 23 864 | −2,35 | 1 965 | −7,01 | ||||
| 2025-08-11 | 13F | Cornerstone Planning Group LLC | 167 757 | 10,79 | 13 857 | 10,89 | ||||
| 2025-05-15 | 13F | Advisory Services Network, LLC | 0 | −100,00 | 0 | |||||
| 2025-08-14 | 13F | Colony Group, LLC | 31 922 | 1,26 | 2 628 | −3,52 | ||||
| 2025-06-27 | NP | GMOM - Cambria Global Momentum ETF | 74 764 | −3,49 | 6 247 | −1,54 | ||||
| 2025-08-13 | 13F | Brown Advisory Inc | 11 249 | −3,51 | 926 | −8,04 | ||||
| 2025-08-14 | 13F | Bank Of America Corp /de/ | 73 113 | 27,13 | 6 020 | 21,13 | ||||
| 2025-08-08 | 13F | Cetera Investment Advisers | 37 573 | 8,84 | 3 094 | 3,69 | ||||
| 2025-08-14 | 13F | Raymond James Financial Inc | 24 744 | 6,96 | 2 037 | 1,90 | ||||
| 2025-05-15 | 13F | Mercer Global Advisors Inc /adv | 0 | −100,00 | 0 | |||||
| 2025-08-11 | 13F | M Wealth Management, LLC | 13 672 | 1,28 | 1 126 | −3,52 | ||||
| 2025-08-13 | 13F | Barclays Plc | 0 | −100,00 | 0 | |||||
| 2025-05-08 | NP | QALTX - Quantified Alternative Investment Fund Investor Class Shares | 152 | −93,79 | 13 | −94,01 | ||||
| 2025-07-14 | 13F | Painted Porch Advisors LLC | 0 | −100,00 | 0 | −100,00 | ||||
| 2025-07-31 | 13F | Leavell Investment Management, Inc. | 12 384 | 96,98 | 1 020 | 87,66 | ||||
| 2025-07-07 | 13F | Investors Research Corp | 56 | 0,00 | 5 | 0,00 | ||||
| 2025-07-15 | 13F | RVW Wealth, LLC | 3 942 | 3,09 | 325 | −1,82 | ||||
| 2025-07-15 | 13F | Main Street Group, LTD | 1 020 | 48,26 | 84 | 40,68 | ||||
| 2025-08-11 | 13F | Shufro Rose & Co Llc | 3 000 | 0,00 | 259 | 0,00 | ||||
| 2025-05-13 | 13F | Hartland & Co., LLC | 0 | −100,00 | 0 | |||||
| 2025-08-14 | 13F | Citadel Advisors Llc | Call | 0 | −100,00 | 0 | ||||
| 2025-08-13 | 13F | Marshall Wace, Llp | 0 | −100,00 | 0 | |||||
| 2025-08-14 | 13F | Aprio Wealth Management, LLC | 253 861 | −15,59 | 20 903 | −19,58 | ||||
| 2025-08-08 | 13F | Avantax Advisory Services, Inc. | 9 312 | 52,61 | 767 | 45,35 | ||||
| 2025-08-14 | 13F | Qube Research & Technologies Ltd | 13 731 | 3,13 | 1 131 | −1,74 | ||||
| 2025-04-24 | 13F | Wingate Wealth Advisors, Inc. | 0 | −100,00 | 0 | |||||
| 2025-08-14 | 13F | Partners Capital Investment Group, Llp | 28 990 | −50,00 | 2 387 | −52,36 | ||||
| 2025-07-15 | 13F/A | Kure Advisory, LLC | 38 515 | 10,08 | 3 171 | 4,90 | ||||
| 2025-07-14 | 13F | Park Avenue Securities Llc | 2 712 | 0 | ||||||
| 2025-08-04 | 13F | Integrity Alliance, Llc. | 0 | −100,00 | 0 | |||||
| 2025-08-05 | 13F | Advisors Preferred, LLC | 0 | −100,00 | 0 | |||||
| 2025-07-14 | 13F | Kfg Wealth Management, Llc | 18 695 | −19,75 | 1 539 | −23,55 | ||||
| 2025-08-06 | 13F | Legacy Investment Solutions, LLC | 21 | 0,00 | 2 | 0,00 | ||||
| 2025-05-13 | 13F | GKV Capital Management Co., Inc. | 2 430 | 210 | ||||||
| 2025-05-08 | 13F | Us Bancorp \de\ | 0 | −100,00 | 0 | |||||
| 2025-08-18 | 13F | Geneos Wealth Management Inc. | 100 | 0,00 | 8 | 0,00 | ||||
| 2025-07-07 | 13F | Capital Asset Advisory Services LLC | 11 985 | −34,78 | 989 | −37,70 | ||||
| 2025-07-25 | 13F | Cwm, Llc | 19 | 35,71 | 0 | |||||
| 2025-08-07 | 13F | Fonville Wealth Management LLC | 51 136 | 2,30 | 4 210 | 0,24 | ||||
| 2025-08-14 | 13F | Napa Wealth Management | 5 523 | −0,84 | 455 | −5,61 | ||||
| 2025-08-18 | 13F/A | National Bank Of Canada /fi/ | 704 | −9,16 | 58 | −13,64 | ||||
| 2025-08-12 | 13F | Steward Partners Investment Advisory, Llc | 938 | 89,11 | 77 | 83,33 | ||||
| 2025-05-14 | 13F | Colonial Trust Co / SC | 0 | −100,00 | 0 | |||||
| 2025-08-05 | 13F | Simplex Trading, Llc | 218 | 0 | ||||||
| 2025-08-05 | 13F | Bard Associates Inc | 7 792 | 5,43 | 642 | 0,47 | ||||
| 2025-08-13 | 13F | Rsm Us Wealth Management Llc | 2 545 | −16,17 | 210 | −20,23 | ||||
| 2025-05-05 | 13F | Csenge Advisory Group | 0 | −100,00 | 0 | −100,00 | ||||
| 2025-07-31 | 13F | Cornerstone Management, Inc. | 19 821 | 0,00 | 1 632 | −4,67 | ||||
| 2025-08-11 | 13F | Comprehensive Wealth Management, LLC | 7 899 | 650 | ||||||
| 2025-07-29 | 13F | Sincerus Advisory, LLC | 13 991 | −0,66 | 1 170 | −3,94 | ||||
| 2025-08-28 | NP | BlackRock Funds V - BlackRock Inflation Protected Bond Portfolio Investor A Shares | 32 341 | 0,00 | 2 663 | −4,72 | ||||
| 2025-07-23 | 13F | H&H Retirement Design & Management INC | 14 398 | 7,01 | 1 199 | 10,41 | ||||
| 2025-08-14 | 13F | Stifel Financial Corp | 0 | −100,00 | 0 | |||||
| 2025-08-15 | 13F | Harvest Fund Management Co., Ltd | 2 334 | −47,36 | 0 | |||||
| 2025-07-30 | 13F | Whittier Trust Co Of Nevada Inc | 287 | 0,00 | 24 | −4,17 | ||||
| 2025-08-05 | 13F | Strategic Financial Concepts, LLC | 13 623 | −1,25 | 1 122 | −5,96 | ||||
| 2025-08-12 | 13F/A | Cozad Asset Management Inc | 4 808 | 0,00 | 396 | −4,82 | ||||
| 2025-08-18 | 13F | Pacific Center for Financial Services | 2 455 | 0,00 | 202 | −4,72 | ||||
| 2025-08-12 | 13F | BlackRock, Inc. | 32 341 | 0,00 | 2 663 | −4,72 | ||||
| 2025-08-14 | 13F | Susquehanna International Group, Llp | 11 477 | −51,40 | 945 | −53,68 | ||||
| 2025-07-08 | 13F | Boltwood Capital Management | 3 600 | 0,00 | 296 | −4,82 | ||||
| 2025-07-16 | 13F | Signaturefd, Llc | 0 | −100,00 | 0 | |||||
| 2025-04-30 | 13F | Consolidated Capital Management, Llc | 0 | −100,00 | 0 | |||||
| 2025-07-11 | 13F | Seacrest Wealth Management, Llc | 7 499 | 2,03 | 617 | −2,83 | ||||
| 2025-08-11 | 13F | Bellwether Advisors, LLC | 31 | 0,00 | 3 | 0,00 | ||||
| 2025-07-11 | 13F | Caldwell Securities, Inc | 0 | −100,00 | 0 | |||||
| 2025-05-06 | 13F | Atria Investments Llc | 0 | −100,00 | 0 | |||||
| 2025-08-15 | 13F | Tower Research Capital LLC (TRC) | 3 814 | −48,33 | 314 | −50,71 |