Grundläggande statistik
| Institutionella ägare | 338 total, 338 long only, 0 short only, 0 long/short - change of 1,80% MRQ |
| Genomsnittlig portföljallokering | 0.2225 % - change of −5,57% MRQ |
| Institutionella aktier (lång) | 56 789 648 (ex 13D/G) - change of 0,48MM shares 0,85% MRQ |
| Institutionellt värde (lång) | $ 975 781 USD ($1000) |
Institutionellt ägande och aktieägare
PIMCO Dynamic Income Fund (US:PDI) har 338 Institutionella ägare och aktieägare som har lämnat in 13D/G- eller 13F-formulär till Securities Exchange Commission (SEC). Dessa institut innehar totalt 56,789,648 aktier. Största aktieägare inkluderar Morgan Stanley, LPL Financial LLC, Bank Of America Corp /de/, UBS Group AG, J.w. Cole Advisors, Inc., Commonwealth Equity Services, Llc, PFG Investments, LLC, Advisor Group Holdings, Inc., Cohen & Steers, Inc., and Royal Bank Of Canada .
PIMCO Dynamic Income Fund (NYSE:PDI) Institutionell ägarstruktur visar institutioners och fonders nuvarande positioner i företaget, samt de senaste förändringarna i positionernas storlek. Större aktieägare kan vara enskilda investerare, fonder, hedgefonder eller institutioner. Bilaga 13D visar att investeraren äger (eller ägde) mer än 5% av företaget och avser (eller avsåg) att aktivt eftersträva en förändring av affärsstrategin. Schedule 13G indikerar en passiv investering på över 5%.
The share price as of September 11, 2025 is 19,98 / share. Previously, on September 12, 2024, the share price was 19,43 / share. This represents an increase of 2,83% over that period.

Fondsentimentets poäng
Fondsentimentet poängen(fka Ägarackumulation-poäng) visar vilka aktier som är mest köpta av fonder. Det är resultatet av en sofistikerad kvantitativ flerfaktormodell som identifierar företag med de högsta nivåerna av institutionell ackumulering. Poängsättningsmodellen använder en kombination av den totala ökningen av redovisade ägare, förändringarna i portföljallokeringarna för dessa ägare och andra mått. Siffran sträcker sig från 0 till 100, där högre siffror indikerar en högre nivå av ackumulering i förhållande till sina konkurrenter, och 50 är genomsnittet.
Uppdateringsfrekvens: Dagligen
Se Ownership Explorer, som innehåller en lista över de högst rankade företagen.
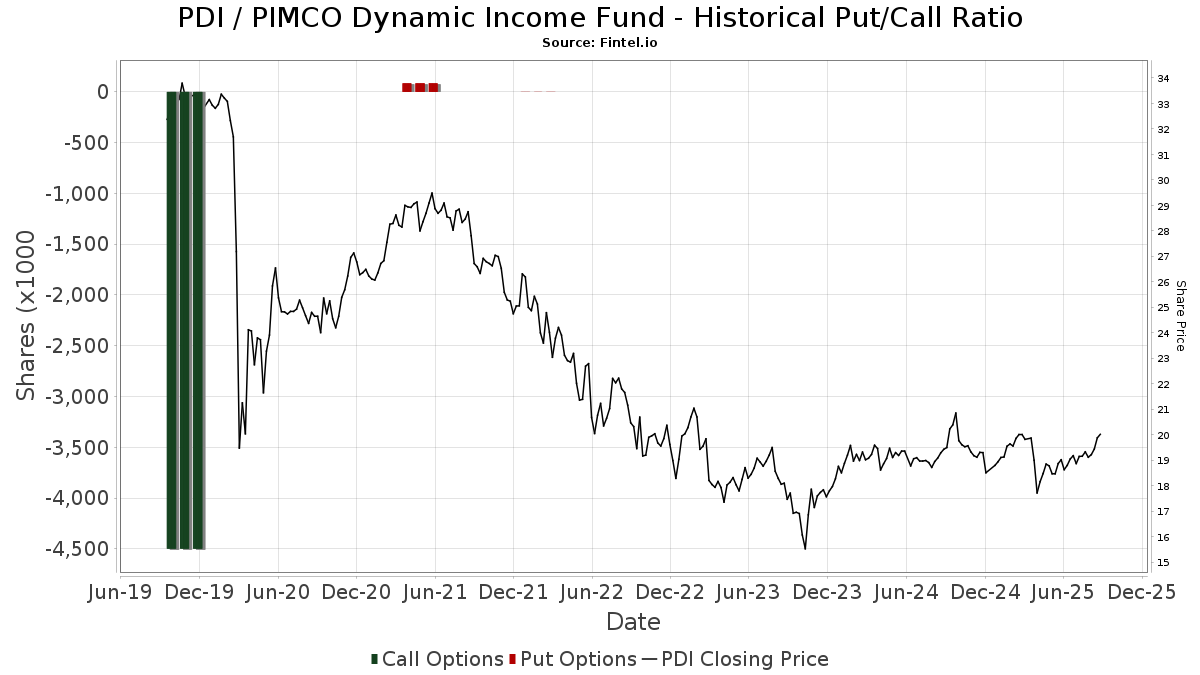
Institutionell sälj/köp-kvot
Förutom att rapportera vanliga eget kapital- och skuldemissioner måste institutioner med mer än 100MM tillgångar under förvaltning också avslöja sina innehav av sälj- och köpoptioner. Eftersom säljoptioner i allmänhet indikerar ett negativt sentiment och köpoptioner indikerar ett positivt sentiment, kan vi få en uppfattning om det övergripande institutionella sentimentet genom att plotta förhållandet mellan säljoptioner och köpoptioner. Diagrammet till höger visar det historiska förhållandet mellan sälj- och köpoptioner för detta instrument.
Genom att använda sälj/köp-kvoten som en indikator på aktieägarnas sentiment undviker man en av de största bristerna med att använda det totala institutionella ägandet, nämligen att en betydande del av de förvaltade tillgångarna investeras passivt för att följa index. Passivt förvaltade fonder köper vanligtvis inte optioner, så indikatorn för sälj/köp-kvoten ger en bättre bild av stämningen i aktivt förvaltade fonder.
13F- och NPORT-arkiveringar
Detaljer om 13F-arkiveringar är gratis. Detaljer om NP-arkiveringar kräver ett premiummedlemskap. Gröna rader indikerar nya positioner. Röda rader indikerar stängda positioner. Klicka på länk symbolen för att se hela transaktionshistoriken.
Uppgradera
för att låsa upp premiumdata och exportera till Excel ![]() .
.
| Fil Datum | Källa | Investerare | Typ | Genomsnittligt pris (beräknat) |
Aktier | Δ Aktier (%) |
Rapporterat värde (1000 USD) |
Δ Värde (%) |
Portföljallokering (%) |
|
|---|---|---|---|---|---|---|---|---|---|---|
| 2025-07-25 | 13F | Concord Wealth Partners | 10 252 | 3,66 | 194 | −0,51 | ||||
| 2025-07-29 | 13F | Beverly Hills Private Wealth, LLC | 18 099 | 0,00 | 343 | −4,19 | ||||
| 2025-08-13 | 13F | Brown Advisory Inc | 55 140 | 0,00 | 1 046 | −4,12 | ||||
| 2025-08-27 | NP | THRIVENT SERIES FUND INC - Thrivent Balanced Income Plus Portfolio Class A | 2 226 | 0,00 | 42 | −4,55 | ||||
| 2025-08-27 | NP | THRIVENT SERIES FUND INC - Thrivent Diversified Income Plus Portfolio Class A | 5 565 | 0,00 | 106 | −4,55 | ||||
| 2025-07-22 | 13F | Belpointe Asset Management LLC | 18 926 | 33,51 | 359 | 28,21 | ||||
| 2025-08-13 | 13F | Cheviot Value Management, LLC | 0 | −100,00 | 0 | |||||
| 2025-08-07 | 13F | Resources Investment Advisors, LLC. | 15 195 | −0,01 | 288 | −4,00 | ||||
| 2025-09-05 | 13F | Ghe, Llc | 17 200 | 2,69 | 326 | |||||
| 2025-07-18 | 13F | Institute for Wealth Management, LLC. | 12 205 | 0,41 | 232 | −3,75 | ||||
| 2025-07-15 | 13F | Fortitude Family Office, LLC | 0 | −100,00 | 0 | |||||
| 2025-08-07 | 13F | Allworth Financial LP | 7 258 | 1 095,72 | 138 | 1 145,45 | ||||
| 2025-07-23 | 13F | Quarry Hill Advisors, Llc | 170 657 | 3,70 | 3 237 | −0,64 | ||||
| 2025-08-08 | 13F | Accredited Investors Inc. | 20 719 | 393 | ||||||
| 2025-07-09 | 13F | Massmutual Trust Co Fsb/adv | 4 | 0,00 | 0 | |||||
| 2025-08-05 | 13F | Strategic Financial Concepts, LLC | 11 650 | 221 | ||||||
| 2025-05-07 | 13F | Bedel Financial Consulting, Inc. | 0 | −100,00 | 0 | |||||
| 2025-08-08 | 13F | Cetera Investment Advisers | 1 236 188 | 3,75 | 23 450 | −0,60 | ||||
| 2025-08-13 | 13F | Holos Integrated Wealth LLC | 62 | 6,90 | 1 | 0,00 | ||||
| 2025-08-14 | 13F | Royal Bank Of Canada | 1 281 912 | 4,17 | 24 319 | −0,19 | ||||
| 2025-08-14 | 13F | Wiley Bros.-aintree Capital, Llc | 38 430 | 729 | ||||||
| 2025-08-12 | 13F | Journey Strategic Wealth Llc | 12 326 | 234 | ||||||
| 2025-08-04 | 13F | Assetmark, Inc | 0 | −100,00 | 0 | |||||
| 2025-08-13 | 13F | Gateway Wealth Partners, LLC | 16 633 | 54,32 | 316 | 47,89 | ||||
| 2025-05-16 | 13F | Coppell Advisory Solutions LLC | 0 | −100,00 | 0 | |||||
| 2025-07-22 | 13F | Marks Group Wealth Management, Inc | 89 984 | 0,00 | 1 707 | −4,21 | ||||
| 2025-08-12 | 13F | J.w. Cole Advisors, Inc. | 1 479 459 | 3,58 | 28 065 | −0,76 | ||||
| 2025-08-18 | 13F | Geneos Wealth Management Inc. | 10 646 | −13,70 | 202 | −17,62 | ||||
| 2025-08-14 | 13F | Jane Street Group, Llc | 83 652 | 293,64 | 1 587 | 277,62 | ||||
| 2025-04-29 | 13F | Bank of New York Mellon Corp | 0 | −100,00 | 0 | −100,00 | ||||
| 2025-08-12 | 13F | Country Trust Bank | 13 277 | 8,15 | 252 | 3,29 | ||||
| 2025-07-22 | 13F | Beacon Financial Advisory LLC | 38 277 | 2,01 | 726 | −2,16 | ||||
| 2025-08-14 | 13F | Stifel Financial Corp | 155 746 | 17,91 | 2 955 | 12,96 | ||||
| 2025-08-11 | 13F | Anfield Capital Management, LLC | 3 034 | 0,00 | 58 | −5,00 | ||||
| 2025-08-14 | 13F | Williams Jones Wealth Management, LLC. | 86 628 | −1,14 | 1 643 | −5,25 | ||||
| 2025-08-14 | 13F | Federation des caisses Desjardins du Quebec | 8 404 | 0,00 | 159 | −4,22 | ||||
| 2025-08-14 | 13F | Wells Fargo & Company/mn | 988 088 | −5,71 | 18 744 | −9,66 | ||||
| 2025-07-11 | 13F | Seacrest Wealth Management, Llc | 11 446 | 0,00 | 217 | −3,98 | ||||
| 2025-08-01 | 13F | Gwn Securities Inc. | 19 468 | 369 | ||||||
| 2025-07-23 | 13F | Prime Capital Investment Advisors, LLC | 0 | −100,00 | 0 | |||||
| 2025-08-14 | 13F | Bank Of America Corp /de/ | 3 068 594 | 5,70 | 58 211 | 1,27 | ||||
| 2025-08-14 | 13F | Mercer Global Advisors Inc /adv | 352 405 | 516,16 | 6 685 | 490,55 | ||||
| 2025-08-01 | 13F | Planning Directions Inc | 0 | −100,00 | 0 | |||||
| 2025-08-04 | 13F | IFG Advisory, LLC | 119 069 | 688,75 | 2 259 | 657,72 | ||||
| 2025-05-05 | 13F | Lindbrook Capital, Llc | 3 000 | 0,00 | 59 | 7,27 | ||||
| 2025-07-22 | 13F | MAS Advisors LLC | 48 301 | 10,00 | 916 | 5,41 | ||||
| 2025-07-25 | 13F | Concord Asset Management, LLC/VA | 10 252 | 194 | ||||||
| 2025-06-12 | 13F/A | Deutsche Bank Ag\ | 0 | −100,00 | 0 | |||||
| 2025-08-05 | 13F | Verity Asset Management, Inc. | 35 735 | −28,84 | 678 | −31,89 | ||||
| 2025-07-16 | 13F | St Germain D J Co Inc | 3 615 | 49,44 | 69 | 44,68 | ||||
| 2025-07-22 | 13F | Valeo Financial Advisors, LLC | 28 870 | −18,71 | 548 | −22,19 | ||||
| 2025-07-10 | 13F | Focus Financial Network, Inc. | 85 586 | 11,77 | 1 642 | 7,11 | ||||
| 2025-08-04 | 13F | Arkadios Wealth Advisors | 11 427 | 5,10 | 217 | 0,47 | ||||
| 2025-07-17 | 13F | Venture Visionary Partners LLC | 97 195 | 2,73 | 1 844 | −1,60 | ||||
| 2025-05-08 | 13F | Essential Planning, LLC. | 0 | −100,00 | 0 | |||||
| 2025-08-04 | 13F | Pensionmark Financial Group, Llc | 97 249 | −67,59 | 1 845 | −68,96 | ||||
| 2025-07-15 | 13F | Evanson Asset Management, LLC | 12 767 | 242 | ||||||
| 2025-07-31 | 13F | Optimum Investment Advisors | 18 600 | 0,00 | 353 | −4,35 | ||||
| 2025-08-19 | 13F | Newbridge Financial Services Group, Inc. | 37 618 | 714 | ||||||
| 2025-07-08 | 13F | Dover Advisors, Llc | 0 | −100,00 | 0 | |||||
| 2025-08-13 | 13F | Cerity Partners LLC | 39 610 | 751 | ||||||
| 2025-08-12 | 13F | BlackRock, Inc. | 20 469 | 20,57 | 388 | 15,48 | ||||
| 2025-08-12 | 13F | Jaffetilchin Investment Partners, LLC | 0 | −100,00 | 0 | |||||
| 2025-08-13 | 13F | Baird Financial Group, Inc. | 198 734 | 3,56 | 3 770 | −0,79 | ||||
| 2025-08-12 | 13F | AlphaCore Capital LLC | 24 602 | −9,21 | 472 | −12,92 | ||||
| 2025-07-31 | 13F | Anchor Capital Management Group Inc | 124 300 | 0,00 | 2 358 | −4,23 | ||||
| 2025-08-14 | 13F | LaSalle St. Investment Advisors, LLC | 44 457 | 0,24 | 1 | |||||
| 2025-08-28 | NP | FFBYX - First Foundation Fixed Income Fund Class Y | 10 000 | 0,00 | 190 | −4,55 | ||||
| 2025-08-14 | 13F | Balyasny Asset Management Llc | 12 658 | 240 | ||||||
| 2025-08-13 | 13F | Summit Financial, LLC | 435 437 | 7,29 | 8 356 | 3,98 | ||||
| 2025-07-31 | 13F/A | Avion Wealth | 259 | 3,60 | 0 | |||||
| 2025-08-11 | 13F | United Advisor Group, LLC | 16 325 | 5,62 | 310 | 0,98 | ||||
| 2025-07-25 | 13F | LRI Investments, LLC | 888 | 0,00 | 17 | −5,88 | ||||
| 2025-08-14 | 13F | First Foundation Advisors | 45 965 | 0,00 | 872 | −4,29 | ||||
| 2025-08-08 | 13F | Pnc Financial Services Group, Inc. | 77 564 | 121,21 | 1 471 | 111,96 | ||||
| 2025-08-06 | 13F | Tradewinds, LLC. | 15 839 | 300 | ||||||
| 2025-08-15 | 13F | CI Private Wealth, LLC | 12 064 | −5,07 | 229 | −8,76 | ||||
| 2025-08-05 | 13F | Prosperity Wealth Management, Inc. | 17 301 | 12,75 | 328 | 8,25 | ||||
| 2025-05-06 | 13F | Readystate Asset Management Lp | 0 | −100,00 | 0 | |||||
| 2025-07-28 | 13F | Eq Wealth Advisors, Llc | 1 | −99,95 | 0 | −100,00 | ||||
| 2025-08-08 | 13F | Kaizen Financial Strategies | 34 477 | 6,58 | 654 | 2,19 | ||||
| 2025-08-13 | 13F | Lido Advisors, LLC | 42 182 | −70,42 | 809 | −71,47 | ||||
| 2025-08-28 | NP | Cohen & Steers Closed-end Opportunity Fund, Inc. | 557 073 | 10,84 | 10 568 | 6,19 | ||||
| 2025-08-15 | 13F | Captrust Financial Advisors | 94 723 | −24,75 | 1 797 | −27,93 | ||||
| 2025-07-16 | 13F | Moisand Fitzgerald Tamayo, LLC | 1 840 | 0,00 | 35 | −5,56 | ||||
| 2025-08-05 | 13F | Sigma Planning Corp | 30 524 | −9,02 | 579 | −12,80 | ||||
| 2025-08-06 | 13F | Savant Capital, LLC | 48 198 | −2,24 | 914 | −6,35 | ||||
| 2025-07-24 | 13F | Ronald Blue Trust, Inc. | 1 135 | 3,75 | 22 | 0,00 | ||||
| 2025-07-28 | 13F | Axxcess Wealth Management, Llc | 16 340 | −11,72 | 310 | −15,57 | ||||
| 2025-08-14 | 13F | Garden State Investment Advisory Services LLC | 45 840 | 0,00 | 870 | −4,19 | ||||
| 2025-08-15 | 13F | Equitable Holdings, Inc. | 134 833 | 23,48 | 2 558 | 18,27 | ||||
| 2025-07-14 | 13F | U.S. Capital Wealth Advisors, LLC | 148 007 | 0,68 | 2 808 | −3,54 | ||||
| 2025-08-11 | 13F | NewEdge Wealth, LLC | 37 658 | 3,39 | 727 | 0,69 | ||||
| 2025-08-14 | 13F | CIBC World Markets Inc. | 78 133 | −1,57 | 1 482 | −5,67 | ||||
| 2025-08-07 | 13F | PFG Advisors | 159 182 | −13,93 | 3 020 | −17,54 | ||||
| 2025-08-14 | 13F | Cura Wealth Advisors, Llc | 35 406 | 18,22 | 672 | 13,15 | ||||
| 2025-08-12 | 13F | Jpmorgan Chase & Co | 648 | 12 | ||||||
| 2025-07-21 | 13F | Ameritas Advisory Services, LLC | 11 806 | −42,08 | 224 | −40,37 | ||||
| 2025-07-10 | 13F | Wealth Enhancement Advisory Services, Llc | 133 891 | −9,80 | 2 559 | −12,93 | ||||
| 2025-07-30 | 13F | Cornerstone Advisory, LLC | 680 209 | 0,63 | 12 904 | 1,76 | ||||
| 2025-08-15 | 13F | Lantern Wealth Advisors, LLC | 11 688 | 222 | ||||||
| 2025-08-13 | 13F | Allium Financial Advisors, Llc | 111 311 | 375,26 | 2 112 | 355,94 | ||||
| 2025-04-14 | 13F | Strategic Wealth Designers | 0 | −100,00 | 0 | −100,00 | ||||
| 2025-08-12 | 13F | Cornerstone Wealth Management, LLC | 25 829 | −5,64 | 490 | −9,78 | ||||
| 2025-08-13 | 13F | Beacon Pointe Advisors, LLC | 12 832 | 0,30 | 243 | −3,95 | ||||
| 2025-07-22 | 13F | SOL Capital Management CO | 759 321 | −2,03 | 14 | −6,67 | ||||
| 2025-07-31 | 13F | Oppenheimer & Co Inc | 80 639 | 30,98 | 1 530 | 25,43 | ||||
| 2025-07-31 | 13F | Buckingham Strategic Partners | 31 769 | 603 | ||||||
| 2025-08-04 | 13F | Kovack Advisors, Inc. | 43 072 | 35,11 | 817 | 29,48 | ||||
| 2025-05-12 | 13F | Benjamin Edwards Inc | 0 | −100,00 | 0 | |||||
| 2025-07-30 | 13F | D.a. Davidson & Co. | 22 932 | −5,09 | 435 | −9,00 | ||||
| 2025-07-31 | 13F | Cambridge Investment Research Advisors, Inc. | 982 091 | 16,16 | 19 | 12,50 | ||||
| 2025-08-11 | 13F | Pin Oak Investment Advisors Inc | 304 | 0 | ||||||
| 2025-08-14 | 13F | Icon Wealth Advisors, LLC | 10 323 | 0,00 | 196 | −4,41 | ||||
| 2025-08-27 | NP | AAHYX - Thrivent Diversified Income Plus Fund Class A | 8 874 | 0,00 | 168 | −4,00 | ||||
| 2025-08-06 | 13F | Bensler, LLC | 232 340 | 13,28 | 4 407 | 8,52 | ||||
| 2025-08-08 | 13F | Creative Planning | 29 879 | −1,31 | 567 | −5,51 | ||||
| 2025-07-17 | 13F | Sonora Investment Management Group, LLC | 10 531 | 0,23 | 200 | −4,33 | ||||
| 2025-08-15 | 13F | WFA of San Diego, LLC | 3 376 | 3,15 | 64 | −3,03 | ||||
| 2025-08-08 | 13F | Kingsview Wealth Management, LLC | 13 978 | −16,17 | 265 | −19,70 | ||||
| 2025-03-12 | 13F/A | Palogic Value Management, L.P. | 0 | −100,00 | 0 | −100,00 | ||||
| 2025-07-23 | 13F | Elm3 Financial Group, LLC | 84 325 | 10,40 | 1 600 | 5,75 | ||||
| 2025-06-26 | NP | AAINX - Thrivent Opportunity Income Plus Fund Class A | 23 302 | 0,00 | 431 | −4,44 | ||||
| 2025-07-10 | 13F | Sovran Advisors, LLC | 81 806 | 46,44 | 1 566 | 56,81 | ||||
| 2025-07-30 | 13F | Drive Wealth Management, Llc | 136 010 | 10,70 | 2 609 | 6,10 | ||||
| 2025-04-30 | 13F | Ramiah Investment Group | 27 092 | 0,61 | 536 | 10,97 | ||||
| 2025-07-22 | 13F | Inlight Wealth Management, LLC | 450 | 0,00 | 9 | 0,00 | ||||
| 2025-08-08 | 13F | CFO4Life Group, LLC | 19 632 | 7,09 | 372 | 2,76 | ||||
| 2025-07-29 | 13F | Signature Estate & Investment Advisors Llc | 28 976 | 550 | ||||||
| 2025-08-12 | 13F | Insigneo Advisory Services, Llc | 27 648 | 45,38 | 524 | 39,36 | ||||
| 2025-08-07 | 13F | Americana Partners, LLC | 70 375 | 16,37 | 1 335 | 11,53 | ||||
| 2025-08-08 | 13F | Summitry Llc | 12 000 | 0,00 | 228 | −4,22 | ||||
| 2025-07-17 | 13F | City Holding Co | 25 | 0,00 | 0 | |||||
| 2025-08-05 | 13F | GPS Wealth Strategies Group, LLC | 9 267 | 0,00 | 176 | −4,37 | ||||
| 2025-07-01 | 13F | Harbor Investment Advisory, Llc | 52 134 | 11,32 | 989 | 6,58 | ||||
| 2025-08-04 | 13F | L.m. Kohn & Company | 11 785 | 0,00 | 224 | −4,29 | ||||
| 2025-08-04 | 13F | Bay Colony Advisory Group, Inc d/b/a Bay Colony Advisors | 151 432 | −8,85 | 2 873 | −12,41 | ||||
| 2025-08-07 | 13F | Kestra Private Wealth Services, Llc | 15 046 | 33,08 | 285 | 27,80 | ||||
| 2025-08-12 | 13F | LPL Financial LLC | 4 178 529 | 19,31 | 79 267 | 14,30 | ||||
| 2025-08-27 | 13F/A | Brinker Capital Investments, LLC | 225 065 | 5,48 | 4 269 | 1,07 | ||||
| 2025-07-22 | 13F/A | Kingstone Capital Partners Texas, LLC | 12 750 | 13,71 | 242 | 9,01 | ||||
| 2025-08-14 | 13F | Snowden Capital Advisors LLC | 13 471 | 0,48 | 259 | −3,73 | ||||
| 2025-08-14 | 13F | Mariner, LLC | 44 983 | 136,89 | 853 | 127,47 | ||||
| 2025-08-05 | 13F | Dunhill Financial, LLC | 510 | 10 | ||||||
| 2025-07-25 | 13F | Almanack Investment Partners, LLC. | 13 355 | 0,00 | 253 | −4,17 | ||||
| 2025-07-29 | 13F | Stratos Wealth Partners, LTD. | 95 326 | 133,85 | 1 808 | 124,04 | ||||
| 2025-07-15 | 13F | Financial Management Professionals, Inc. | 461 | 7,21 | 9 | 0,00 | ||||
| 2025-08-12 | 13F | PSI Advisors, LLC | 0 | −100,00 | 0 | |||||
| 2025-07-15 | 13F | Oxinas Partners Wealth Management LLC | 11 846 | 225 | ||||||
| 2025-08-12 | 13F | Change Path, LLC | 14 944 | 7,46 | 283 | 2,91 | ||||
| 2025-08-05 | 13F | Bank Of Montreal /can/ | 183 471 | 6,89 | 3 480 | 2,41 | ||||
| 2025-08-14 | 13F | SWAN Capital LLC | 0 | −100,00 | 0 | |||||
| 2025-08-14 | 13F | Bnp Paribas Arbitrage, Sa | 1 | −99,99 | 0 | −100,00 | ||||
| 2025-08-14 | 13F | TCG Advisory Services, LLC | 45 882 | 5,27 | 870 | 0,93 | ||||
| 2025-08-12 | 13F | CIBC Private Wealth Group, LLC | 14 260 | −10,40 | 271 | −4,59 | ||||
| 2025-08-14 | 13F | Banque Transatlantique SA | 0 | −100,00 | 0 | |||||
| 2025-08-19 | 13F | Advisory Services Network, LLC | 12 350 | 3,67 | 237 | 0,85 | ||||
| 2025-07-18 | 13F | PFG Investments, LLC | 1 382 522 | 5,20 | 26 226 | 0,79 | ||||
| 2025-08-06 | 13F | Prospera Financial Services Inc | 38 042 | 9,78 | 722 | 5,10 | ||||
| 2025-07-22 | 13F | Olistico Wealth, LLC | 3 450 | 65 | ||||||
| 2025-08-11 | 13F | United Capital Financial Advisers, Llc | 0 | −100,00 | 0 | |||||
| 2025-07-15 | 13F | BCS Wealth Management | 13 904 | 0,00 | 0 | |||||
| 2025-07-16 | 13F | Owen LaRue, LLC | 27 572 | −55,17 | 523 | −57,03 | ||||
| 2025-07-28 | 13F | Harbour Investments, Inc. | 6 778 | −4,08 | 129 | −7,91 | ||||
| 2025-07-17 | 13F/A | Capital Investment Advisors, LLC | 11 879 | 0,00 | 225 | −4,26 | ||||
| 2025-07-29 | 13F | Koshinski Asset Management, Inc. | 22 867 | −0,67 | 434 | −4,84 | ||||
| 2025-08-14 | 13F | Harwood Advisory Group, LLC | 184 | 0,00 | 3 | 0,00 | ||||
| 2025-08-13 | 13F | Jones Financial Companies Lllp | 1 738 | 33 | ||||||
| 2025-08-01 | 13F | MorganRosel Wealth Management, LLC | 118 249 | −3,87 | 2 243 | −7,89 | ||||
| 2025-05-07 | 13F | Spectrum Wealth Counsel, LLC | 300 | 0,00 | 6 | 0,00 | ||||
| 2025-07-18 | 13F | Truist Financial Corp | 55 564 | 25,80 | 1 054 | 20,59 | ||||
| 2025-05-15 | 13F | Talon Private Wealth, LLC | 0 | −100,00 | 0 | −100,00 | ||||
| 2025-08-14 | 13F | IHT Wealth Management, LLC | 10 764 | 204 | ||||||
| 2025-07-09 | 13F | Key Client Fiduciary Advisors, LLC | 36 537 | 12,80 | 693 | 8,11 | ||||
| 2025-07-21 | 13F | Patriot Financial Group Insurance Agency, LLC | 14 108 | −1,37 | 268 | −5,65 | ||||
| 2025-08-04 | 13F | Syverson Strege & Co | 12 891 | 3,09 | 245 | −1,21 | ||||
| 2025-08-14 | 13F | Diversify Wealth Management, Llc | 32 935 | 7,78 | 628 | 11,55 | ||||
| 2025-08-14 | 13F | Visionary Wealth Advisors | 11 840 | 2,15 | 225 | −2,18 | ||||
| 2025-08-12 | 13F | Global Retirement Partners, LLC | 18 556 | 8,72 | 352 | 12,46 | ||||
| 2025-08-06 | 13F | Mark Sheptoff Financial Planning, Llc | 300 | 6 | ||||||
| 2025-08-06 | 13F | Wedbush Securities Inc | 76 551 | 6,58 | 1 | 0,00 | ||||
| 2025-07-22 | 13F/A | Duncan Williams Asset Management, LLC | 99 901 | 1,78 | 1 895 | −2,47 | ||||
| 2025-06-26 | NP | AABFX - Thrivent Balanced Income Plus Fund Class A | 2 292 | 0,00 | 42 | −4,55 | ||||
| 2025-08-04 | 13F | Spire Wealth Management | 16 189 | −14,53 | 307 | −18,13 | ||||
| 2025-03-31 | NP | CVY - Invesco Zacks Multi-Asset Income ETF This fund is a listed as child fund of Invesco Ltd. and if that institution has disclosed ownership in this security, then these positions will not be double counted when calculating total shares and total value | 0 | −100,00 | 0 | −100,00 | ||||
| 2025-08-05 | 13F | Mathes Company, Inc. | 18 474 | −10,17 | 0 | |||||
| 2025-08-12 | 13F | Horizon Kinetics Asset Management Llc | 85 863 | −0,60 | 1 629 | −4,80 | ||||
| 2025-08-14 | 13F | Alliancebernstein L.p. | 437 011 | −1,11 | 8 290 | −5,26 | ||||
| 2025-07-15 | 13F | Fifth Third Bancorp | 175 | 0,00 | 3 | 0,00 | ||||
| 2025-07-25 | 13F | Atria Wealth Solutions, Inc. | 78 400 | −94,83 | 1 503 | −95,00 | ||||
| 2025-08-27 | NP | THRIVENT SERIES FUND INC - Thrivent Opportunity Income Plus Portfolio Class A | 5 770 | 0,00 | 109 | −4,39 | ||||
| 2025-08-12 | 13F | MAI Capital Management | 66 617 | 4,93 | 1 264 | 0,48 | ||||
| 2025-07-24 | 13F | Eastern Bank | 0 | −100,00 | 0 | −100,00 | ||||
| 2025-08-14 | 13F | Fortress Private Ledger, Llc | 0 | −100,00 | 0 | |||||
| 2025-04-30 | 13F | Consolidated Capital Management, Llc | 0 | −100,00 | 0 | |||||
| 2025-07-18 | 13F | TPG Advisors LLC | 10 840 | −5,53 | 206 | −9,69 | ||||
| 2025-05-12 | 13F | Fmr Llc | 0 | −100,00 | 0 | |||||
| 2025-05-02 | 13F | Cullen/frost Bankers, Inc. | 0 | −100,00 | 0 | |||||
| 2025-07-22 | 13F | Wealthcare Advisory Partners LLC | 399 155 | 10,01 | 7 572 | 5,39 | ||||
| 2025-08-04 | 13F | Merkkuri Wealth Advisors LLC | 15 839 | −45,61 | 300 | −47,92 | ||||
| 2025-05-14 | 13F | Landscape Capital Management, L.l.c. | 0 | −100,00 | 0 | |||||
| 2025-08-12 | 13F | Pathstone Holdings, LLC | 0 | −100,00 | 0 | |||||
| 2025-08-14 | 13F | Ieq Capital, Llc | 11 759 | −97,77 | 223 | −97,87 | ||||
| 2025-08-15 | 13F | Morse Asset Management, Inc | 186 143 | 31,92 | 3 531 | 26,42 | ||||
| 2025-07-25 | 13F | Concurrent Investment Advisors, LLC | 20 733 | 55,26 | 393 | 48,86 | ||||
| 2025-07-31 | 13F | Whipplewood Advisors, LLC | 17 451 | 91 747,37 | 331 | 32,93 | ||||
| 2025-07-30 | 13F | FNY Investment Advisers, LLC | 5 600 | 0,00 | 0 | |||||
| 2025-08-14 | 13F | UBS Group AG | 1 719 220 | 19,73 | 32 614 | 14,71 | ||||
| 2025-09-04 | 13F/A | Advisor Group Holdings, Inc. | 1 293 192 | 9,31 | 24 532 | 4,73 | ||||
| 2025-07-24 | 13F | Us Bancorp \de\ | 54 213 | 2,30 | 1 028 | −2,00 | ||||
| 2025-08-14 | 13F | Raymond James Financial Inc | 1 181 086 | −0,48 | 22 405 | −4,65 | ||||
| 2025-07-22 | 13F | Merit Financial Group, LLC | 77 369 | 6,94 | 1 468 | 2,44 | ||||
| 2025-08-14 | 13F | Mml Investors Services, Llc | 86 576 | 2,16 | 2 | 0,00 | ||||
| 2025-08-14 | 13F | Certified Advisory Corp | 30 783 | 3,21 | 584 | −1,19 | ||||
| 2025-08-15 | 13F | First Heartland Consultants, Inc. | 35 732 | 21,84 | 678 | 16,72 | ||||
| 2025-08-14 | 13F | Tennessee Valley Asset Management Partners | 0 | −100,00 | 0 | |||||
| 2025-08-05 | 13F | Huntington National Bank | 2 730 | −63,62 | 52 | −65,54 | ||||
| 2025-07-15 | 13F | World Equity Group, Inc. | 24 041 | 45,56 | 456 | 39,45 | ||||
| 2025-04-23 | 13F | Walkner Condon Financial Advisors LLC | 0 | −100,00 | 0 | |||||
| 2025-07-31 | 13F | Gill Capital Partners, Llc | 165 193 | 0,33 | 3 134 | −3,90 | ||||
| 2025-07-18 | 13F | Consolidated Portfolio Review Corp | 37 364 | −64,73 | 709 | −66,24 | ||||
| 2025-08-11 | 13F | Western Wealth Management, LLC | 72 888 | −1,84 | 1 383 | −5,99 | ||||
| 2025-08-14 | 13F | Beaird Harris Wealth Management, LLC | 300 | 0,00 | 6 | 0,00 | ||||
| 2025-08-14 | 13F | Investmark Advisory Group LLC | 14 977 | −26,47 | 284 | −29,53 | ||||
| 2025-07-25 | 13F | Retirement Planning Group, Llc / Ny | 193 036 | 0,58 | 3 702 | −2,61 | ||||
| 2025-08-13 | 13F | WealthTrust Axiom LLC | 19 683 | 9,35 | 373 | 4,78 | ||||
| 2025-07-29 | 13F | Disciplined Investments, LLC | 14 000 | 0,00 | 266 | −4,33 | ||||
| 2025-08-14 | 13F | CoreCap Advisors, LLC | 49 863 | −8,36 | 946 | −12,26 | ||||
| 2025-08-08 | 13F | Crossmark Global Holdings, Inc. | 10 300 | 0,00 | 195 | −3,94 | ||||
| 2025-08-14 | 13F | EP Wealth Advisors, Inc. | 33 474 | 29,86 | 635 | 24,51 | ||||
| 2025-07-14 | 13F | Capital CS Group, LLC | 20 176 | 4,06 | 383 | −0,26 | ||||
| 2025-07-23 | 13F | Nbt Bank N A /ny | 487 | 0,00 | 9 | 0,00 | ||||
| 2025-07-17 | 13F | Sound Income Strategies, LLC | 4 084 | −48,30 | 77 | −50,64 | ||||
| 2025-07-25 | 13F | Means Investment Co., Inc. | 143 601 | 0,27 | 2 724 | −3,92 | ||||
| 2025-08-14 | 13F | Sunbelt Securities, Inc. | 2 478 | −37,14 | 45 | −42,31 | ||||
| 2025-05-19 | 13F | Smith Asset Management Co., LLC | 104 423 | 16,18 | 2 068 | 25,42 | ||||
| 2025-04-22 | 13F | TrueMark Investments, LLC | 0 | −100,00 | 0 | |||||
| 2025-08-12 | 13F | Tradition Wealth Management, LLC | 52 498 | −0,32 | 996 | −4,51 | ||||
| 2025-08-08 | 13F | Capital Investment Advisory Services, LLC | 181 346 | 7,33 | 3 440 | 2,84 | ||||
| 2025-07-31 | 13F | Jackson Hole Capital Partners, LLC | 22 632 | 73,66 | 429 | 66,28 | ||||
| 2025-08-06 | 13F | Financial Alternatives, Inc | 13 874 | 0,00 | 263 | −4,01 | ||||
| 2025-07-03 | 13F | Sage Capital Advisors,llc | 23 808 | 2,19 | 452 | −2,17 | ||||
| 2025-08-13 | 13F | Scotia Capital Inc. | 66 027 | 2,91 | 1 253 | −1,42 | ||||
| 2025-08-13 | 13F | StoneX Group Inc. | 18 450 | −1,46 | 353 | −5,38 | ||||
| 2025-08-18 | 13F | Hollencrest Capital Management | 8 916 | 0,00 | 169 | −3,98 | ||||
| 2025-07-29 | 13F | International Assets Investment Management, Llc | 28 700 | 16,87 | 544 | 11,93 | ||||
| 2025-08-13 | 13F | Guggenheim Capital Llc | 633 263 | 10,84 | 12 013 | 6,19 | ||||
| 2025-07-08 | 13F | Parisi Gray Wealth Management | 69 000 | 0,00 | 1 309 | −4,25 | ||||
| 2025-07-28 | 13F | Mission Hills Financial Advisory, LLC | 534 435 | 18,39 | 10 138 | 13,43 | ||||
| 2025-08-05 | 13F | Garrison Bradford & Associates Inc | 409 | −44,43 | 8 | −50,00 | ||||
| 2025-07-22 | 13F | Firethorn Wealth Partners, Llc | 10 152 | 193 | ||||||
| 2025-08-11 | 13F | TD Waterhouse Canada Inc. | 1 175 418 | 6,90 | 22 376 | 3,41 | ||||
| 2025-07-17 | 13F | Northwest Wealth Management, Llc | 18 511 | 0,00 | 351 | −4,10 | ||||
| 2025-04-15 | 13F | Noble Wealth Management PBC | 115 130 | −38,76 | 2 280 | −33,90 | ||||
| 2025-07-29 | 13F | Mezzasalma Advisors, LLC | 16 171 | 3,50 | 307 | −0,97 | ||||
| 2025-08-13 | 13F | Rsm Us Wealth Management Llc | 50 001 | 0,00 | 960 | −4,20 | ||||
| 2025-07-17 | 13F | Melfa Wealth Management, Llc | 15 916 | −5,37 | 302 | −9,61 | ||||
| 2025-05-13 | 13F | Elequin Capital Lp | 0 | −100,00 | 0 | |||||
| 2025-08-11 | 13F | Outlook Wealth Advisors, LLC | 54 255 | 0,63 | 1 029 | −3,56 | ||||
| 2025-08-01 | 13F | Yukon Wealth Management, Inc. | 10 665 | −52,97 | 202 | −54,91 | ||||
| 2025-07-11 | 13F | Farther Finance Advisors, LLC | 66 517 | 724,15 | 1 262 | 693,08 | ||||
| 2025-07-30 | 13F | Brookstone Capital Management | 222 907 | 4,47 | 4 229 | 0,09 | ||||
| 2025-08-19 | 13F | National Asset Management, Inc. | 166 195 | 36,16 | 3 153 | 39,35 | ||||
| 2025-08-26 | 13F/A | Thrivent Financial For Lutherans | 138 073 | 76,14 | 3 | 100,00 | ||||
| 2025-07-17 | 13F | Janney Montgomery Scott LLC | 343 707 | 4,77 | 7 | 0,00 | ||||
| 2025-08-15 | 13F | Morgan Stanley | 12 561 807 | −4,05 | 238 298 | −8,07 | ||||
| 2025-07-08 | 13F | Nbc Securities, Inc. | 11 358 | 1,33 | 0 | |||||
| 2025-09-09 | 13F | NWF Advisory Services Inc. | 11 369 | −14,72 | 216 | −18,25 | ||||
| 2025-08-08 | 13F | Larson Financial Group LLC | 7 082 | 0,00 | 134 | −4,29 | ||||
| 2025-08-12 | 13F | Quantum Private Wealth, LLC | 16 171 | 0,10 | 307 | −4,08 | ||||
| 2025-05-14 | 13F | Natixis | 0 | −100,00 | 0 | |||||
| 2025-08-11 | 13F | Principal Securities, Inc. | 209 375 | −1,78 | 3 972 | 1,59 | ||||
| 2025-07-30 | 13F | LifeWealth Investments, LLC | 321 905 | 19,30 | 6 107 | 14,30 | ||||
| 2025-08-12 | 13F | Proequities, Inc. | 0 | 0 | ||||||
| 2025-07-09 | 13F | Triumph Capital Management | 62 799 | 27,32 | 1 191 | 22,03 | ||||
| 2025-08-04 | 13F | AlphaStar Capital Management, LLC | 240 239 | 24,61 | 4 557 | 19,39 | ||||
| 2025-08-14 | 13F | Cantor Fitzgerald, L. P. | 6 483 | 123 | ||||||
| 2025-07-11 | 13F | Mallini Complete Financial Planning LLC | 16 838 | 15,70 | 319 | 10,76 | ||||
| 2025-08-15 | 13F | Kestra Advisory Services, LLC | 147 987 | 9,08 | 2 807 | 4,50 | ||||
| 2025-08-11 | 13F | Beta Wealth Group, Inc. | 346 914 | 20,42 | 6 581 | 15,36 | ||||
| 2025-08-08 | 13F | Compass Financial Services Inc | 835 | 0,00 | 16 | −6,25 | ||||
| 2025-08-12 | 13F | Coston, McIsaac & Partners | 2 067 | 1,72 | 0 | |||||
| 2025-07-29 | 13F | FLC Capital Advisors | 10 131 | 0,00 | 192 | −4,00 | ||||
| 2025-08-14 | 13F | Integrated Wealth Concepts LLC | 20 804 | −24,16 | 395 | −27,44 | ||||
| 2025-08-13 | 13F | Cary Street Partners Financial Llc | 119 647 | 227,56 | 2 270 | 213,83 | ||||
| 2025-05-14 | 13F | REAP Financial Group, LLC | 0 | −100,00 | 0 | |||||
| 2025-06-26 | NP | ATCAX - Anchor Risk Managed Credit Strategies Fund Advisor Class Shares | 124 300 | 0,00 | 2 322 | −6,37 | ||||
| 2025-07-29 | 13F | Chicago Partners Investment Group LLC | 17 859 | 6,18 | 342 | 7,89 | ||||
| 2025-08-07 | 13F | Samalin Investment Counsel, LLC | 48 417 | 4,49 | 918 | 0,11 | ||||
| 2025-08-14 | 13F | Comerica Bank | 97 704 | 0,15 | 1 853 | −4,04 | ||||
| 2025-07-22 | 13F | DAVENPORT & Co LLC | 18 361 | 33,55 | 348 | 27,94 | ||||
| 2025-08-11 | 13F | HHM Wealth Advisors, LLC | 2 119 | 0,00 | 40 | −2,44 | ||||
| 2025-08-18 | 13F/A | National Bank Of Canada /fi/ | 41 382 | 44,21 | 784 | 38,03 | ||||
| 2025-08-14 | 13F | Verition Fund Management LLC | 0 | −100,00 | 0 | |||||
| 2025-08-14 | 13F | Herold Advisors, Inc. | 11 523 | 219 | ||||||
| 2025-07-07 | 13F | Thurston, Springer, Miller, Herd & Titak, Inc. | 780 | 0,00 | 15 | −6,67 | ||||
| 2025-07-10 | 13F | Oliver Lagore Vanvalin Investment Group | 1 700 | 0,00 | 34 | 6,45 | ||||
| 2025-08-12 | 13F | XTX Topco Ltd | 11 515 | 218 | ||||||
| 2025-08-05 | 13F | Westside Investment Management, Inc. | 0 | −100,00 | 0 | |||||
| 2025-08-14 | 13F | NCP Inc. | 84 214 | 9,70 | 1 598 | 5,07 | ||||
| 2025-07-25 | 13F | Cwm, Llc | 95 116 | 834,16 | 2 | |||||
| 2025-07-25 | 13F | Apollon Wealth Management, LLC | 24 970 | −3,24 | 474 | −7,25 | ||||
| 2025-05-02 | 13F | Signaturefd, Llc | 0 | −100,00 | 0 | |||||
| 2025-07-16 | 13F | Novem Group | 25 540 | 0,09 | 484 | −4,16 | ||||
| 2025-08-15 | 13F | Tower Research Capital LLC (TRC) | 0 | −100,00 | 0 | |||||
| 2025-08-04 | 13F | Daymark Wealth Partners, Llc | 10 053 | 191 | ||||||
| 2025-08-12 | 13F | Steward Partners Investment Advisory, Llc | 27 199 | −49,77 | 516 | −51,96 | ||||
| 2025-08-13 | 13F | EverSource Wealth Advisors, LLC | 5 000 | 0,00 | 95 | −5,05 | ||||
| 2025-08-29 | 13F | Centaurus Financial, Inc. | 8 471 | 0,02 | 0 | |||||
| 2025-08-14 | 13F | Susquehanna International Group, Llp | 22 604 | 429 | ||||||
| 2025-07-08 | 13F | Parallel Advisors, LLC | 28 631 | −1,43 | 543 | −5,57 | ||||
| 2025-07-22 | 13F | Global Assets Advisory, LLC | 10 277 | 196 | ||||||
| 2025-04-29 | 13F | Raleigh Capital Management Inc. | 0 | −100,00 | 0 | |||||
| 2025-07-24 | 13F | Wealthstar Advisors, Llc | 113 008 | −0,05 | 2 144 | −4,24 | ||||
| 2025-05-12 | 13F | Independent Advisor Alliance | 0 | −100,00 | 0 | |||||
| 2025-07-29 | 13F | Salomon & Ludwin, LLC | 352 | 0,00 | 7 | 0,00 | ||||
| 2025-07-24 | 13F | IFP Advisors, Inc | 15 795 | −65,77 | 300 | −67,25 | ||||
| 2025-04-16 | 13F | Rye Brook Capital LLC | 0 | −100,00 | 0 | |||||
| 2025-07-08 | 13F | Webster Bank, N. A. | 1 459 | 0,00 | 28 | −3,57 | ||||
| 2025-08-13 | 13F | Townsquare Capital Llc | 0 | −100,00 | 0 | |||||
| 2025-08-07 | 13F | Summit X, LLC | 23 980 | −60,18 | 455 | −61,91 | ||||
| 2025-07-15 | 13F | North Star Investment Management Corp. | 900 | 0,00 | 17 | 0,00 | ||||
| 2025-08-05 | 13F | Key FInancial Inc | 33 | 0,00 | 1 | |||||
| 2025-08-14 | 13F | Smartleaf Asset Management LLC | 2 044 | 0,00 | 39 | −5,00 | ||||
| 2025-08-01 | 13F | Envestnet Asset Management Inc | 342 615 | 2,51 | 6 499 | −1,78 | ||||
| 2025-05-06 | 13F | Venturi Wealth Management, LLC | 0 | −100,00 | 0 | |||||
| 2025-08-06 | 13F | Nicholas Hoffman & Company, LLC. | 22 572 | 0,00 | 428 | −4,04 | ||||
| 2025-08-11 | 13F | Mach-1 Financial Group, Inc. | 23 159 | 439 | ||||||
| 2025-07-29 | 13F | Arcus Capital Partners, LLC | 22 396 | −16,62 | 425 | −20,15 | ||||
| 2025-08-05 | 13F | Aviance Capital Partners, LLC | 22 930 | 0,77 | 435 | −3,56 | ||||
| 2025-07-14 | 13F | E&G Advisors, LP | 37 801 | −2,12 | 717 | −6,15 | ||||
| 2025-08-13 | 13F | McGowan Group Asset Management, Inc. | 0 | −100,00 | 0 | |||||
| 2025-08-14 | 13F/A | Rockefeller Capital Management L.P. | 144 454 | 6,34 | 2 740 | 1,90 | ||||
| 2025-07-29 | 13F | R.P. Boggs & Co. | 149 698 | 427,68 | 2 840 | 255,32 | ||||
| 2025-08-11 | 13F | Brown Brothers Harriman & Co | 0 | −100,00 | 0 | |||||
| 2025-07-25 | 13F | Natural Investments, Llc | 13 073 | 1,98 | 0 | |||||
| 2025-07-14 | 13F | Buska Wealth Management, LLC | 24 795 | 6,39 | 470 | 1,95 | ||||
| 2025-08-01 | 13F | Winebrenner Capital Management Llc | 10 946 | 7,88 | 208 | 3,50 | ||||
| 2025-07-10 | 13F | Western Pacific Wealth Management, LP | 2 000 | 0,00 | 38 | −5,13 | ||||
| 2025-08-14 | 13F | Evergreen Capital Management Llc | 117 557 | −1,86 | 2 256 | −5,96 | ||||
| 2025-08-12 | 13F | SRS Capital Advisors, Inc. | 1 063 | 20 | ||||||
| 2025-07-30 | 13F | Bogart Wealth, LLC | 3 354 | 0,00 | 64 | −4,55 | ||||
| 2025-08-14 | 13F | GWM Advisors LLC | 172 573 | 81,68 | 3 274 | 74,10 | ||||
| 2025-07-08 | 13F/A | Salem Investment Counselors Inc | 300 | 6 | ||||||
| 2025-08-14 | 13F | Ausdal Financial Partners, Inc. | 123 848 | 0,79 | 2 349 | −3,41 | ||||
| 2025-08-14 | 13F | Aqr Capital Management Llc | 18 125 | 0,00 | 344 | −4,19 | ||||
| 2025-08-06 | 13F | Commonwealth Equity Services, Llc | 1 455 105 | −7,90 | 28 | −12,90 | ||||
| 2025-08-13 | 13F | Cresset Asset Management, LLC | 71 606 | 2,20 | 1 374 | −2,07 | ||||
| 2025-07-16 | 13F | Maridea Wealth Management LLC | 23 596 | 4,43 | 448 | 0,00 | ||||
| 2025-08-14 | 13F | Atomi Financial Group, Inc. | 27 679 | −0,92 | 525 | −5,06 | ||||
| 2025-08-06 | 13F/A | Flagship Private Wealth, LLC | 117 453 | 10,06 | 2 228 | 5,44 | ||||
| 2025-05-15 | 13F | Hrt Financial Lp | 0 | −100,00 | 0 | |||||
| 2025-08-12 | 13F | MWA Asset Management | 17 600 | 1,73 | 334 | −2,63 | ||||
| 2025-07-29 | 13F | Private Trust Co Na | 70 320 | −2,13 | 1 334 | −6,26 | ||||
| 2025-07-08 | 13F | Morris Retirement Advisors, LLC | 70 358 | 7,90 | 1 335 | 3,33 | ||||
| 2025-05-20 | 13F/A | Colony Group, LLC | 0 | −100,00 | 0 | |||||
| 2025-08-07 | 13F | New England Private Wealth Advisors LLC | 0 | −100,00 | 0 | |||||
| 2025-08-13 | 13F | WCG Wealth Advisors LLC | 26 396 | 60,68 | 501 | 53,85 | ||||
| 2025-05-15 | 13F | Parvin Asset Management, LLC | 0 | −100,00 | 0 | |||||
| 2025-08-08 | 13F | Avantax Advisory Services, Inc. | 129 718 | −45,92 | 2 461 | −48,19 | ||||
| 2025-05-15 | 13F/A | Orion Portfolio Solutions, LLC | 213 368 | 4,81 | 4 225 | 13,15 | ||||
| 2025-04-23 | 13F | Mascagni Wealth Management, Inc. | 0 | −100,00 | 0 | −100,00 | ||||
| 2025-08-14 | 13F | Cohen & Steers, Inc. | 1 286 712 | 4,42 | 24 | 0,00 | ||||
| 2025-07-30 | NP | HYIN - WisdomTree Alternative Income Fund N/A | 90 538 | 4,28 | 1 691 | −2,37 | ||||
| 2025-07-14 | 13F | Lewis Asset Management, LLC | 36 700 | 224,12 | 696 | 210,71 | ||||
| 2025-08-13 | 13F | Northwestern Mutual Wealth Management Co | 39 421 | −81,85 | 748 | −82,63 | ||||
| 2025-08-13 | 13F | M Holdings Securities, Inc. | 44 517 | −8,04 | 1 | |||||
| 2025-08-11 | 13F | Rothschild Investment Llc | 3 000 | 0,00 | 57 | −5,08 | ||||
| 2025-05-14 | 13F | Walleye Capital LLC | 0 | −100,00 | 0 | |||||
| 2025-07-10 | 13F | HF Advisory Group, LLC | 54 605 | 1,94 | 1 036 | −2,36 | ||||
| 2025-07-28 | 13F | RFG Advisory, LLC | 176 579 | 16,74 | 3 350 | 11,86 | ||||
| 2025-07-24 | 13F | Cyndeo Wealth Partners, LLC | 430 842 | 15,79 | 8 173 | 10,94 | ||||
| 2025-07-29 | 13F | Stratos Wealth Advisors, LLC | 51 811 | 3,02 | 983 | −1,31 | ||||
| 2025-08-06 | 13F | AE Wealth Management LLC | 19 296 | −63,55 | 366 | −65,08 | ||||
| 2025-08-14 | 13F | Two Sigma Securities, Llc | 17 538 | −10,64 | 333 | −14,43 | ||||
| 2025-08-14 | 13F | AllSquare Wealth Management LLC | 8 413 | −12,73 | 160 | −16,32 | ||||
| 2025-07-17 | 13F | Wagner Wealth Management, Llc | 396 163 | 8,02 | 7 515 | 3,50 | ||||
| 2025-07-23 | 13F | Clear Creek Financial Management, LLC | 22 231 | 18,72 | 422 | 13,78 | ||||
| 2025-08-06 | 13F | Golden State Wealth Management, LLC | 5 897 | 3,04 | 112 | −1,77 | ||||
| 2025-07-21 | 13F | Ameriflex Group, Inc. | 28 613 | 0,00 | 539 | −4,95 | ||||
| 2025-08-13 | 13F | Baker Avenue Asset Management, LP | 18 666 | −39,00 | 354 | −41,49 | ||||
| 2025-07-21 | 13F | Consilium Wealth Advisory, LLC | 10 000 | 0,00 | 190 | −4,55 | ||||
| 2025-08-11 | 13F | Aptus Capital Advisors, LLC | 27 994 | 0,13 | 531 | −3,98 | ||||
| 2025-08-12 | 13F | TCP Asset Management, LLC | 0 | −100,00 | 0 | |||||
| 2025-07-29 | 13F | Stephens Inc /ar/ | 17 195 | 0,77 | 326 | −3,26 | ||||
| 2025-07-02 | 13F | HBW Advisory Services LLC | 24 467 | 3,03 | 464 | −1,28 | ||||
| 2025-07-08 | 13F | Goldstone Financial Group, LLC | 46 345 | 1,36 | 886 | −2,21 | ||||
| 2025-07-11 | 13F | Thomasville National Bank | 28 600 | −23,79 | 543 | −27,05 | ||||
| 2025-07-21 | 13F | Future Financial Wealth Managment LLC | 32 470 | 3,71 | 616 | −0,65 | ||||
| 2025-04-22 | 13F | Synergy Financial Management, LLC | 0 | −100,00 | 0 | |||||
| 2025-08-11 | 13F | HighTower Advisors, LLC | 318 942 | 10,60 | 6 050 | 5,97 | ||||
| 2025-08-12 | 13F | Coldstream Capital Management Inc | 0 | −100,00 | 0 | |||||
| 2025-08-01 | 13F | Alexander Labrunerie & Co., Inc. | 103 587 | −1,11 | 1 965 | −5,26 | ||||
| 2025-08-11 | 13F | Private Advisor Group, LLC | 791 728 | 12,00 | 15 019 | 7,30 |