Grundläggande statistik
| Institutionella ägare | 215 total, 215 long only, 0 short only, 0 long/short - change of 2,86% MRQ |
| Genomsnittlig portföljallokering | 0.2370 % - change of −12,05% MRQ |
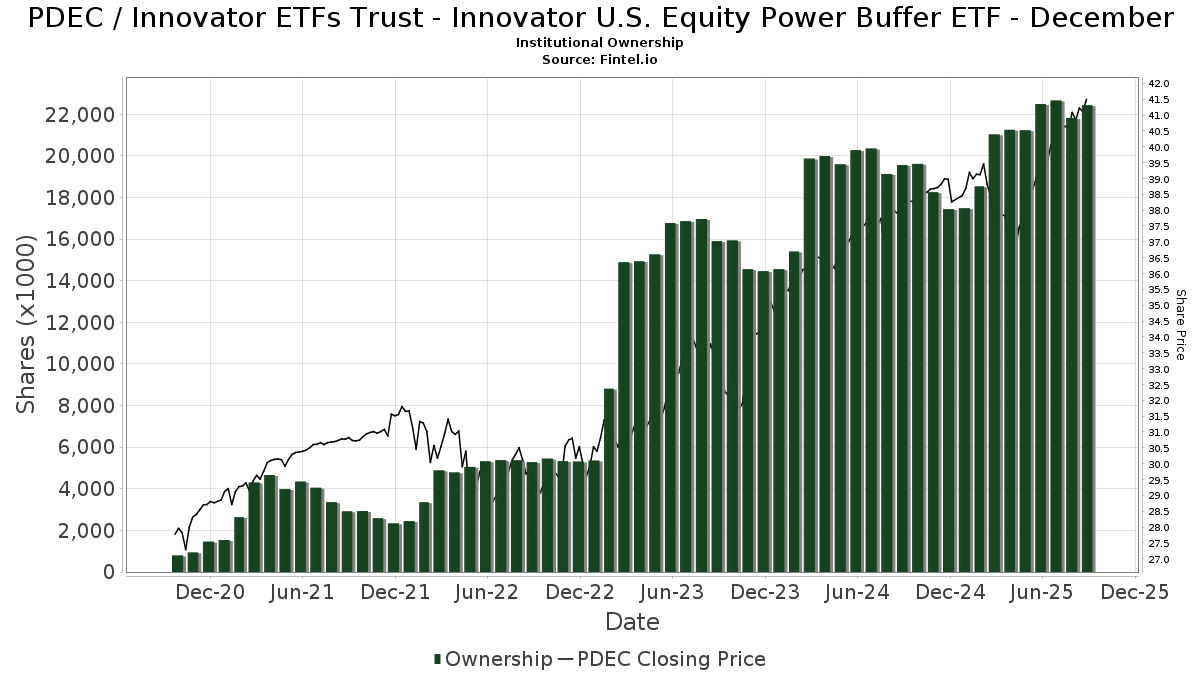
| Institutionella aktier (lång) | 22 431 952 (ex 13D/G) - change of −0,07MM shares −0,29% MRQ |
| Institutionellt värde (lång) | $ 782 436 USD ($1000) |
Institutionellt ägande och aktieägare
Innovator ETFs Trust - Innovator U.S. Equity Power Buffer ETF - December (US:PDEC) har 215 Institutionella ägare och aktieägare som har lämnat in 13D/G- eller 13F-formulär till Securities Exchange Commission (SEC). Dessa institut innehar totalt 22,431,952 aktier. Största aktieägare inkluderar Alliancebernstein L.p., Penserra Capital Management LLC, Innovator ETFs Trust - Innovator Laddered Fund of U.S. Equity Power Buffer ETFs, Advisor Group Holdings, Inc., Kovitz Investment Group Partners, LLC, Brookstone Capital Management, Blair William & Co/il, Commonwealth Equity Services, Llc, Cerity Partners LLC, and HighTower Advisors, LLC .
Innovator ETFs Trust - Innovator U.S. Equity Power Buffer ETF - December (BATS:PDEC) Institutionell ägarstruktur visar institutioners och fonders nuvarande positioner i företaget, samt de senaste förändringarna i positionernas storlek. Större aktieägare kan vara enskilda investerare, fonder, hedgefonder eller institutioner. Bilaga 13D visar att investeraren äger (eller ägde) mer än 5% av företaget och avser (eller avsåg) att aktivt eftersträva en förändring av affärsstrategin. Schedule 13G indikerar en passiv investering på över 5%.
The share price as of September 10, 2025 is 41,49 / share. Previously, on September 11, 2024, the share price was 38,01 / share. This represents an increase of 9,16% over that period.
Fondsentimentets poäng
Fondsentimentet poängen(fka Ägarackumulation-poäng) visar vilka aktier som är mest köpta av fonder. Det är resultatet av en sofistikerad kvantitativ flerfaktormodell som identifierar företag med de högsta nivåerna av institutionell ackumulering. Poängsättningsmodellen använder en kombination av den totala ökningen av redovisade ägare, förändringarna i portföljallokeringarna för dessa ägare och andra mått. Siffran sträcker sig från 0 till 100, där högre siffror indikerar en högre nivå av ackumulering i förhållande till sina konkurrenter, och 50 är genomsnittet.
Uppdateringsfrekvens: Dagligen
Se Ownership Explorer, som innehåller en lista över de högst rankade företagen.
Institutionell sälj/köp-kvot
Förutom att rapportera vanliga eget kapital- och skuldemissioner måste institutioner med mer än 100MM tillgångar under förvaltning också avslöja sina innehav av sälj- och köpoptioner. Eftersom säljoptioner i allmänhet indikerar ett negativt sentiment och köpoptioner indikerar ett positivt sentiment, kan vi få en uppfattning om det övergripande institutionella sentimentet genom att plotta förhållandet mellan säljoptioner och köpoptioner. Diagrammet till höger visar det historiska förhållandet mellan sälj- och köpoptioner för detta instrument.
Genom att använda sälj/köp-kvoten som en indikator på aktieägarnas sentiment undviker man en av de största bristerna med att använda det totala institutionella ägandet, nämligen att en betydande del av de förvaltade tillgångarna investeras passivt för att följa index. Passivt förvaltade fonder köper vanligtvis inte optioner, så indikatorn för sälj/köp-kvoten ger en bättre bild av stämningen i aktivt förvaltade fonder.
13F- och NPORT-arkiveringar
Detaljer om 13F-arkiveringar är gratis. Detaljer om NP-arkiveringar kräver ett premiummedlemskap. Gröna rader indikerar nya positioner. Röda rader indikerar stängda positioner. Klicka på länk symbolen för att se hela transaktionshistoriken.
Uppgradera
för att låsa upp premiumdata och exportera till Excel ![]() .
.
| Fil Datum | Källa | Investerare | Typ | Genomsnittligt pris (beräknat) |
Aktier | Δ Aktier (%) |
Rapporterat värde (1000 USD) |
Δ Värde (%) |
Portföljallokering (%) |
|
|---|---|---|---|---|---|---|---|---|---|---|
| 2025-07-22 | 13F | Siligmueller & Norvid Wealth Advisors LLC | 24 067 | −69,15 | 968 | −66,98 | ||||
| 2025-07-16 | 13F | Evergreen Private Wealth LLC | 1 767 | 0,00 | 71 | 6,06 | ||||
| 2025-08-14 | 13F | Helium Advisors LLC | 16 890 | 0,00 | 676 | 6,30 | ||||
| 2025-07-23 | 13F | Valmark Advisers, Inc. | 22 823 | 0,00 | 913 | 6,41 | ||||
| 2025-07-16 | 13F | Old Port Advisors | 10 650 | 0,00 | 426 | 6,50 | ||||
| 2025-08-13 | 13F | BCJ Capital Management, LLC | 101 271 | 16,33 | 4 052 | 23,77 | ||||
| 2025-08-15 | 13F | CI Private Wealth, LLC | 5 489 | 0,00 | 220 | 6,31 | ||||
| 2025-08-12 | 13F | Coldstream Capital Management Inc | 11 599 | 0,00 | 464 | 6,42 | ||||
| 2025-04-10 | 13F | ACT Advisors, LLC. | 0 | −100,00 | 0 | |||||
| 2025-08-06 | 13F | AE Wealth Management LLC | 44 462 | −1,79 | 1 779 | 4,47 | ||||
| 2025-05-05 | 13F | PCA Investment Advisory Services Inc. | 0 | −100,00 | 0 | |||||
| 2025-08-14 | 13F | CoreCap Advisors, LLC | 110 493 | 0,16 | 4 421 | 6,58 | ||||
| 2025-05-07 | 13F | TCTC Holdings, LLC | 0 | −100,00 | 0 | |||||
| 2025-07-31 | 13F | Gill Capital Partners, Llc | 114 226 | −1,17 | 4 570 | 5,18 | ||||
| 2025-07-25 | 13F | Atria Wealth Solutions, Inc. | 65 925 | −10,39 | 2 639 | −4,63 | ||||
| 2025-07-30 | 13F | Strategic Blueprint, LLC | 5 357 | −8,89 | 214 | −3,17 | ||||
| 2025-08-11 | 13F | Annis Gardner Whiting Capital Advisors, LLC | 16 164 | 99,09 | 647 | 111,80 | ||||
| 2025-08-11 | 13F | Blue Bell Private Wealth Management, Llc | 2 360 | 0,00 | 94 | 6,82 | ||||
| 2025-07-11 | 13F | SILVER OAK SECURITIES, Inc | 10 446 | −12,88 | 418 | −7,13 | ||||
| 2025-07-09 | 13F | Dynamic Advisor Solutions LLC | 13 505 | 540 | ||||||
| 2025-05-07 | 13F | Horan Capital Advisors, LLC. | 12 374 | −13,78 | 465 | −15,61 | ||||
| 2025-08-08 | 13F | Phoenix Wealth Advisors | 9 560 | 0,00 | 382 | 6,41 | ||||
| 2025-08-08 | 13F | Avantax Advisory Services, Inc. | 28 356 | 1,63 | 1 135 | 8,10 | ||||
| 2025-08-06 | 13F | Soltis Investment Advisors LLC | 7 652 | −4,41 | 306 | 2,00 | ||||
| 2025-07-31 | 13F | West Michigan Advisors, Llc | 225 796 | 0,91 | 9 034 | 7,38 | ||||
| 2025-08-11 | 13F | Nations Financial Group Inc, /ia/ /adv | 40 229 | 8,46 | 1 610 | 15,42 | ||||
| 2025-08-12 | 13F | Ascent Wealth Partners, LLC | 29 001 | 15,84 | 1 160 | 23,27 | ||||
| 2025-08-12 | 13F | Jacobi Capital Management LLC | 62 916 | −1,87 | 2 517 | 4,44 | ||||
| 2025-07-29 | 13F | Stephens Inc /ar/ | 0 | −100,00 | 0 | |||||
| 2025-08-06 | 13F | Valtinson Bruner Financial Planning LLC | 8 750 | −1,13 | 350 | 5,42 | ||||
| 2025-08-11 | 13F | Outlook Wealth Advisors, LLC | 111 183 | 0,33 | 4 448 | 6,77 | ||||
| 2025-08-15 | 13F | Morgan Stanley | 1 575 | 5,00 | 63 | 12,50 | ||||
| 2025-08-11 | 13F | Brown Brothers Harriman & Co | 5 766 | 0,00 | 231 | 6,48 | ||||
| 2025-07-17 | 13F | HB Wealth Management, LLC | 21 701 | −81,75 | 868 | −80,58 | ||||
| 2025-07-24 | 13F | Weaver Capital Management LLC | 82 623 | −12,85 | 3 306 | −7,27 | ||||
| 2025-07-28 | 13F | Cypress Wealth Services, LLC | 8 859 | 0,00 | 354 | 6,31 | ||||
| 2025-07-30 | 13F | Sanders Morris Harris Llc | 5 000 | 200 | ||||||
| 2025-07-09 | 13F | Keystone Wealth Services, LLC | 9 623 | 0,00 | 385 | 6,65 | ||||
| 2025-08-12 | 13F | Proequities, Inc. | 0 | 0 | ||||||
| 2025-08-14 | 13F | Jane Street Group, Llc | 19 053 | 762 | ||||||
| 2025-08-04 | 13F | Spire Wealth Management | 19 310 | 0,00 | 773 | 6,34 | ||||
| 2025-08-08 | 13F | Evolution Wealth Advisors, LLC | 14 305 | 0,00 | 572 | 6,52 | ||||
| 2025-08-14 | 13F | Ausdal Financial Partners, Inc. | 15 653 | 0,00 | 626 | 6,46 | ||||
| 2025-07-08 | 13F | Nbc Securities, Inc. | 292 | 0,00 | 0 | |||||
| 2025-07-30 | 13F | Capstone Triton Financial Group, LLC | 16 205 | 0,00 | 648 | 4,18 | ||||
| 2025-04-10 | 13F | Sugar Maple Asset Management, LLC | 0 | −100,00 | 0 | |||||
| 2025-08-06 | 13F | Penserra Capital Management LLC | 1 465 981 | 17,53 | 59 | 26,09 | ||||
| 2025-07-22 | 13F | Global Strategic Investment Solutions, LLC | 194 661 | −6,88 | 7 788 | −0,90 | ||||
| 2025-08-14 | 13F | Financial Network Wealth Advisors LLC | 2 206 | 0,00 | 88 | 7,32 | ||||
| 2025-07-25 | 13F | Concurrent Investment Advisors, LLC | 43 295 | 0,58 | 1 732 | 7,05 | ||||
| 2025-08-01 | 13F | Advisory Alpha, LLC | 29 676 | 1,75 | 1 187 | 8,30 | ||||
| 2025-08-12 | 13F | Waterloo Capital, L.P. | 13 707 | 0,00 | 548 | 6,41 | ||||
| 2025-07-16 | 13F | Dakota Wealth Management | 5 147 | 206 | ||||||
| 2025-07-22 | 13F | MBL Wealth, LLC | 116 235 | 12,59 | 4 651 | 19,81 | ||||
| 2025-07-28 | 13F | RFG Advisory, LLC | 12 362 | −41,45 | 495 | −37,70 | ||||
| 2025-07-21 | 13F | Ameriflex Group, Inc. | 0 | −100,00 | 0 | |||||
| 2025-07-30 | 13F | Castle Wealth Management Llc | 0 | −100,00 | 0 | |||||
| 2025-08-06 | 13F | Wedbush Securities Inc | 8 248 | −3,50 | 0 | |||||
| 2025-08-06 | 13F | Commonwealth Equity Services, Llc | 678 655 | 5,42 | 27 | 12,50 | ||||
| 2025-07-21 | 13F | DHJJ Financial Advisors, Ltd. | 11 628 | 0,00 | 465 | 6,41 | ||||
| 2025-07-11 | 13F | Cypress Financial Planning Llc | 14 126 | −1,18 | 565 | 5,21 | ||||
| 2025-07-25 | 13F | Cwm, Llc | 5 182 | 1,81 | 0 | |||||
| 2025-08-14 | 13F | Aqr Capital Management Llc | 0 | −100,00 | 0 | |||||
| 2025-08-14 | 13F | Susquehanna International Group, Llp | 11 192 | −78,01 | 448 | −76,63 | ||||
| 2025-06-24 | NP | Innovator ETFs Trust - Innovator Laddered Fund of U.S. Equity Power Buffer ETFs | 1 280 921 | 14,10 | 47 970 | 9,43 | ||||
| 2025-08-04 | 13F | Atria Investments Llc | 140 382 | 28,58 | 5 617 | 36,81 | ||||
| 2025-08-05 | 13F | Milestone Asset Management, Llc | 58 632 | −4,01 | 2 346 | 2,13 | ||||
| 2025-08-14 | 13F | Talon Private Wealth, LLC | 48 435 | −7,40 | 1 938 | −1,48 | ||||
| 2025-08-14 | 13F | Raymond James Financial Inc | 297 797 | 11,25 | 11 915 | 18,38 | ||||
| 2025-07-15 | 13F | Retirement Income Solutions, Inc | 38 677 | 0,00 | 1 547 | 6,40 | ||||
| 2025-08-19 | 13F | Cape Investment Advisory, Inc. | 5 200 | 0,00 | 208 | 6,67 | ||||
| 2025-07-10 | 13F | Focus Financial Network, Inc. | 8 190 | −8,50 | 328 | −2,68 | ||||
| 2025-07-17 | 13F | City Holding Co | 22 250 | −10,09 | 890 | −4,30 | ||||
| 2025-08-08 | 13F | Compass Financial Services Inc | 1 968 | 0,00 | 79 | 6,85 | ||||
| 2025-07-25 | 13F | Yarger Wealth Strategies, Llc | 81 461 | −0,53 | 3 259 | 5,85 | ||||
| 2025-07-31 | 13F | Orion Capital Management LLC | 20 295 | −0,02 | 812 | 6,42 | ||||
| 2025-05-01 | 13F | Quest 10 Wealth Builders, Inc. | 17 030 | −0,22 | 648 | −1,07 | ||||
| 2025-08-12 | 13F | Bedel Financial Consulting, Inc. | 5 908 | 0,00 | 236 | 6,31 | ||||
| 2025-07-18 | 13F | Truist Financial Corp | 144 891 | −3,36 | 5 797 | 2,84 | ||||
| 2025-07-30 | 13F | Greenup Street Wealth Management Llc | 7 639 | 9,24 | 306 | 16,41 | ||||
| 2025-08-12 | 13F | Steward Partners Investment Advisory, Llc | 68 651 | 0,00 | 2 747 | 6,39 | ||||
| 2025-07-16 | 13F | ORG Partners LLC | 2 500 | 0,00 | 100 | 6,38 | ||||
| 2025-07-28 | 13F | WealthPlan Investment Management, LLC | 5 136 | 205 | ||||||
| 2025-05-12 | 13F | Fmr Llc | 0 | −100,00 | 0 | |||||
| 2025-08-06 | 13F | HORAN Wealth, LLC | 11 838 | 474 | ||||||
| 2025-08-12 | 13F | Pathstone Holdings, LLC | 0 | −100,00 | 8 872 | 6,28 | ||||
| 2025-08-05 | 13F | Jessup Wealth Management, Inc | 6 189 | 0,00 | 248 | 6,47 | ||||
| 2025-08-14 | 13F | Visionary Wealth Advisors | 25 195 | −2,38 | 1 008 | 3,92 | ||||
| 2025-08-07 | 13F | Resources Investment Advisors, LLC. | 77 603 | 131,06 | 3 105 | 145,96 | ||||
| 2025-07-31 | 13F | Blue Sky Capital Consultants Group, Inc. | 7 632 | 305 | ||||||
| 2025-08-12 | 13F | SRS Capital Advisors, Inc. | 8 249 | 0,01 | 330 | 6,45 | ||||
| 2025-08-13 | 13F | Grantvest Financial Group LLC | 6 891 | −4,66 | 276 | 1,48 | ||||
| 2025-08-06 | 13F | ORBA Wealth Advisors, L.L.C. | 8 500 | 340 | ||||||
| 2025-07-17 | 13F | Clay Northam Wealth Management, LLC | 7 050 | 0,00 | 282 | 6,42 | ||||
| 2025-07-24 | 13F | Riverchase Wealth Management, Llc | 0 | −100,00 | 0 | |||||
| 2025-05-14 | 13F | Heritage Wealth Partners, LLC | 0 | −100,00 | 0 | |||||
| 2025-08-04 | 13F | Pensionmark Financial Group, Llc | 13 135 | −34,65 | 526 | −30,46 | ||||
| 2025-08-06 | 13F | Modera Wealth Management, LLC | 11 531 | 0,00 | 461 | 6,47 | ||||
| 2025-07-08 | 13F | Ptm Wealth Management, Llc | 32 618 | −12,24 | 1 312 | 0,31 | ||||
| 2025-08-14 | 13F | Integrated Wealth Concepts LLC | 10 125 | 0,00 | 405 | 6,58 | ||||
| 2025-08-14 | 13F | GWM Advisors LLC | 59 076 | −5,98 | 2 364 | 0,04 | ||||
| 2025-07-10 | 13F | Wealth Enhancement Advisory Services, Llc | 79 146 | −44,90 | 3 184 | −41,05 | ||||
| 2025-08-14 | 13F | Old Mission Capital Llc | 26 422 | 1 057 | ||||||
| 2025-07-28 | 13F | Cornerstone Wealth Group, LLC | 13 137 | 0,00 | 526 | 6,49 | ||||
| 2025-07-31 | 13F | Pinnacle Wealth Management Group, Inc. | 67 640 | 1,65 | 2 706 | 8,20 | ||||
| 2025-08-11 | 13F | Brown Wealth Management, Llc | 70 735 | −0,04 | 2 830 | 6,39 | ||||
| 2025-08-08 | 13F | Capital Investment Advisory Services, LLC | 8 178 | 1 494,15 | 327 | 1 621,05 | ||||
| 2025-08-08 | 13F | Foundations Investment Advisors, LLC | 259 232 | 6,00 | 10 372 | 12,79 | ||||
| 2025-08-01 | 13F | Envestnet Asset Management Inc | 416 731 | 11,19 | 16 642 | 18,10 | ||||
| 2025-08-12 | 13F | Calton & Associates, Inc. | 6 012 | 0,00 | 241 | 6,19 | ||||
| 2025-07-16 | 13F | PFS Partners, LLC | 3 200 | 128 | ||||||
| 2025-07-22 | 13F | Belpointe Asset Management LLC | 148 919 | −0,23 | 5 958 | 6,13 | ||||
| 2025-07-16 | 13F | Leading Edge Financial Planning LLC | 0 | −100,00 | 0 | |||||
| 2025-07-31 | 13F | Cambridge Investment Research Advisors, Inc. | 196 398 | −4,78 | 8 | 0,00 | ||||
| 2025-07-28 | 13F | Sagespring Wealth Partners, Llc | 18 905 | 0,54 | 756 | 7,08 | ||||
| 2025-08-07 | 13F | Lakeridge Wealth Management LLC | 10 567 | 0,00 | 423 | 6,30 | ||||
| 2025-08-11 | 13F | Capital Square, LLC | 5 131 | 206 | ||||||
| 2025-08-13 | 13F | SageView Advisory Group, LLC | 133 170 | 84,86 | 5 423 | 100,22 | ||||
| 2025-08-14 | 13F | First Commonwealth Financial Corp /pa/ | 93 555 | 4,21 | 3 743 | 10,90 | ||||
| 2025-07-21 | 13F | Keystone Financial Group, Inc. | 10 369 | −3,44 | 418 | 3,72 | ||||
| 2025-07-07 | 13F | O'Connor Financial Group LLC | 6 893 | 0,26 | 277 | 7,36 | ||||
| 2025-07-30 | 13F | Brookstone Capital Management | 929 495 | −7,00 | 37 189 | −1,03 | ||||
| 2025-08-04 | 13F | Creative Financial Designs Inc /adv | 2 930 | −1,31 | 117 | 5,41 | ||||
| 2025-07-21 | 13F | Patriot Financial Group Insurance Agency, LLC | 29 410 | 2,58 | 1 177 | 9,19 | ||||
| 2025-08-12 | 13F | LPL Financial LLC | 480 225 | 1,43 | 19 214 | 7,93 | ||||
| 2025-07-22 | 13F | Diligent Investors, LLC | 62 978 | −1,54 | 2 520 | 4,78 | ||||
| 2025-07-14 | 13F | AdvisorNet Financial, Inc | 18 789 | 0,00 | 752 | 6,37 | ||||
| 2025-05-15 | 13F | IHT Wealth Management, LLC | 0 | −100,00 | 0 | |||||
| 2025-08-15 | 13F | Kestra Advisory Services, LLC | 272 664 | 5,99 | 10 909 | 12,79 | ||||
| 2025-07-23 | 13F | Allegiance Financial Group Advisory Services LLC | 10 475 | 0,00 | 419 | 6,62 | ||||
| 2025-08-08 | 13F | Wealth Alliance | 36 985 | 0,00 | 1 480 | 6,40 | ||||
| 2025-07-24 | 13F | Stonebridge Financial Group, LLC | 0 | −100,00 | 0 | |||||
| 2025-08-07 | 13F | Allworth Financial LP | 2 805 | 55,40 | 112 | 67,16 | ||||
| 2025-07-31 | 13F | Whipplewood Advisors, LLC | 870 | 16,00 | 35 | 6,25 | ||||
| 2025-07-15 | 13F | Optima Capital Llc | 0 | −100,00 | 0 | |||||
| 2025-07-25 | 13F | We Are One Seven, LLC | 33 745 | 1 350 | ||||||
| 2025-04-15 | 13F | Noble Wealth Management PBC | 82 895 | 18 321,11 | 3 117 | 18 229,41 | ||||
| 2025-07-15 | 13F | McAdam, LLC | 5 313 | 213 | ||||||
| 2025-08-01 | 13F | FSA Advisors, Inc. | 30 454 | 0,07 | 1 218 | 6,47 | ||||
| 2025-08-14 | 13F | Colony Group, LLC | 24 906 | −22,38 | 996 | −17,41 | ||||
| 2025-08-01 | 13F | Corrado Advisors, Llc | 71 430 | −0,66 | 2 858 | 5,70 | ||||
| 2025-08-11 | 13F | Bellwether Advisors, LLC | 204 711 | 1,53 | 8 190 | 8,03 | ||||
| 2025-08-12 | 13F | MAI Capital Management | 59 772 | −37,05 | 2 391 | −33,03 | ||||
| 2025-08-05 | 13F | Mma Asset Management Llc | 13 774 | 88,30 | 551 | 100,36 | ||||
| 2025-07-16 | 13F | Signaturefd, Llc | 54 072 | 0,00 | 2 163 | 6,39 | ||||
| 2025-08-12 | 13F | Waddell & Associates, Llc | 5 030 | 201 | ||||||
| 2025-08-12 | 13F | BlackRock, Inc. | 0 | −100,00 | 0 | |||||
| 2025-07-22 | 13F | Hubbell Strickland Wealth Management, LLC | 5 231 | 209 | ||||||
| 2025-08-14 | 13F | Bank Of America Corp /de/ | 1 793 | 72 | ||||||
| 2025-08-14 | 13F | Snowden Capital Advisors LLC | 9 442 | 0,00 | 378 | 6,20 | ||||
| 2025-08-08 | 13F | Gts Securities Llc | 0 | −100,00 | 0 | |||||
| 2025-07-17 | 13F | Wagner Wealth Management, Llc | 1 980 | 0,00 | 79 | 6,76 | ||||
| 2025-08-14 | 13F | Mercer Global Advisors Inc /adv | 10 179 | 0,00 | 407 | 6,54 | ||||
| 2025-07-28 | 13F | Compass Advisory Group LLC | 68 314 | −8,20 | 2 733 | −2,29 | ||||
| 2025-08-14 | 13F | Kovitz Investment Group Partners, LLC | 1 087 402 | 4,24 | 43 507 | 10,92 | ||||
| 2025-07-28 | 13F | Harbour Investments, Inc. | 309 329 | 210,15 | 12 376 | 230,03 | ||||
| 2025-08-14 | 13F | Citadel Advisors Llc | 8 791 | −69,65 | 352 | −67,74 | ||||
| 2025-07-14 | 13F | Kfg Wealth Management, Llc | 98 690 | 2,94 | 3 949 | 9,54 | ||||
| 2025-08-05 | 13F | WorthPointe, LLC | 5 557 | 0,00 | 222 | 6,73 | ||||
| 2025-08-05 | 13F | Sigma Planning Corp | 12 757 | 6,53 | 510 | 13,33 | ||||
| 2025-05-09 | 13F | Chicago Partners Investment Group LLC | 0 | −100,00 | 0 | |||||
| 2025-07-28 | 13F | Mutual Advisors, LLC | 5 876 | −71,73 | 239 | −69,24 | ||||
| 2025-08-12 | 13F | Long Island Wealth Management, Inc. | 26 524 | 0,00 | 1 061 | 6,42 | ||||
| 2025-07-23 | 13F | Castle Rock Wealth Management, LLC | 87 192 | −5,04 | 3 530 | 1,99 | ||||
| 2025-08-11 | 13F | Rothschild Investment Llc | 330 | 0,00 | 13 | 8,33 | ||||
| 2025-08-04 | 13F | Arkadios Wealth Advisors | 19 862 | 13,91 | 795 | 21,22 | ||||
| 2025-08-14 | 13F | Sunbelt Securities, Inc. | 6 422 | 23 685,19 | 247 | 24 500,00 | ||||
| 2025-07-10 | 13F | Atticus Wealth Management, Llc | 47 728 | 0,00 | 1 910 | 6,41 | ||||
| 2025-08-11 | 13F | WPWealth LLP | 15 320 | 0,00 | 613 | 6,25 | ||||
| 2025-08-14 | 13F | Mml Investors Services, Llc | 87 178 | 0,25 | 3 | 0,00 | ||||
| 2025-08-12 | 13F | AlphaCore Capital LLC | 65 800 | 0,00 | 2 633 | 6,39 | ||||
| 2025-08-13 | 13F | Cresset Asset Management, LLC | 177 944 | −7,27 | 7 120 | −1,33 | ||||
| 2025-08-13 | 13F | Continuum Advisory, LLC | 20 204 | −4,26 | 808 | 1,89 | ||||
| 2025-08-14 | 13F | Alliancebernstein L.p. | 4 595 108 | −1,19 | 183 850 | 5,14 | ||||
| 2025-08-15 | 13F | Chapman Financial Group, Llc | 300 | 0,00 | 12 | 9,09 | ||||
| 2025-04-22 | 13F/A | NorthRock Partners, LLC | 0 | −100,00 | 0 | −100,00 | ||||
| 2025-07-22 | 13F | Miracle Mile Advisors, LLC | 8 352 | −57,72 | 334 | −54,99 | ||||
| 2025-08-14 | 13F/A | Barclays Plc | 1 320 | 762,75 | 0 | |||||
| 2025-08-12 | 13F | Weaver Consulting Group | 54 590 | 3,33 | 2 184 | 9,97 | ||||
| 2025-04-22 | 13F | XML Financial, LLC | 0 | −100,00 | 0 | |||||
| 2025-04-22 | 13F | Madison Wealth Partners, Inc | 0 | −100,00 | 0 | |||||
| 2025-07-10 | 13F | Three Seasons Wealth, LLC | 22 950 | 0,00 | 918 | 6,50 | ||||
| 2025-04-21 | 13F | Nelson, Van Denburg & Campbell Wealth Management Group, LLC | 0 | −100,00 | 0 | |||||
| 2025-08-12 | 13F | Gladstone Institutional Advisory LLC | 6 000 | 0,00 | 240 | 6,67 | ||||
| 2025-08-19 | 13F | Advisory Services Network, LLC | 36 098 | 0,44 | 1 465 | 8,36 | ||||
| 2025-08-12 | 13F | Tradition Wealth Management, LLC | 46 686 | −0,49 | 1 868 | 5,84 | ||||
| 2025-08-19 | 13F | National Asset Management, Inc. | 0 | −100,00 | 0 | |||||
| 2025-08-13 | 13F | Capital Analysts, Inc. | 125 058 | 0,00 | 5 | 25,00 | ||||
| 2025-08-14 | 13F | UBS Group AG | 36 556 | 11 113,50 | 1 463 | 12 083,33 | ||||
| 2025-08-11 | 13F | HighTower Advisors, LLC | 543 141 | −5,67 | 21 731 | 0,38 | ||||
| 2025-07-14 | 13F | Chris Bulman Inc | 50 123 | −2,96 | 2 005 | 3,24 | ||||
| 2025-08-06 | 13F | Vestmark Advisory Solutions, Inc. | 8 350 | 0,00 | 334 | 6,71 | ||||
| 2025-07-16 | 13F | Crown Wealth Group, LLC | 44 169 | 615,29 | 1 767 | 661,64 | ||||
| 2025-07-15 | 13F | BCS Wealth Management | 55 213 | 7,32 | 2 | 100,00 | ||||
| 2025-08-12 | 13F | Wood Tarver Financial Group, LLC | 7 687 | −38,71 | 0 | −100,00 | ||||
| 2025-08-14 | 13F | Garden State Investment Advisory Services LLC | 11 080 | −35,41 | 443 | −31,32 | ||||
| 2025-07-02 | 13F | HBW Advisory Services LLC | 14 129 | −1,90 | 565 | 4,44 | ||||
| 2025-07-24 | 13F | Bernard Wealth Management Corp. | 3 037 | 0,00 | 122 | 6,14 | ||||
| 2025-07-14 | 13F | Southland Equity Partners LLC | 67 694 | −0,10 | 2 708 | 6,32 | ||||
| 2025-08-07 | 13F | Tfo-tdc, Llc | 0 | −100,00 | 0 | |||||
| 2025-08-14 | 13F | Diversify Advisory Services, LLC | 10 625 | 0,00 | 436 | 9,57 | ||||
| 2025-08-08 | 13F | Kingsview Wealth Management, LLC | 5 815 | −38,85 | 233 | −35,01 | ||||
| 2025-07-10 | 13F | ARS Wealth Advisors Group, LLC | 11 601 | −12,59 | 464 | −7,01 | ||||
| 2025-07-17 | 13F | Janney Montgomery Scott LLC | 121 509 | 3,08 | 5 | 0,00 | ||||
| 2025-08-13 | 13F | Townsquare Capital Llc | 16 360 | −85,87 | 655 | −84,98 | ||||
| 2025-08-13 | 13F | Cerity Partners LLC | 637 470 | 2 060,92 | 25 505 | 2 199,82 | ||||
| 2025-07-21 | 13F | Catalina Capital Group, LLC | 20 794 | −80,55 | 832 | −79,32 | ||||
| 2025-08-08 | 13F | Cetera Investment Advisers | 275 901 | 0,76 | 11 039 | 7,22 | ||||
| 2025-07-24 | 13F | IFP Advisors, Inc | 43 076 | 1,27 | 1 723 | 7,75 | ||||
| 2025-08-12 | 13F | Leigh Baldwin & Co., Llc | 0 | −100,00 | 0 | |||||
| 2025-08-12 | 13F/A | Castellan Group, LLC | 17 661 | 0,00 | 707 | 6,33 | ||||
| 2025-08-14 | 13F | Frisch Financial Group, Inc. | 38 802 | −1,40 | 2 | 0,00 | ||||
| 2025-07-21 | 13F | Ameritas Advisory Services, LLC | 848 | 34 | ||||||
| 2025-07-14 | 13F | U.S. Capital Wealth Advisors, LLC | 12 750 | −32,26 | 510 | −27,86 | ||||
| 2025-07-22 | 13F | Beacon Financial Advisory LLC | 12 787 | 10,01 | 512 | 16,93 | ||||
| 2025-08-07 | 13F | Sound View Wealth Advisors Group, LLC | 6 603 | −10,38 | 264 | −4,69 | ||||
| 2025-08-05 | 13F | BCGM Wealth Management, LLC | 5 752 | 0,00 | 230 | 6,48 | ||||
| 2025-07-11 | 13F | Farther Finance Advisors, LLC | 54 577 | −8,37 | 2 184 | −2,72 | ||||
| 2025-05-15 | 13F | Royal Bank Of Canada | 0 | −100,00 | 0 | |||||
| 2025-08-12 | 13F | Change Path, LLC | 19 819 | −1,87 | 793 | 4,35 | ||||
| 2025-08-13 | 13F | EverSource Wealth Advisors, LLC | 1 985 | 0,00 | 79 | 6,76 | ||||
| 2025-08-12 | 13F | Archer Investment Corp | 4 100 | 0,00 | 164 | 6,49 | ||||
| 2025-08-15 | 13F | Nikulski Financial, Inc. | 5 800 | 0,00 | 232 | 6,42 | ||||
| 2025-08-01 | 13F | Stuart Chaussee & Associates, Inc. | 350 | −68,18 | 14 | −65,85 | ||||
| 2025-08-08 | 13F | Emerald Investment Partners, Llc | 3 500 | 0,00 | 140 | 6,87 | ||||
| 2025-07-31 | 13F | Buckingham Strategic Partners | 10 475 | 419 | ||||||
| 2025-07-29 | 13F | BKD Wealth Advisors, LLC | 71 608 | −9,53 | 2 865 | −3,73 | ||||
| 2025-08-11 | 13F | Principal Securities, Inc. | 2 932 | 0,00 | 117 | 4,46 | ||||
| 2025-07-14 | 13F | CRA Financial Services, LLC | 168 383 | −0,03 | 6 737 | 6,38 | ||||
| 2025-07-30 | 13F | Phoenix Holdings Ltd. | 18 640 | 0,00 | 744 | 5,84 | ||||
| 2025-08-14 | 13F | Certified Advisory Corp | 28 895 | −4,89 | 1 156 | 1,23 | ||||
| 2025-08-14 | 13F | Mariner, LLC | 152 400 | 25,47 | 6 098 | 33,50 | ||||
| 2025-08-06 | 13F | Csenge Advisory Group | 16 750 | 0,00 | 650 | 6,22 | ||||
| 2025-05-14 | 13F | Northwestern Mutual Wealth Management Co | 0 | −100,00 | 0 | |||||
| 2025-08-01 | 13F | Gwn Securities Inc. | 5 562 | −1,31 | 223 | 5,21 | ||||
| 2025-08-08 | 13F | Firestone Capital Management | 12 474 | 0,00 | 499 | 6,40 | ||||
| 2025-07-28 | 13F | Axxcess Wealth Management, Llc | 9 515 | 0,00 | 381 | 6,44 | ||||
| 2025-08-12 | 13F | Winnow Wealth Llc | 0 | 0 | ||||||
| 2025-07-24 | 13F | Vantage Point Financial LLC | 6 731 | 24,74 | 269 | 33,17 | ||||
| 2025-08-12 | 13F | Jpmorgan Chase & Co | 800 | −92,33 | 32 | −91,84 | ||||
| 2025-08-13 | 13F | Beacon Pointe Advisors, LLC | 194 440 | −4,13 | 7 780 | 2,01 | ||||
| 2025-08-15 | 13F | Captrust Financial Advisors | 16 240 | 0,00 | 650 | 6,39 | ||||
| 2025-08-11 | 13F | Anfield Capital Management, LLC | 322 | 13 | ||||||
| 2025-07-24 | 13F | Blair William & Co/il | 766 577 | −9,85 | 30 671 | −4,08 | ||||
| 2025-09-04 | 13F/A | Advisor Group Holdings, Inc. | 1 207 997 | −4,21 | 48 332 | 1,93 |