Grundläggande statistik
| Institutionella ägare | 182 total, 182 long only, 0 short only, 0 long/short - change of 5,14% MRQ |
| Genomsnittlig portföljallokering | 0.2604 % - change of −21,08% MRQ |
| Institutionella aktier (lång) | 4 936 891 (ex 13D/G) - change of 0,67MM shares 15,79% MRQ |
| Institutionellt värde (lång) | $ 609 608 USD ($1000) |
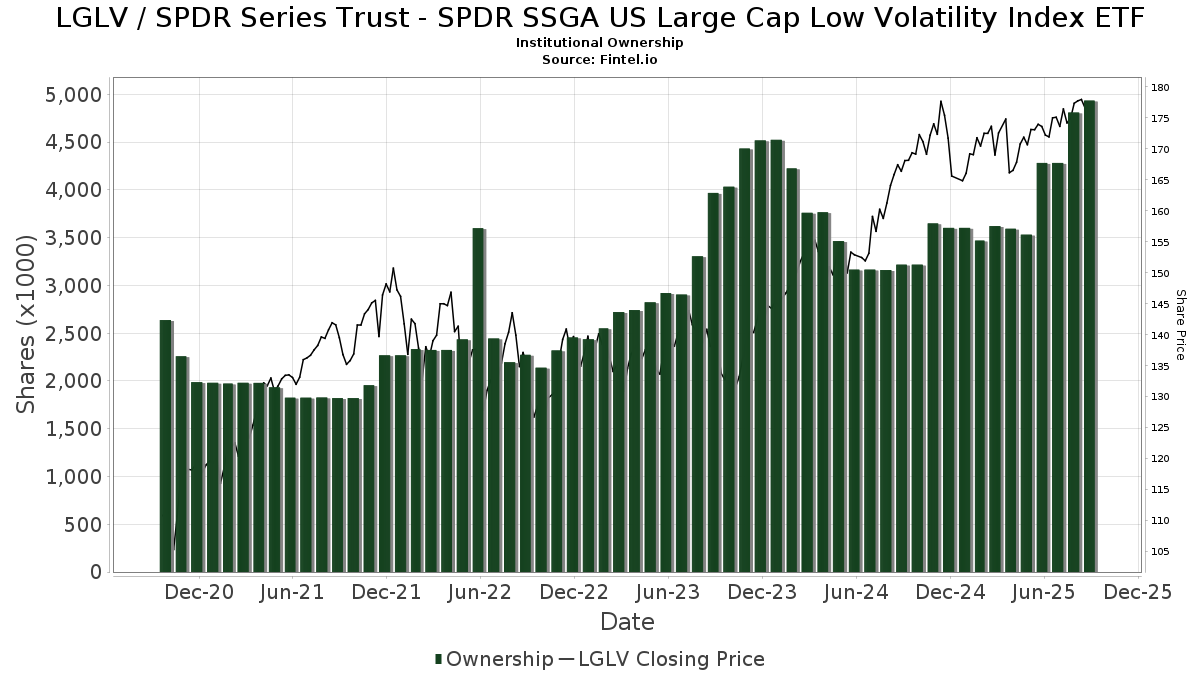
Institutionellt ägande och aktieägare
SPDR Series Trust - SPDR SSGA US Large Cap Low Volatility Index ETF (US:LGLV) har 182 Institutionella ägare och aktieägare som har lämnat in 13D/G- eller 13F-formulär till Securities Exchange Commission (SEC). Dessa institut innehar totalt 4,936,891 aktier. Största aktieägare inkluderar Cwm, Llc, Syntegra Private Wealth Group, LLC, Baltimore-Washington Financial Advisors, Inc., Gerber Kawasaki Wealth & Investment Management, LPL Financial LLC, Congress Wealth Management LLC / DE /, Jpmorgan Chase & Co, Morgan Stanley, DORVAL Corp, and State Street Corp .
SPDR Series Trust - SPDR SSGA US Large Cap Low Volatility Index ETF (ARCA:LGLV) Institutionell ägarstruktur visar institutioners och fonders nuvarande positioner i företaget, samt de senaste förändringarna i positionernas storlek. Större aktieägare kan vara enskilda investerare, fonder, hedgefonder eller institutioner. Bilaga 13D visar att investeraren äger (eller ägde) mer än 5% av företaget och avser (eller avsåg) att aktivt eftersträva en förändring av affärsstrategin. Schedule 13G indikerar en passiv investering på över 5%.
The share price as of September 8, 2025 is 177,38 / share. Previously, on September 9, 2024, the share price was 166,91 / share. This represents an increase of 6,27% over that period.
Fondsentimentets poäng
Fondsentimentet poängen(fka Ägarackumulation-poäng) visar vilka aktier som är mest köpta av fonder. Det är resultatet av en sofistikerad kvantitativ flerfaktormodell som identifierar företag med de högsta nivåerna av institutionell ackumulering. Poängsättningsmodellen använder en kombination av den totala ökningen av redovisade ägare, förändringarna i portföljallokeringarna för dessa ägare och andra mått. Siffran sträcker sig från 0 till 100, där högre siffror indikerar en högre nivå av ackumulering i förhållande till sina konkurrenter, och 50 är genomsnittet.
Uppdateringsfrekvens: Dagligen
Se Ownership Explorer, som innehåller en lista över de högst rankade företagen.
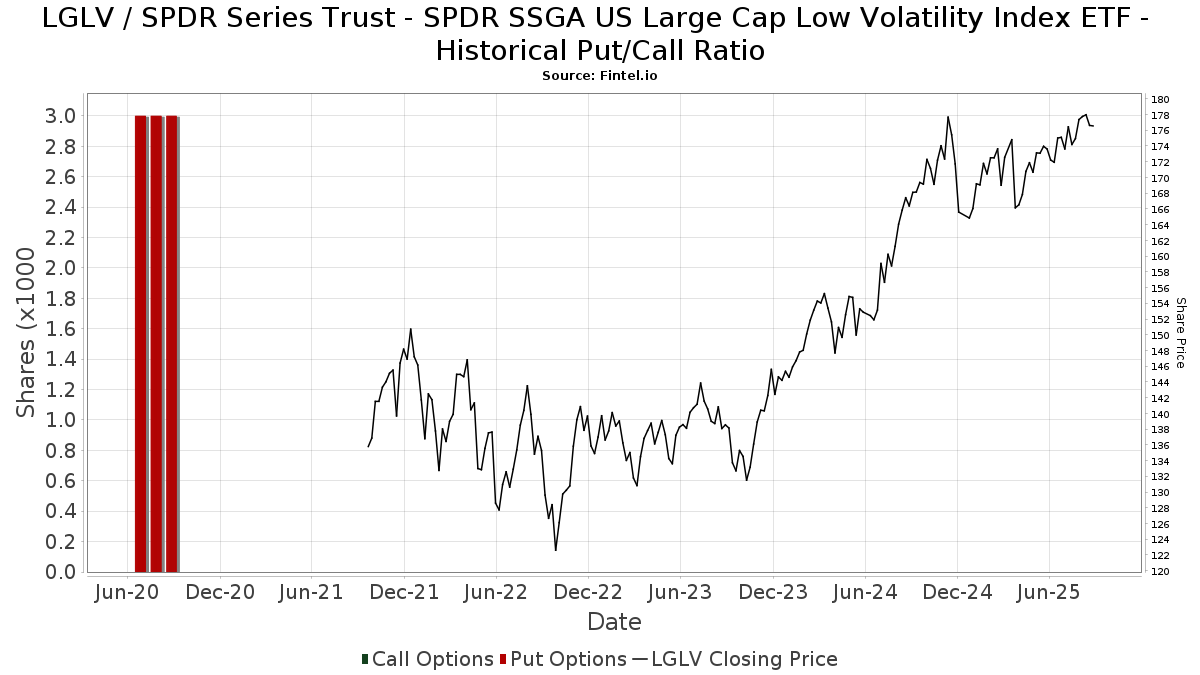
Institutionell sälj/köp-kvot
Förutom att rapportera vanliga eget kapital- och skuldemissioner måste institutioner med mer än 100MM tillgångar under förvaltning också avslöja sina innehav av sälj- och köpoptioner. Eftersom säljoptioner i allmänhet indikerar ett negativt sentiment och köpoptioner indikerar ett positivt sentiment, kan vi få en uppfattning om det övergripande institutionella sentimentet genom att plotta förhållandet mellan säljoptioner och köpoptioner. Diagrammet till höger visar det historiska förhållandet mellan sälj- och köpoptioner för detta instrument.
Genom att använda sälj/köp-kvoten som en indikator på aktieägarnas sentiment undviker man en av de största bristerna med att använda det totala institutionella ägandet, nämligen att en betydande del av de förvaltade tillgångarna investeras passivt för att följa index. Passivt förvaltade fonder köper vanligtvis inte optioner, så indikatorn för sälj/köp-kvoten ger en bättre bild av stämningen i aktivt förvaltade fonder.
13F- och NPORT-arkiveringar
Detaljer om 13F-arkiveringar är gratis. Detaljer om NP-arkiveringar kräver ett premiummedlemskap. Gröna rader indikerar nya positioner. Röda rader indikerar stängda positioner. Klicka på länk symbolen för att se hela transaktionshistoriken.
Uppgradera
för att låsa upp premiumdata och exportera till Excel ![]() .
.
| Fil Datum | Källa | Investerare | Typ | Genomsnittligt pris (beräknat) |
Aktier | Δ Aktier (%) |
Rapporterat värde (1000 USD) |
Δ Värde (%) |
Portföljallokering (%) |
|
|---|---|---|---|---|---|---|---|---|---|---|
| 2025-07-31 | 13F | Sage Mountain Advisors LLC | 18 958 | 0,00 | 3 310 | 0,33 | ||||
| 2025-08-05 | 13F | Hutchens & Kramer Investment Management Group, LLC | 3 209 | −5,09 | 564 | −4,25 | ||||
| 2025-07-16 | 13F/A | CX Institutional | 41 | 0,00 | 0 | |||||
| 2025-08-14 | 13F | Avant Capital LLC | 3 246 | 3,34 | 567 | 3,66 | ||||
| 2025-07-30 | 13F | Paul Damon & Associates, Inc. | 6 183 | −0,48 | 1 080 | −0,19 | ||||
| 2025-08-14 | 13F | Mercer Global Advisors Inc /adv | 1 786 | −5,30 | 312 | −5,18 | ||||
| 2025-07-29 | 13F | Stratos Wealth Partners, LTD. | 2 683 | −4,49 | 469 | −4,10 | ||||
| 2025-08-14 | 13F | Qube Research & Technologies Ltd | 90 | 16 | ||||||
| 2025-08-04 | 13F | Integrity Alliance, Llc. | 57 768 | −35,15 | 10 087 | −34,95 | ||||
| 2025-08-05 | 13F | Tsfg, Llc | 3 718 | −0,99 | 1 | |||||
| 2025-07-22 | 13F | Legacy Trust | 0 | −100,00 | 0 | |||||
| 2025-07-29 | 13F | Private Trust Co Na | 901 | −6,24 | 157 | −5,99 | ||||
| 2025-07-21 | 13F | Ameriflex Group, Inc. | 91 | 0,00 | 16 | 0,00 | ||||
| 2025-07-31 | 13F | Cambridge Investment Research Advisors, Inc. | 12 828 | −42,54 | 2 | −33,33 | ||||
| 2025-08-01 | 13F | Brookwood Investment Group LLC | 1 703 | 0,00 | 297 | 0,34 | ||||
| 2025-07-11 | 13F | SILVER OAK SECURITIES, Inc | 0 | −100,00 | 0 | |||||
| 2025-08-08 | 13F | Avantax Advisory Services, Inc. | 4 751 | −41,97 | 830 | −41,78 | ||||
| 2025-08-11 | 13F | Wealthgarden F.s. Llc | 1 665 | −3,42 | 289 | −4,00 | ||||
| 2025-08-27 | 13F | Barnes Wealth Management Group, Inc | 3 713 | 39,90 | 648 | 40,56 | ||||
| 2025-07-16 | 13F | Signaturefd, Llc | 530 | 0,00 | 93 | 0,00 | ||||
| 2025-07-25 | 13F | Atria Wealth Solutions, Inc. | 1 311 | 229 | ||||||
| 2025-08-14 | 13F | Goldman Sachs Group Inc | 10 760 | −65,02 | 1 879 | −64,92 | ||||
| 2025-08-11 | 13F | Western Wealth Management, LLC | 1 341 | 0,00 | 234 | 0,43 | ||||
| 2025-08-12 | 13F | Financial Advocates Investment Management | 6 961 | −2,81 | 1 215 | −2,49 | ||||
| 2025-07-22 | 13F | Iowa State Bank | 1 660 | −31,09 | 290 | −31,03 | ||||
| 2025-07-29 | 13F | Portland Financial Advisors Inc | 6 062 | 0,00 | 1 058 | 0,28 | ||||
| 2025-08-12 | 13F | Steward Partners Investment Advisory, Llc | 1 501 | −3,22 | 262 | −2,60 | ||||
| 2025-08-11 | 13F | Berkeley, Inc | 2 740 | 0,18 | 478 | 0,42 | ||||
| 2025-05-12 | 13F | Independent Advisor Alliance | 0 | −100,00 | 0 | |||||
| 2025-08-14 | 13F | IHT Wealth Management, LLC | 8 270 | 3,79 | 1 444 | 4,18 | ||||
| 2025-07-16 | 13F | Independent Wealth Network Inc. | 5 970 | −2,56 | 1 042 | −2,25 | ||||
| 2025-08-14 | 13F | Harwood Advisory Group, LLC | 2 254 | −19,64 | 394 | −15,12 | ||||
| 2025-08-13 | 13F | Millington Financial Advisors, LLC | 1 734 | −2,42 | 306 | 3,39 | ||||
| 2025-08-14 | 13F | Bank Of America Corp /de/ | 91 399 | 4,63 | 15 959 | 4,98 | ||||
| 2025-08-06 | 13F | Wedbush Securities Inc | 3 890 | −4,14 | 1 | |||||
| 2025-08-18 | 13F | Geneos Wealth Management Inc. | 369 | 5,43 | 64 | 6,67 | ||||
| 2025-07-31 | 13F | Moloney Securities Asset Management, LLC | 1 379 | −5,87 | 241 | −5,51 | ||||
| 2025-08-26 | 13F/A | Thrivent Financial For Lutherans | 2 261 | 0 | ||||||
| 2025-08-11 | 13F | Vista Cima Wealth Management LLC | 3 044 | 0,00 | 532 | 0,38 | ||||
| 2025-08-14 | 13F | Comerica Bank | 311 | −1,27 | 54 | 0,00 | ||||
| 2025-08-14 | 13F | Daiwa Securities Group Inc. | 9 500 | −5,19 | 2 | 0,00 | ||||
| 2025-08-15 | 13F | Equitable Holdings, Inc. | 0 | −100,00 | 0 | |||||
| 2025-07-30 | 13F | Advantage Trust Co | 219 | 38 | ||||||
| 2025-08-13 | 13F | Fisher Asset Management, LLC | 1 227 | 0,00 | 214 | 0,47 | ||||
| 2025-08-12 | 13F | Jpmorgan Chase & Co | 175 531 | 148,74 | 30 649 | 149,56 | ||||
| 2025-07-09 | 13F | Riversedge Advisors, Llc | 4 936 | −17,86 | 862 | −17,61 | ||||
| 2025-07-17 | 13F | ERn Financial, LLC | 0 | −100,00 | 0 | |||||
| 2025-08-08 | 13F | Fortis Group Advisors, LLC | 7 210 | −2,96 | 1 251 | −3,33 | ||||
| 2025-08-11 | 13F | First American Trust, Fsb | 32 117 | 3,78 | 5 608 | 4,10 | ||||
| 2025-08-06 | 13F | Paladin Advisory Group, LLC | 304 | 0,00 | 53 | 1,92 | ||||
| 2025-08-06 | 13F | Founders Financial Securities Llc | 74 041 | 81,50 | 12 928 | 87,44 | ||||
| 2025-08-14 | 13F | Abound Financial, Llc | 4 558 | −2,25 | 796 | −1,97 | ||||
| 2025-08-14 | 13F | Mariner, LLC | 10 089 | 19,47 | 1 762 | 19,88 | ||||
| 2025-07-09 | 13F | Reyes Financial Architecture, Inc. | 40 | 0,00 | 7 | 0,00 | ||||
| 2025-08-13 | 13F | Jones Financial Companies Lllp | 2 409 | 44,25 | 418 | 45,30 | ||||
| 2025-08-06 | 13F | Atlantic Union Bankshares Corp | 17 | 3 | ||||||
| 2025-07-25 | 13F | Cwm, Llc | 1 380 611 | 69,48 | 241 | 70,92 | ||||
| 2025-08-15 | 13F | Tower Research Capital LLC (TRC) | 472 | −79,97 | 82 | −80,00 | ||||
| 2025-07-28 | 13F | Harbour Investments, Inc. | 4 237 | 2,96 | 740 | 3,21 | ||||
| 2025-08-14 | 13F | Aqr Capital Management Llc | 67 466 | 3,39 | 11 780 | 3,73 | ||||
| 2025-08-14 | 13F | Prestige Wealth Management Group LLC | 0 | −100,00 | 0 | |||||
| 2025-08-14 | 13F | Sei Investments Co | 25 127 | −6,77 | 4 387 | −6,46 | ||||
| 2025-07-22 | 13F | McNaughton Wealth Management, LLC | 15 834 | 4,38 | 2 765 | 4,70 | ||||
| 2025-07-21 | 13F | Investment Planning Advisors, Inc. | 1 300 | 0,00 | 227 | 0,00 | ||||
| 2025-08-12 | 13F | SRS Capital Advisors, Inc. | 619 | 0,49 | 108 | 0,93 | ||||
| 2025-08-14 | 13F | GWM Advisors LLC | 667 | −76,93 | 116 | −76,94 | ||||
| 2025-04-21 | 13F | Nelson, Van Denburg & Campbell Wealth Management Group, LLC | 0 | −100,00 | 0 | |||||
| 2025-08-08 | 13F | Capital Investment Advisory Services, LLC | 17 | 0,00 | 3 | 0,00 | ||||
| 2025-07-28 | 13F | Cypress Wealth Services, LLC | 5 166 | 0,00 | 902 | 0,33 | ||||
| 2025-07-11 | 13F | Mallini Complete Financial Planning LLC | 430 | 2,63 | ||||||
| 2025-08-11 | 13F | Private Advisor Group, LLC | 6 537 | 0,23 | 1 141 | 0,53 | ||||
| 2025-07-24 | 13F | Stonebridge Financial Group, LLC | 1 330 | 232 | ||||||
| 2025-08-01 | 13F | Envestnet Asset Management Inc | 13 241 | 14,52 | 2 312 | 14,91 | ||||
| 2025-08-08 | 13F | Thrive Capital Management, LLC | 5 256 | 918 | ||||||
| 2025-08-14 | 13F | Old Mission Capital Llc | 0 | −100,00 | 0 | |||||
| 2025-08-14 | 13F | Stifel Financial Corp | 1 442 | −66,37 | 252 | −66,35 | ||||
| 2025-08-08 | 13F | Good Life Advisors, LLC | 2 350 | 410 | ||||||
| 2025-05-15 | 13F | Gts Securities Llc | 0 | −100,00 | 0 | |||||
| 2025-08-14 | 13F | Two Sigma Investments, Lp | 21 410 | 3 738 | ||||||
| 2025-04-11 | 13F | Signal Advisors Wealth, LLC | 0 | −100,00 | 0 | |||||
| 2025-08-06 | 13F | Ethos Financial Group, LLC | 37 037 | 88,81 | 6 467 | 89,45 | ||||
| 2025-08-13 | 13F | Gateway Wealth Partners, LLC | 4 710 | 822 | ||||||
| 2025-08-18 | 13F | Front Row Advisors LLC | 60 | 0,00 | 10 | 0,00 | ||||
| 2025-08-14 | 13F | Win Advisors, Inc | 0 | −100,00 | 0 | |||||
| 2025-08-06 | 13F | AE Wealth Management LLC | 2 353 | −4,31 | 411 | −3,98 | ||||
| 2025-08-07 | 13F | Efficient Advisors, LLC | 4 671 | −34,83 | 816 | −34,64 | ||||
| 2025-07-30 | 13F | Caliber Wealth Management, LLC / KS | 11 309 | −22,23 | 1 975 | −21,98 | ||||
| 2025-08-14 | 13F | Federation des caisses Desjardins du Quebec | 100 | 0,00 | 17 | 0,00 | ||||
| 2025-08-14 | 13F | Legacy Advisory Services, LLC | 10 813 | 0,30 | 1 888 | 0,64 | ||||
| 2025-08-14 | 13F | Royal Bank Of Canada | 1 542 | 2,59 | 269 | 3,07 | ||||
| 2025-07-30 | 13F | Bogart Wealth, LLC | 1 067 | −0,74 | 186 | −0,53 | ||||
| 2025-07-22 | 13F | Merit Financial Group, LLC | 1 967 | −0,56 | 343 | −0,29 | ||||
| 2025-07-11 | 13F | Farther Finance Advisors, LLC | 3 171 | −52,56 | 554 | −52,49 | ||||
| 2025-08-12 | 13F | J.w. Cole Advisors, Inc. | 3 518 | 8,48 | 614 | 8,87 | ||||
| 2025-07-25 | 13F | Commonwealth Financial Services, LLC | 2 311 | 0,00 | 403 | 0,25 | ||||
| 2025-05-19 | 13F | Heck Capital Advisors, LLC | 0 | 0 | ||||||
| 2025-07-22 | 13F | Miracle Mile Advisors, LLC | 7 168 | −8,66 | 1 252 | −8,35 | ||||
| 2025-08-11 | 13F | Aptus Capital Advisors, LLC | 2 186 | 0,09 | 382 | 0,26 | ||||
| 2025-07-28 | 13F | Mutual Advisors, LLC | 3 561 | −0,28 | 629 | 4,49 | ||||
| 2025-07-15 | 13F | Norden Group Llc | 8 655 | −3,73 | 1 511 | −3,39 | ||||
| 2025-08-14 | 13F | Wiley Bros.-aintree Capital, Llc | 2 154 | 0,47 | 376 | 2,17 | ||||
| 2025-08-06 | 13F | Commonwealth Equity Services, Llc | 16 447 | −1,82 | 3 | 0,00 | ||||
| 2025-07-10 | 13F | High Net Worth Advisory Group LLC | 2 400 | 0,00 | 419 | 0,48 | ||||
| 2025-08-13 | 13F | VestGen Advisors, LLC | 50 039 | 8 740 | ||||||
| 2025-08-01 | 13F | Advisory Alpha, LLC | 1 362 | −3,75 | 238 | −3,66 | ||||
| 2025-08-12 | 13F | Proequities, Inc. | 0 | 0 | ||||||
| 2025-07-30 | 13F | Insight Advisors, LLC/ PA | 2 740 | −7,40 | 479 | −7,18 | ||||
| 2025-08-14 | 13F | Ieq Capital, Llc | 92 605 | 0,00 | 16 170 | 0,33 | ||||
| 2025-08-14 | 13F | UBS Group AG | 13 564 | 8,24 | 2 368 | 8,62 | ||||
| 2025-07-30 | 13F | Brookstone Capital Management | 2 812 | −10,62 | 491 | −10,24 | ||||
| 2025-08-14 | 13F | CoreCap Advisors, LLC | 31 | 0,00 | 5 | 0,00 | ||||
| 2025-08-08 | 13F | Thoroughbred Financial Services, Llc | 10 139 | −8,15 | 2 | 0,00 | ||||
| 2025-05-15 | 13F | WPG Advisers, LLC | 0 | −100,00 | 0 | |||||
| 2025-07-28 | 13F | Rosenberg Matthew Hamilton | 97 | −17,80 | 17 | −20,00 | ||||
| 2025-08-11 | 13F | Blue Bell Private Wealth Management, Llc | 160 | 0,00 | 28 | 0,00 | ||||
| 2025-07-24 | 13F | Blair William & Co/il | 323 | 56 | ||||||
| 2025-07-30 | 13F | Syntegra Private Wealth Group, LLC | 698 710 | 8,15 | 122 002 | 8,50 | ||||
| 2025-08-14 | 13F | Horizon Investments, LLC | 73 961 | 76,78 | 12 914 | 77,37 | ||||
| 2025-07-30 | 13F | Strategic Blueprint, LLC | 4 915 | −0,95 | 858 | −0,58 | ||||
| 2025-07-15 | 13F | Aspire Capital Advisors LLC | 1 912 | 54,32 | 334 | 54,88 | ||||
| 2025-08-14 | 13F | Ameriprise Financial Inc | 27 248 | 468,38 | 4 623 | 454,20 | ||||
| 2025-07-14 | 13F | Park Avenue Securities Llc | 1 639 | 0 | ||||||
| 2025-07-30 | 13F | Journey Advisory Group, LLC | 21 005 | 2,84 | 3 668 | 3,18 | ||||
| 2025-08-18 | 13F | Arq Wealth Advisors, Llc | 2 742 | 0,00 | 477 | 0,00 | ||||
| 2025-07-14 | 13F | Painted Porch Advisors LLC | 22 | 0,00 | 4 | 0,00 | ||||
| 2025-08-06 | 13F/A | Flagship Private Wealth, LLC | 6 445 | 1,72 | 1 125 | 2,09 | ||||
| 2025-07-30 | 13F | Pacific Sun Financial Corp | 1 150 | 0,00 | 201 | 0,00 | ||||
| 2025-08-12 | 13F | BlackRock, Inc. | 346 | 0,00 | 60 | 0,00 | ||||
| 2025-08-13 | 13F | Vermillion & White Wealth Management Group, LLC | 37 | −21,28 | 7 | −25,00 | ||||
| 2025-07-24 | 13F | Us Bancorp \de\ | 43 | 2,38 | 7 | 0,00 | ||||
| 2025-08-07 | 13F | Hughes Financial Services, LLC | 1 155 | 0,00 | 202 | 0,50 | ||||
| 2025-07-23 | 13F | Valmark Advisers, Inc. | 26 132 | 12,29 | 4 563 | 12,64 | ||||
| 2025-07-30 | 13F | Prosperity Financial Group, Inc. | 1 621 | 283 | ||||||
| 2025-07-29 | 13F | Elevation Capital Advisory, LLC | 0 | −100,00 | 0 | |||||
| 2025-07-25 | 13F | Apollon Financial, LLC | 5 155 | 106,61 | 900 | 107,37 | ||||
| 2025-07-17 | 13F | Janney Montgomery Scott LLC | 1 400 | 0,00 | 0 | |||||
| 2025-09-04 | 13F/A | Advisor Group Holdings, Inc. | 28 001 | 37,27 | 4 890 | 37,71 | ||||
| 2025-08-14 | 13F/A | Skopos Labs, Inc. | 60 | 10 | ||||||
| 2025-08-06 | 13F | RFG - Bristol Wealth Advisors, LLC | 4 960 | 866 | ||||||
| 2025-08-13 | 13F | Milestone Investment Advisors LLC | 8 967 | −4,59 | 1 566 | −4,28 | ||||
| 2025-05-12 | 13F | Sandy Spring Bank | 16 | 0,00 | 3 | 0,00 | ||||
| 2025-07-24 | 13F | Ulland Investment Advisors, LLC | 187 | 289,58 | 0 | |||||
| 2025-08-13 | 13F | BCJ Capital Management, LLC | 1 603 | 0,50 | 280 | 0,72 | ||||
| 2025-08-04 | 13F | Assetmark, Inc | 128 | −5,19 | 22 | −4,35 | ||||
| 2025-08-05 | 13F | Magnolia Capital Advisors Llc | 42 893 | 7 490 | ||||||
| 2025-07-21 | 13F | Empirical Financial Services, LLC d.b.a. Empirical Wealth Management | 3 855 | −1,28 | 673 | −0,88 | ||||
| 2025-07-28 | 13F | DORVAL Corp | 114 883 | 2,61 | 20 060 | 2,50 | ||||
| 2025-07-29 | 13F | Signature Estate & Investment Advisors Llc | 1 438 | −6,32 | 251 | −5,99 | ||||
| 2025-08-13 | 13F | GeoWealth Management, LLC | 0 | −100,00 | 0 | |||||
| 2025-07-10 | 13F | HF Advisory Group, LLC | 30 370 | 4,27 | 5 303 | 4,60 | ||||
| 2025-07-09 | 13F | Pallas Capital Advisors LLC | 11 617 | 2 028 | ||||||
| 2025-08-14 | 13F | Gerber Kawasaki Wealth & Investment Management | 259 539 | −0,60 | 45 318 | −0,28 | ||||
| 2025-07-15 | 13F | Sheets Smith Wealth Management | 4 798 | 0,00 | 838 | 0,24 | ||||
| 2025-07-08 | 13F | Nbc Securities, Inc. | 408 | 0,00 | 0 | |||||
| 2025-08-12 | 13F | O'shaughnessy Asset Management, Llc | 294 | −23,24 | 51 | −22,73 | ||||
| 2025-08-14 | 13F | Citadel Advisors Llc | 1 364 | 238 | ||||||
| 2025-08-15 | 13F | Morgan Stanley | 168 069 | −0,08 | 29 347 | 0,25 | ||||
| 2025-08-14 | 13F | Cardiff Park Advisors, Llc | 2 719 | 0,00 | 475 | 0,21 | ||||
| 2025-08-12 | 13F | Calton & Associates, Inc. | 1 323 | 4,50 | 231 | 4,55 | ||||
| 2025-07-21 | 13F | Ameritas Advisory Services, LLC | 0 | −100,00 | 0 | |||||
| 2025-08-18 | 13F | Second Line Capital, LLC | 2 186 | 0,09 | 382 | 0,26 | ||||
| 2025-08-13 | 13F | EverSource Wealth Advisors, LLC | 9 | 0,00 | 2 | 0,00 | ||||
| 2025-08-15 | 13F | WFA of San Diego, LLC | 6 | −96,15 | 1 | −96,15 | ||||
| 2025-07-22 | 13F | Olistico Wealth, LLC | 57 | 0,00 | 10 | 0,00 | ||||
| 2025-08-13 | 13F | JBR Co Financial Management Inc | 2 531 | 442 | ||||||
| 2025-08-13 | 13F | Baltimore-Washington Financial Advisors, Inc. | 279 627 | 1,46 | 48 826 | 1,79 | ||||
| 2025-08-12 | 13F | Cornerstone Wealth Management, LLC | 1 678 | 8,40 | 293 | 8,55 | ||||
| 2025-08-11 | 13F | HighTower Advisors, LLC | 2 360 | 0,00 | 412 | 0,49 | ||||
| 2025-08-11 | 13F | Tidemark, LLC | 33 | −42,11 | 6 | −44,44 | ||||
| 2025-08-14 | 13F | State Street Corp | 103 795 | 99,15 | 18 124 | 99,81 | ||||
| 2025-07-22 | 13F | Financial Insights, Inc. | 7 219 | −2,97 | 1 261 | −2,63 | ||||
| 2025-08-05 | 13F | Dunhill Financial, LLC | 0 | 0 | ||||||
| 2025-08-08 | 13F | Cornerstone Advisors Asset Management, Inc | 0 | −100,00 | 0 | |||||
| 2025-07-10 | 13F | Wealth Enhancement Advisory Services, Llc | 21 295 | −22,48 | 3 747 | −21,65 | ||||
| 2025-04-15 | 13F | Eagle Capital Management, LLC | 0 | −100,00 | 0 | |||||
| 2025-07-21 | 13F | Barrett & Company, Inc. | 1 054 | 0,00 | 184 | 0,55 | ||||
| 2025-08-05 | 13F | Roffman Miller Associates Inc /pa/ | 12 094 | 0,40 | 2 112 | 0,72 | ||||
| 2025-07-22 | 13F | Accel Wealth Management | 1 375 | 0,00 | 240 | 0,42 | ||||
| 2025-08-14 | 13F | Mml Investors Services, Llc | 2 883 | 21,19 | 1 | |||||
| 2025-08-14 | 13F | Jane Street Group, Llc | 0 | −100,00 | 0 | |||||
| 2025-08-14 | 13F | Mission Creek Capital Partners, Inc. | 5 816 | −4,40 | 1 015 | −4,06 | ||||
| 2025-08-05 | 13F | Flynn Zito Capital Management, Llc | 1 175 | 0,51 | 205 | 0,99 | ||||
| 2025-08-13 | 13F | Northwestern Mutual Wealth Management Co | 6 558 | −3,94 | 1 145 | −3,62 | ||||
| 2025-08-14 | 13F | Wells Fargo & Company/mn | 89 | 36,92 | 15 | 36,36 | ||||
| 2025-05-15 | 13F | Sykon Capital Llc | 0 | −100,00 | 0 | −100,00 | ||||
| 2025-08-08 | 13F | Comprehensive Financial Planning, Inc./PA | 252 | 0,80 | 44 | 0,00 | ||||
| 2025-08-12 | 13F | LPL Financial LLC | 195 209 | 15,43 | 34 085 | 15,81 | ||||
| 2025-08-04 | 13F | Spire Wealth Management | 168 | 32,28 | 29 | 31,82 | ||||
| 2025-08-19 | 13F | Newbridge Financial Services Group, Inc. | 306 | 0,00 | 53 | 0,00 | ||||
| 2025-08-14 | 13F | Susquehanna International Group, Llp | 8 739 | 61,83 | 1 526 | 62,41 | ||||
| 2025-08-08 | 13F | Foundations Investment Advisors, LLC | 0 | −100,00 | 0 | |||||
| 2025-08-14 | 13F | Atomi Financial Group, Inc. | 3 786 | −2,12 | 661 | −1,78 | ||||
| 2025-08-08 | 13F | Cetera Investment Advisers | 13 755 | 55,02 | 2 402 | 55,51 | ||||
| 2025-07-10 | 13F | ARS Wealth Advisors Group, LLC | 2 342 | 0,30 | 409 | 0,49 | ||||
| 2025-08-08 | 13F | Bouchey Financial Group Ltd | 1 400 | 0,00 | 244 | 0,41 | ||||
| 2025-08-14 | 13F | Integrated Wealth Concepts LLC | 4 796 | 0,99 | 837 | 1,33 | ||||
| 2025-04-23 | 13F | Fourth Dimension Wealth, LLC | 0 | −100,00 | 0 | |||||
| 2025-08-14 | 13F | Fmr Llc | 2 525 | 14,15 | 441 | 14,29 | ||||
| 2025-08-14 | 13F | Harvest Investment Services, LLC | 3 272 | 0,62 | 571 | 1,06 | ||||
| 2025-08-07 | 13F | CENTRAL TRUST Co | 378 | 0,00 | 66 | 1,54 | ||||
| 2025-08-14 | 13F | EP Wealth Advisors, Inc. | 1 525 | 7,02 | 266 | 7,26 | ||||
| 2025-08-14 | 13F | Raymond James Financial Inc | 31 507 | 0,83 | 5 501 | 1,16 | ||||
| 2025-08-13 | 13F | Congress Wealth Management LLC / DE / | 187 919 | −9,05 | 32 813 | −8,76 | ||||
| 2025-07-25 | 13F | NorthRock Partners, LLC | 64 | 0,00 | 11 | 0,00 | ||||
| 2025-08-04 | 13F | Creative Financial Designs Inc /adv | 3 531 | −2,99 | 617 | −2,69 | ||||
| 2025-07-14 | 13F | AdvisorNet Financial, Inc | 1 375 | 49,62 | 240 | 50,94 | ||||
| 2025-07-15 | 13F | Regatta Capital Group, Llc | 5 639 | 985 | ||||||
| 2025-05-02 | 13F | Transcendent Capital Group LLC | 0 | −100,00 | 0 | |||||
| 2025-08-13 | 13F | Townsquare Capital Llc | 0 | −100,00 | 0 |